Fibonacci Daily G7 Pairs: USD/JPY Close to 50.0% Level
MarketsFN Team
Fibonacci retracement analysis for the seven major G7 forex pairs on Wednesday, 21 October 2026. Each pair is covered on two timeframes — the full daily trend for a longer-term view and the 30-minute intraday picture. Key levels at 23.6%, 38.2%, 50%, 61.8% and 78.6% mark potential support and resistance zones.
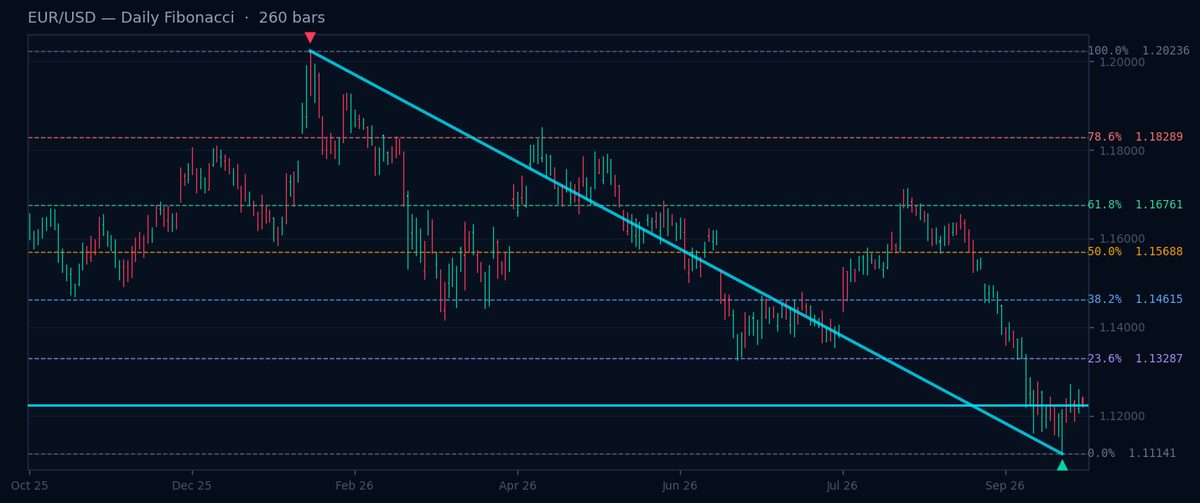
EUR/USD — Daily Fibonacci
Downtrend ↓ · Current: 1.12233
EUR/USD is in a downtrend at 1.12233, facing resistance at key Fibonacci levels: 61.8% (1.16761), 50.0% (1.15688), and 38.2% (1.14615). The pair remains below the swing high of 1.20236, with 1.11141 as the recent low. A break above 1.14615 could signal a short-term reversal, but the broader downtrend persists. Traders should watch for rejection at these levels to confirm continuation.
EUR/USD — 30-min Fibonacci
Uptrend ↑ · Current: 1.12233
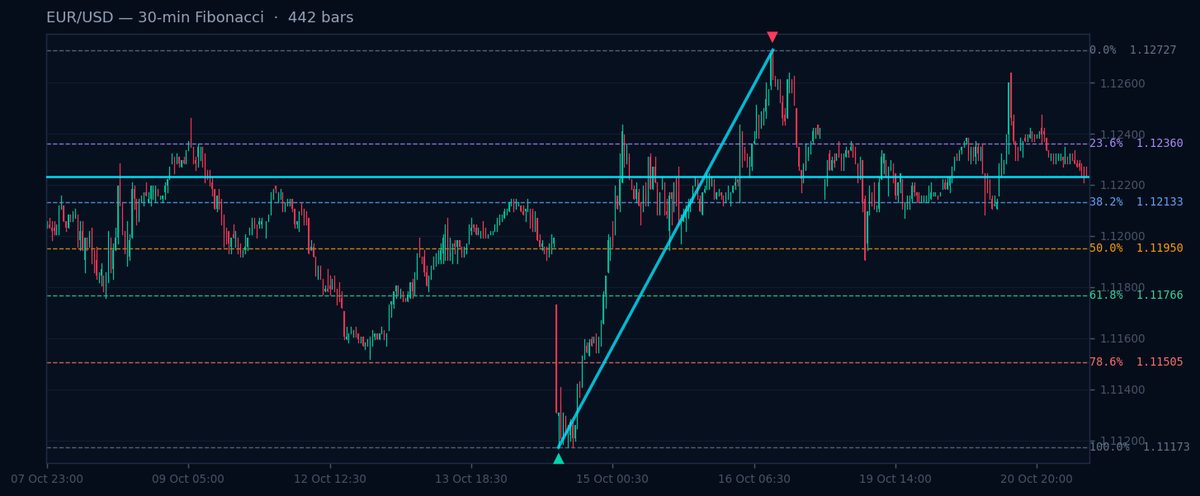
EUR/USD is in an uptrend at 1.12233, with support at 38.2% (1.12133), 50.0% (1.1195), and 61.8% (1.11766). The pair recently bounced from 1.11173, targeting 1.12727. Holding above 1.12133 suggests bullish momentum, but a break below 1.11766 may invalidate the uptrend. Short-term traders should monitor these levels for potential entries.
GBP/USD — Daily Fibonacci
Uptrend ↑ · Current: 1.33767
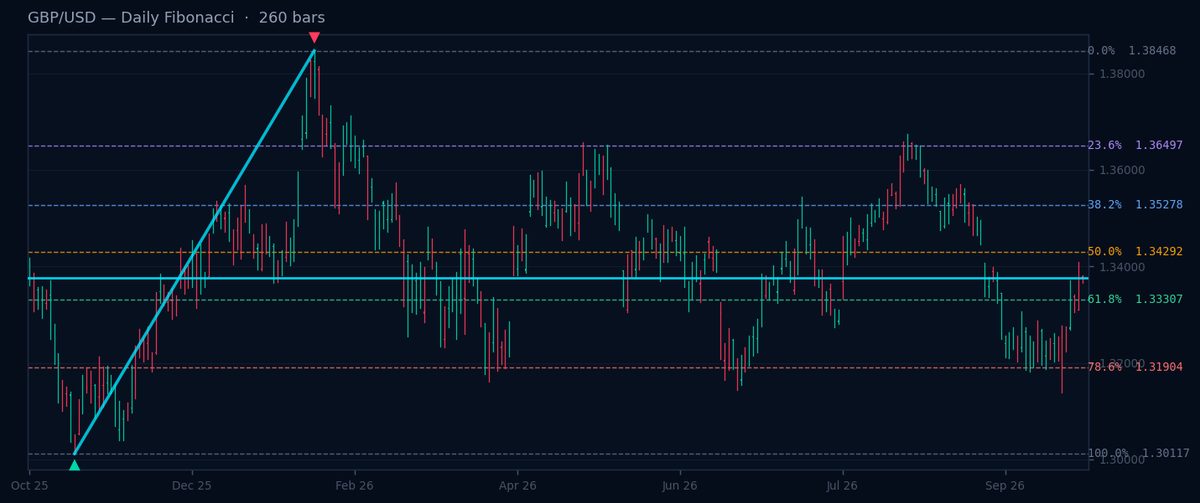
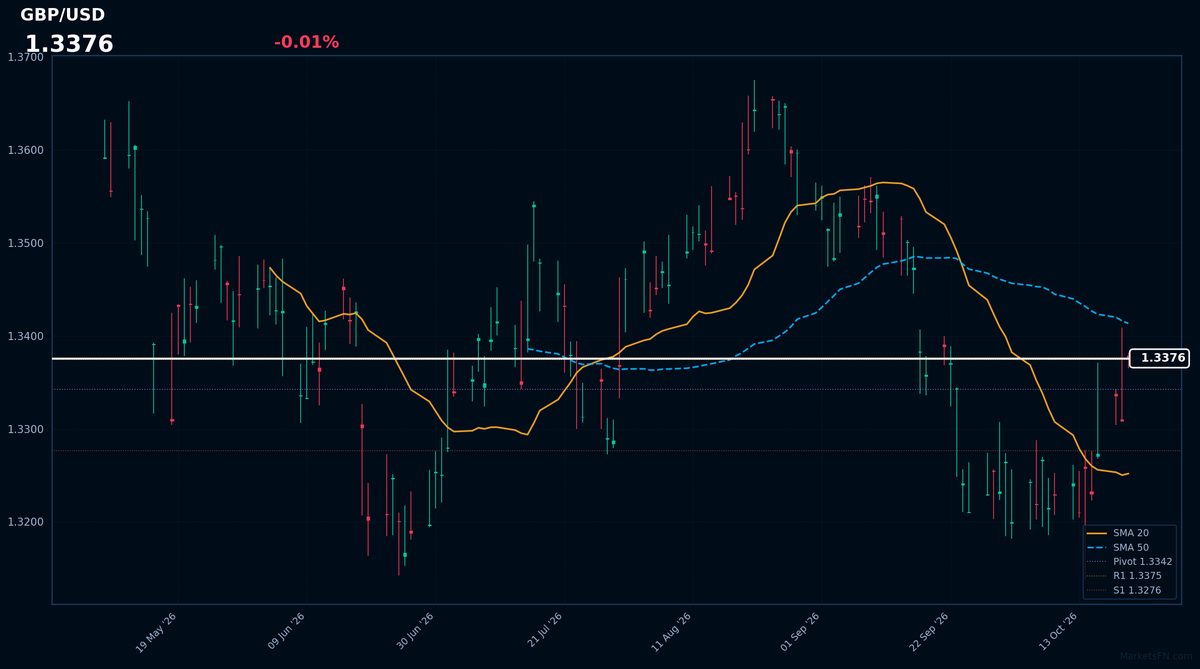
GBP/USD is in an uptrend at 1.33767, with resistance at 38.2% (1.35278) and 50.0% (1.34292), while 61.8% (1.33307) acts as support. The pair aims to retest 1.38468, but consolidation near 1.34292 is likely. A break above 1.35278 could accelerate gains, while a drop below 1.33307 may signal a pullback.
GBP/USD — 30-min Fibonacci
Uptrend ↑ · Current: 1.33767
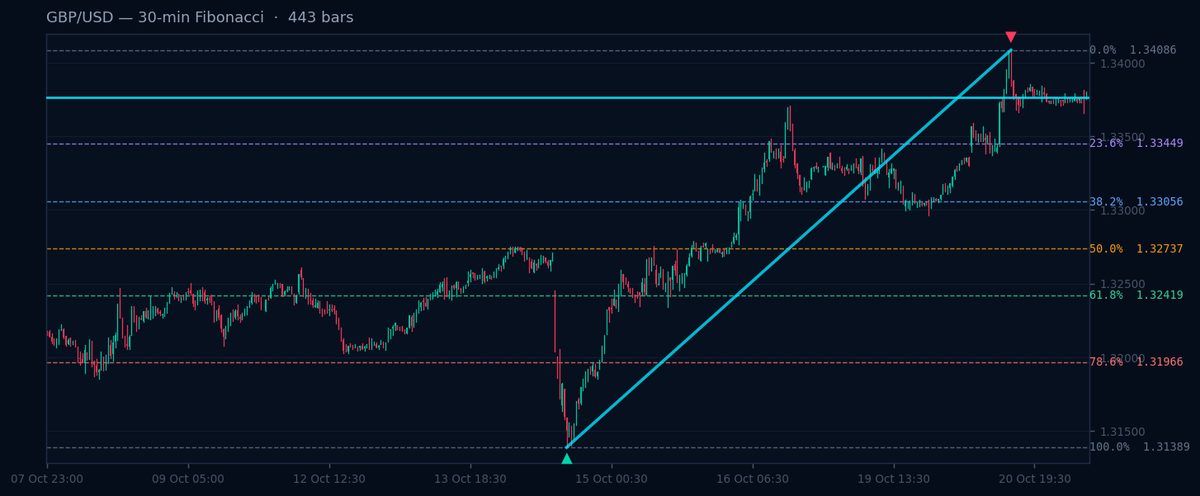
GBP/USD is bullish at 1.33767, with support at 38.2% (1.33056), 50.0% (1.32737), and 61.8% (1.32419). The pair recently rose from 1.31389, targeting 1.34086. Holding above 1.33056 confirms strength, but a break below 1.32419 may indicate a correction. Short-term traders should watch these levels.
USD/JPY — Daily Fibonacci
Uptrend ↑ · Current: 158.174
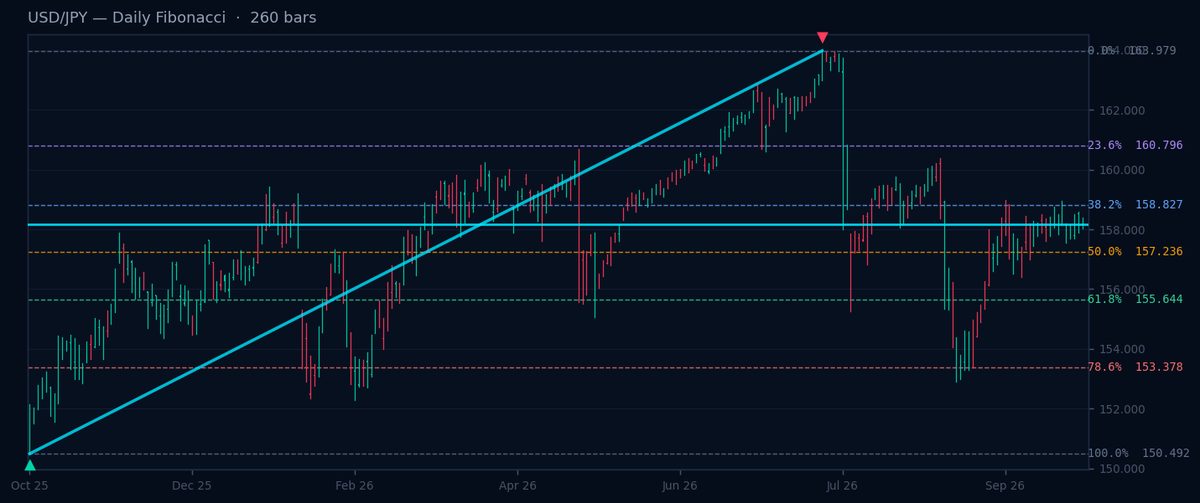
USD/JPY is in an uptrend at 158.174, with resistance at 38.2% (158.827) and support at 50.0% (157.236) and 61.8% (155.644). The pair aims to retest 163.979, but 158.827 may cap gains. A break below 157.236 could signal a deeper pullback. Traders should monitor these levels for direction.
USD/JPY — 30-min Fibonacci
Uptrend ↑ · Current: 158.150
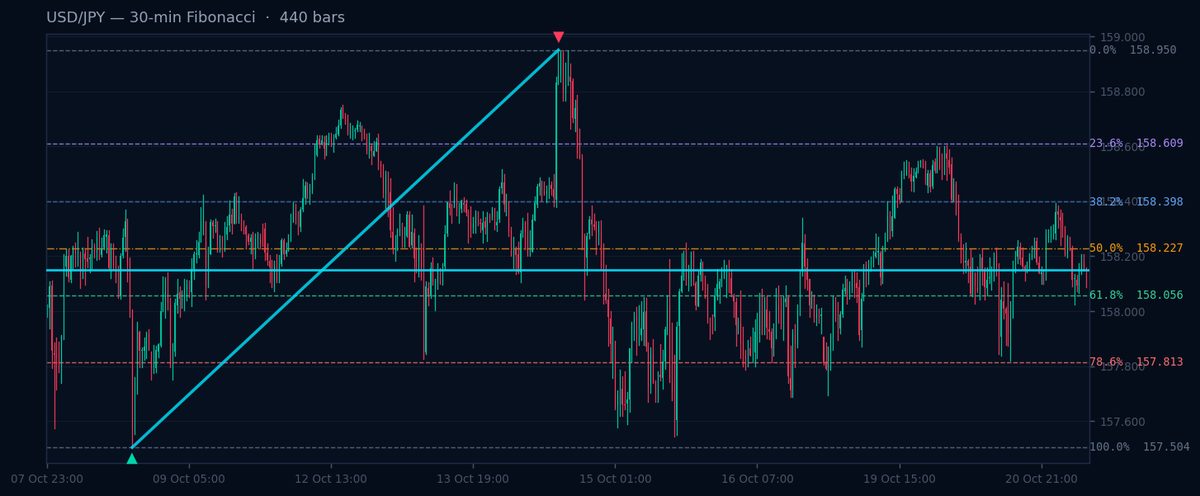
USD/JPY is bullish at 158.15, with resistance at 38.2% (158.398) and support at 61.8% (158.056). The pair recently tested 158.95, with 157.504 as the low. Holding above 158.056 suggests upside potential, but a break below may weaken the uptrend. Short-term traders should watch these levels.
MarketsFN Tools
Explore Fibonacci Levels & Learn Forex Trading
Use our interactive Fibonacci Levels Tool to analyse any major forex pair in real time — daily or intraday — and accelerate your learning with our free Forex Trading Course.
USD/CHF — Daily Fibonacci
Uptrend ↑ · Current: 0.82531
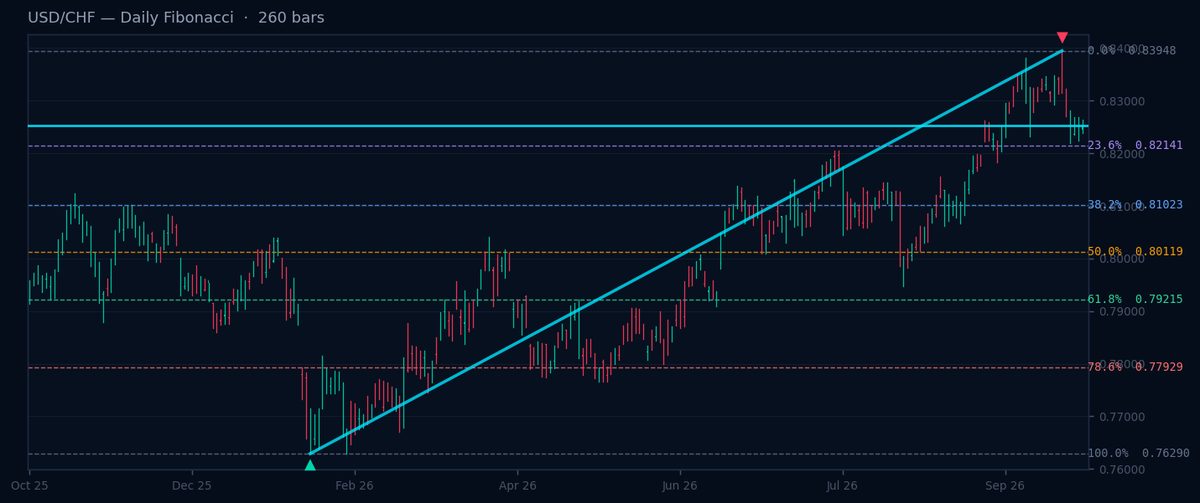
USD/CHF is in an uptrend at 0.82531, with support at 38.2% (0.81023), 50.0% (0.80119), and 61.8% (0.79215). The pair targets 0.83948, but consolidation near 0.81023 is likely. A break below 0.80119 may signal a correction. Traders should watch these levels for confirmation.
USD/CHF — 30-min Fibonacci
Downtrend ↓ · Current: 0.82531
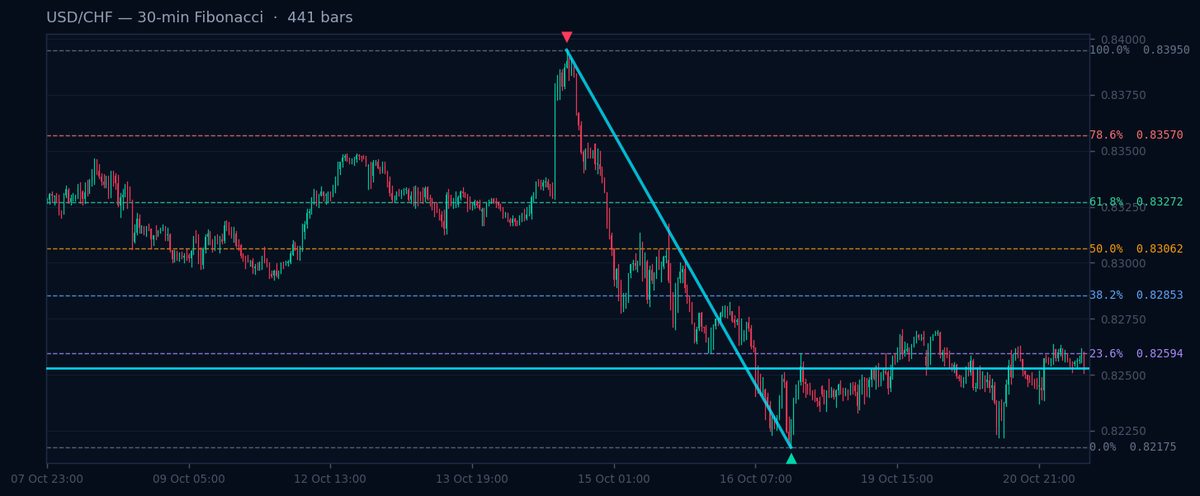
USD/CHF is in a downtrend at 0.82531, facing resistance at 61.8% (0.83272), 50.0% (0.83062), and 38.2% (0.82853). The pair recently fell from 0.8395, with 0.82175 as support. A break above 0.82853 may ease selling pressure, but the downtrend remains intact.
AUD/USD — Daily Fibonacci
Uptrend ↑ · Current: 0.70200
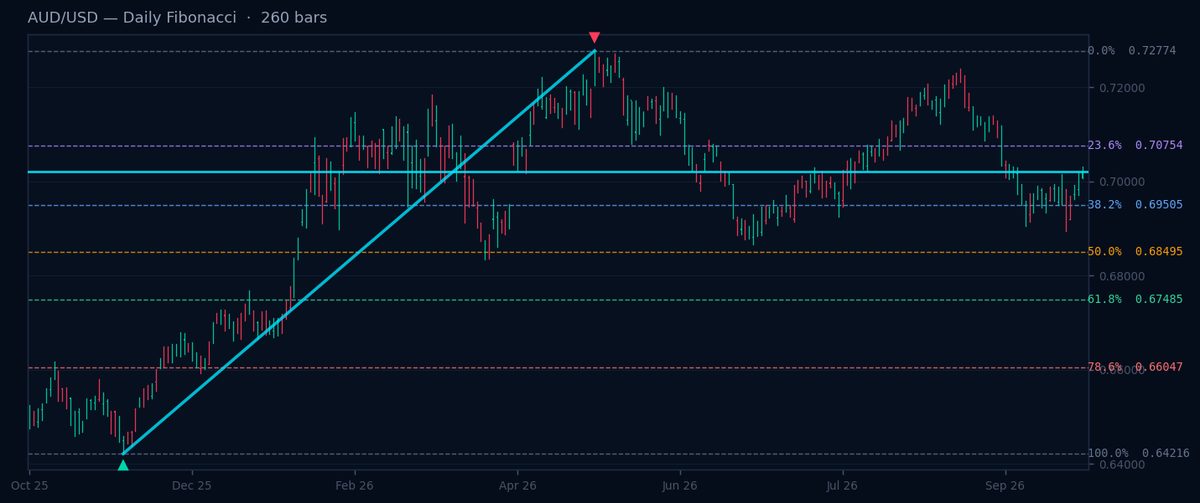
AUD/USD is in an uptrend at 0.702, with support at 38.2% (0.69505), 50.0% (0.68495), and 61.8% (0.67485). The pair targets 0.72774, but 0.69505 is key support. A break below 0.68495 may signal a pullback. Traders should monitor these levels for direction.
AUD/USD — 30-min Fibonacci
Uptrend ↑ · Current: 0.70200
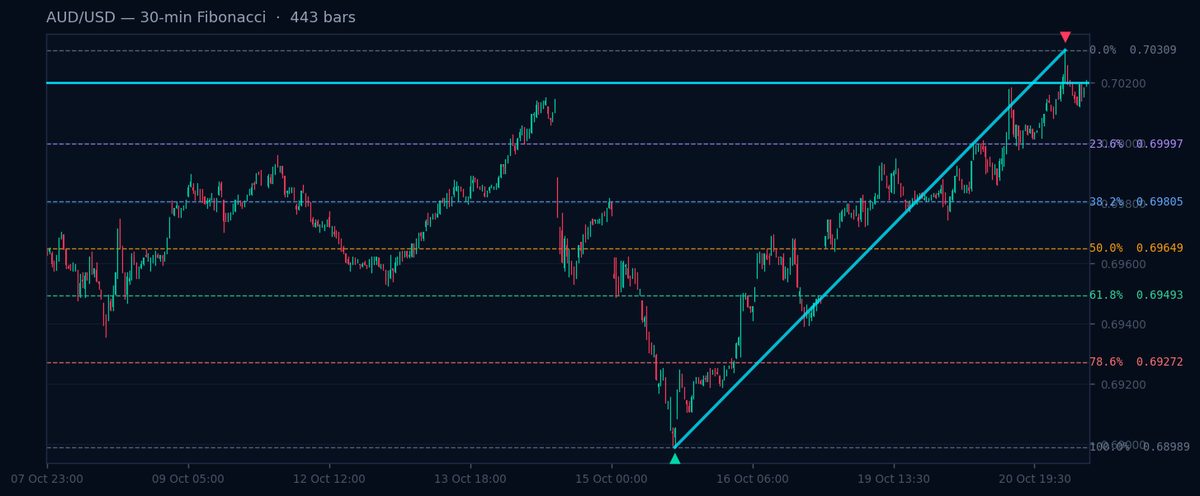
AUD/USD is bullish at 0.702, with support at 38.2% (0.69805), 50.0% (0.69649), and 61.8% (0.69493). The pair recently rose from 0.68989, targeting 0.70309. Holding above 0.69805 confirms strength, but a break below 0.69493 may weaken the uptrend.
USD/CAD — Daily Fibonacci
Uptrend ↑ · Current: 1.40607
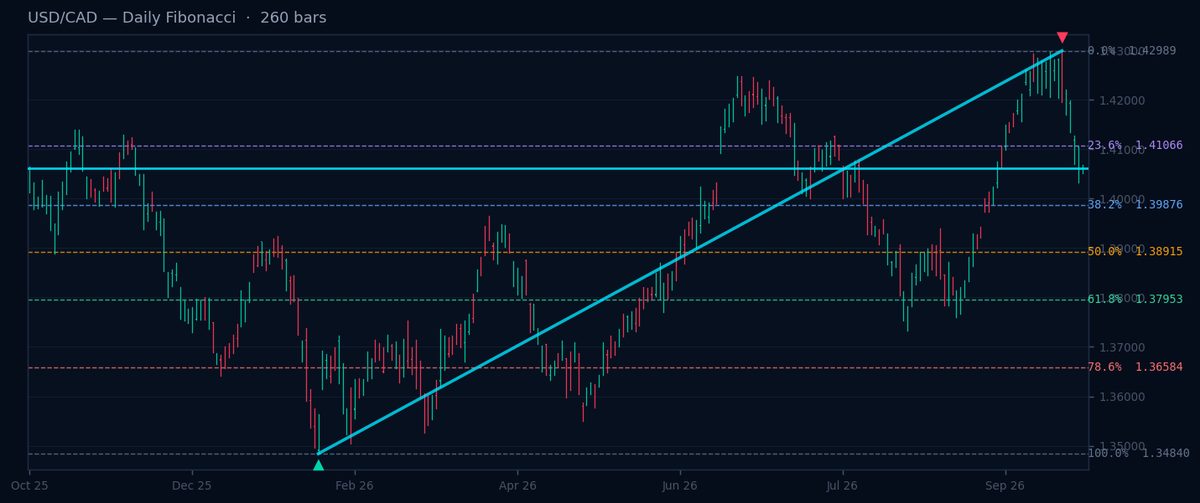
USD/CAD is in an uptrend at 1.40607, with support at 38.2% (1.39876), 50.0% (1.38915), and 61.8% (1.37953). The pair targets 1.42989, but 1.39876 is key support. A break below 1.38915 may signal a correction. Traders should watch these levels.
USD/CAD — 30-min Fibonacci
Downtrend ↓ · Current: 1.40607
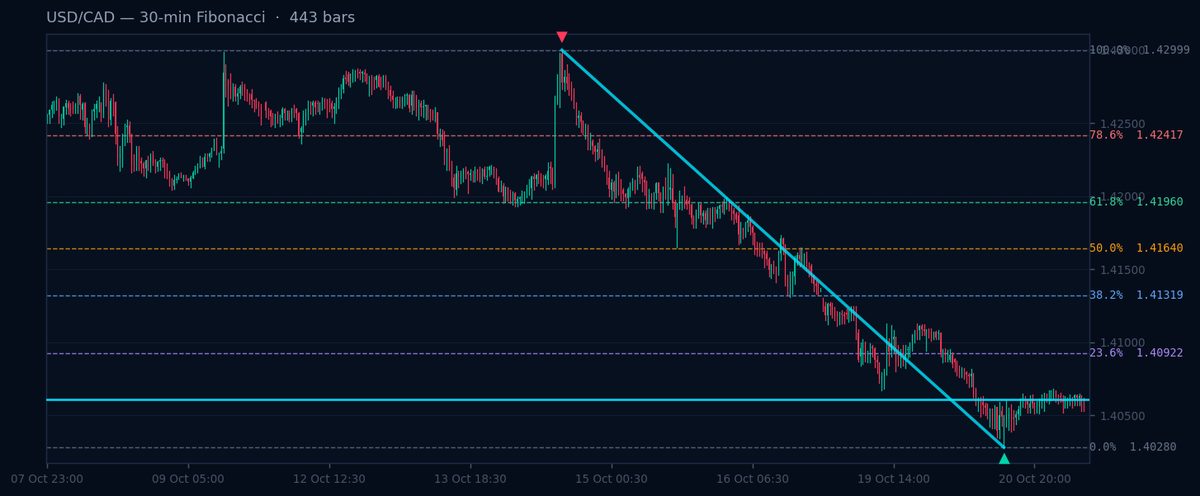
USD/CAD is in a downtrend at 1.40607, facing resistance at 61.8% (1.4196), 50.0% (1.4164), and 38.2% (1.41319). The pair recently fell from 1.42999, with 1.4028 as support. A break above 1.41319 may ease selling pressure, but the downtrend persists.
NZD/USD — Daily Fibonacci
Downtrend ↓ · Current: 0.56796
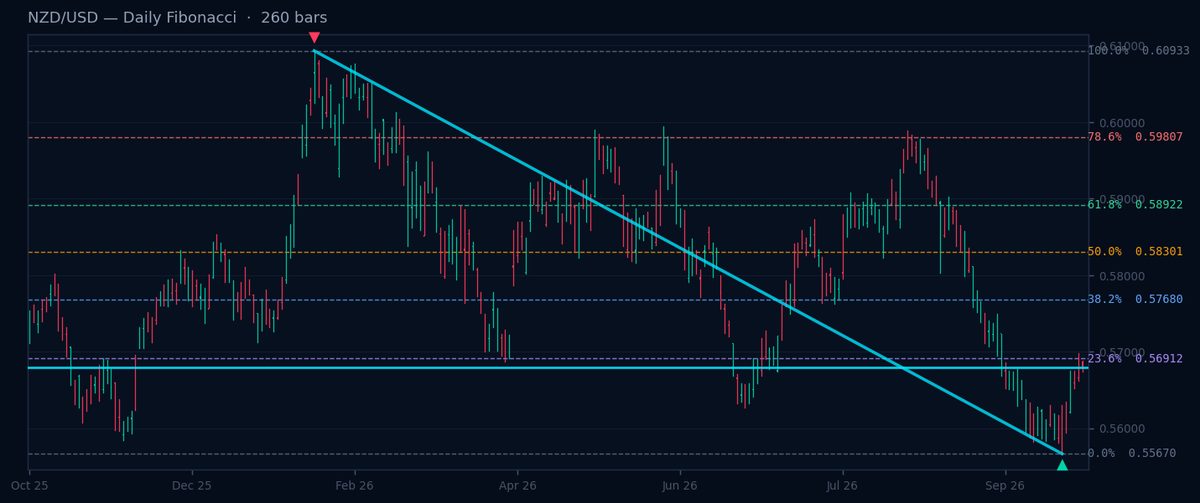
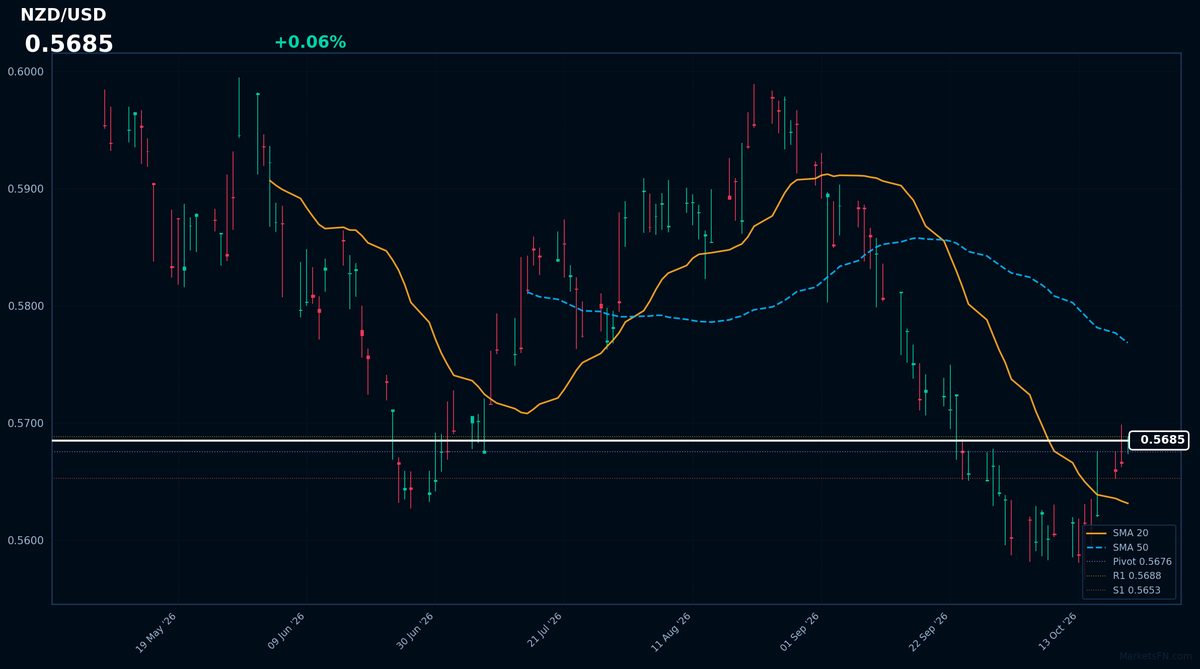
NZD/USD is in a downtrend at 0.56796, facing resistance at 61.8% (0.58922), 50.0% (0.58301), and 38.2% (0.5768). The pair remains below 0.60933, with 0.5567 as support. A break above 0.5768 may signal a short-term rebound, but the downtrend dominates.
NZD/USD — 30-min Fibonacci
Uptrend ↑ · Current: 0.56796
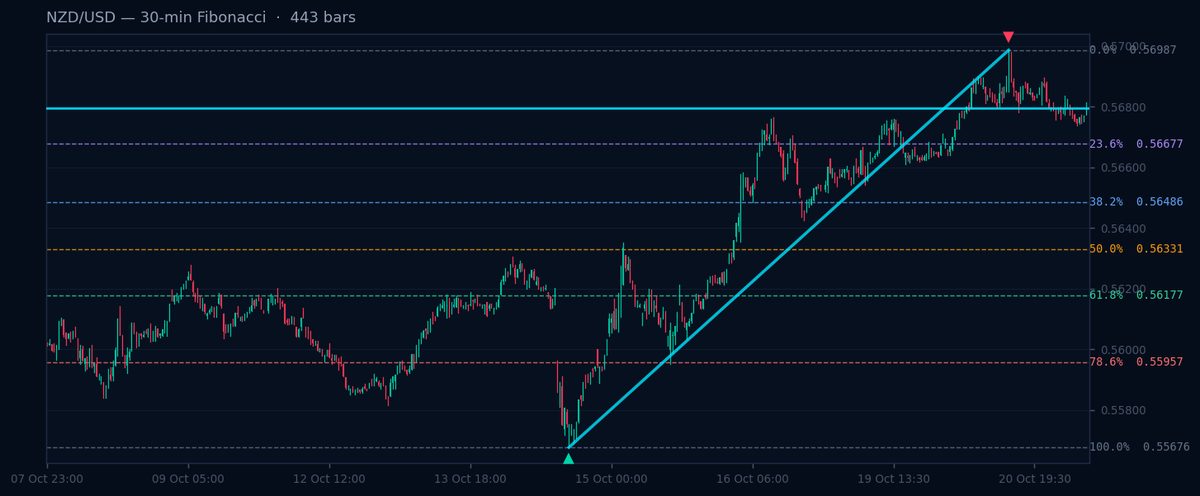
NZD/USD is bullish at 0.56796, with support at 38.2% (0.56486), 50.0% (0.56331), and 61.8% (0.56177). The pair recently rose from 0.55676, targeting 0.56987. Holding above 0.56486 confirms strength, but a break below 0.56177 may weaken the uptrend.
Dashboard
Insider Trading
Track real-time SEC Form 4 filings — see what company insiders are buying and selling.
Dashboard
Hedge Funds 13F Tracker
Monitor quarterly 13F filings — discover what the world's top hedge funds are holding.
Disclaimer
This article is for educational and informational purposes only and does not constitute financial advice or a recommendation to buy or sell any financial instrument. Fibonacci retracement levels are technical analysis tools used to identify potential support and resistance zones. All trading involves risk, including the possible loss of principal. Past performance is no guarantee of future results. You are solely responsible for your own investment decisions.