NZD/USD: Down 0.53% to 0.5805 — RSI Oversold
MarketsFN Team
NZD/USD: Down 0.53% to 0.5805 — RSI Oversold
Published: September 10, 2026 · MarketsFN Team · US Session
| Pair | Rate | Change | RSI(14) | SMA-20 | SMA-50 | 52W High | 52W Low | Pivot | R1 | S1 |
|---|---|---|---|---|---|---|---|---|---|---|
| NZD/USD | 0.5805 | -0.53% | 25.2 | 0.5903 | 0.5849 | 0.6075 | 0.5581 | 0.5843 | 0.5857 | 0.5822 |
📊 Support & Resistance Levels
Dynamic Trendlines
| Level | Type | Direction | Distance |
|---|---|---|---|
| 0.5782 | 20d Support | ↘ descending | -0.39% / 22.9 pips |
| 0.5911 | 20d Resistance | ↘ descending | +1.83% / 106.4 pips |
| 0.5821 | 50d Support | ↗ ascending | +0.28% / 16.1 pips |
| 0.6053 | 50d Resistance | ↗ ascending | +4.27% / 247.9 pips |
Static Levels
| Level | Type | Touches | Distance |
|---|---|---|---|
| 0.5994 | Resistance | 2× | +2.50% / 146.4 pips |
| 0.5831 | Support | 2× | -0.27% / 16.0 pips |
| 0.5814 | Support | 2× | -0.58% / 33.6 pips |
| 0.5710 | Support | 2× | -2.36% / 137.9 pips |
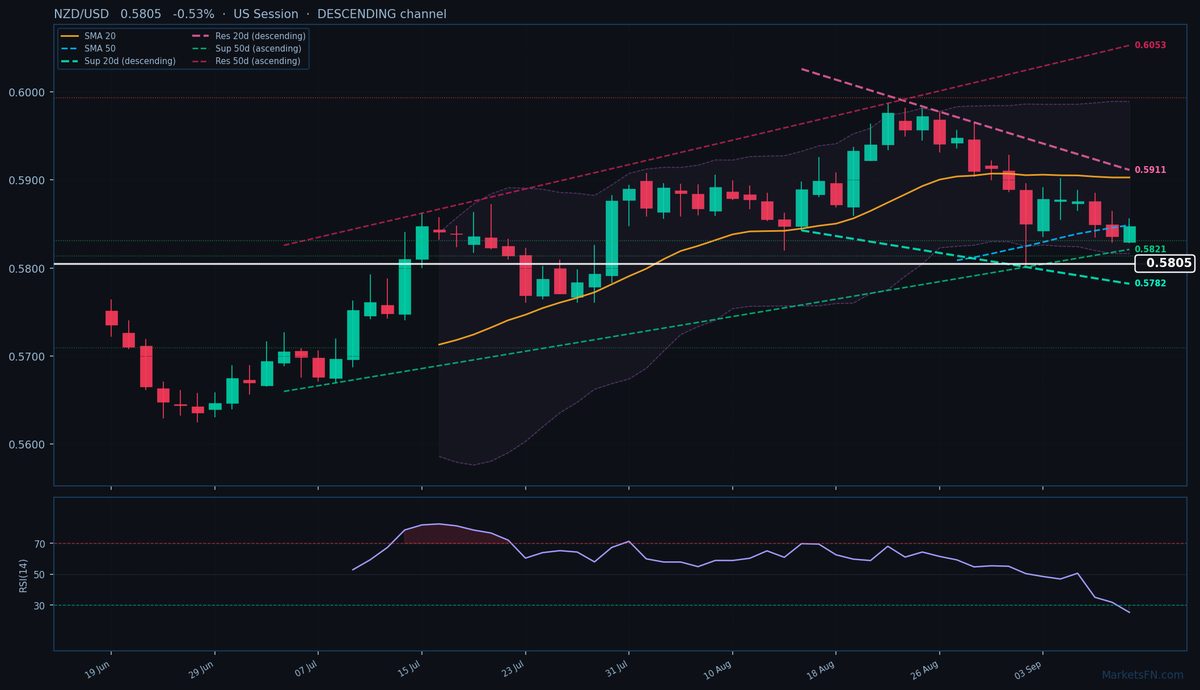
NZD/USD is trading at 0.5805 (-0.53%), accelerating its downtrend as it breaches both the 20-day (0.5903) and 50-day (0.5849) SMAs with conviction. The pair now sits 1.12% (22.9 pips) above the descending 20-day dynamic support trendline at 0.5782, while the descending 20-day resistance looms 1.09% (106.4 pips) overhead at 0.5911. This contrasts sharply with the ascending 50-day channel, where support at 0.5821 (16.1 pips below) is being tested and resistance stands 3.51% (247.9 pips) higher at 0.6053 — highlighting a bearish near-term structure despite the broader uptrend.
Static support at S1 (0.5831, 16.0 pips above) failed to hold, exposing S2 at 0.5814 (33.6 pips below) as the next floor. The RSI at 25.2 confirms extreme oversold conditions, but with price action breaking through multiple technical layers, this may signal capitulation rather than a reversal opportunity. The nearest static resistance (R1 at 0.5994) is a distant 146.4 pips away, underscoring the lack of immediate overhead bids.
With the 20-day channel descending and price below all near-term moving averages, the path of least resistance remains lower. A decisive break below the 20-day dynamic support (0.5782) would confirm the downtrend’s acceleration, while any rebound must reclaim S1 (0.5831) to stall bearish momentum. Watch today’s US session close — a finish below 0.5828 (today’s low) would mark the weakest daily settlement since August 2026.
Disclaimer
The content on MarketsFN.com is provided for educational and informational purposes only and does not constitute financial advice. All investments involve risk and past performance does not guarantee future results.