NZD/USD: Down 0.43% to 0.5850 — Descending Channel
MarketsFN Team
NZD/USD: Down 0.43% to 0.5850 — Descending Channel
Published: September 08, 2026 · MarketsFN Team · US Session
| Pair | Rate | Change | RSI(14) | SMA-20 | SMA-50 | 52W High | 52W Low | Pivot | R1 | S1 |
|---|---|---|---|---|---|---|---|---|---|---|
| NZD/USD | 0.5850 | -0.43% | 33.9 | 0.5903 | 0.5842 | 0.6075 | 0.5581 | 0.5876 | 0.5887 | 0.5865 |
📊 Support & Resistance Levels
Dynamic Trendlines
| Level | Type | Direction | Distance |
|---|---|---|---|
| 0.5796 | 20d Support | ↘ descending | -0.94% / 54.9 pips |
| 0.5953 | 20d Resistance | ↘ descending | +1.75% / 102.1 pips |
| 0.5814 | 50d Support | ↗ ascending | -0.62% / 36.1 pips |
| 0.6043 | 50d Resistance | ↗ ascending | +3.30% / 192.9 pips |
Static Levels
| Level | Type | Touches | Distance |
|---|---|---|---|
| 0.5994 | Resistance | 2× | +2.62% / 153.3 pips |
| 0.5831 | Support | 2× | -0.16% / 9.1 pips |
| 0.5814 | Support | 2× | -0.46% / 26.7 pips |
| 0.5710 | Support | 2× | -2.24% / 131.0 pips |
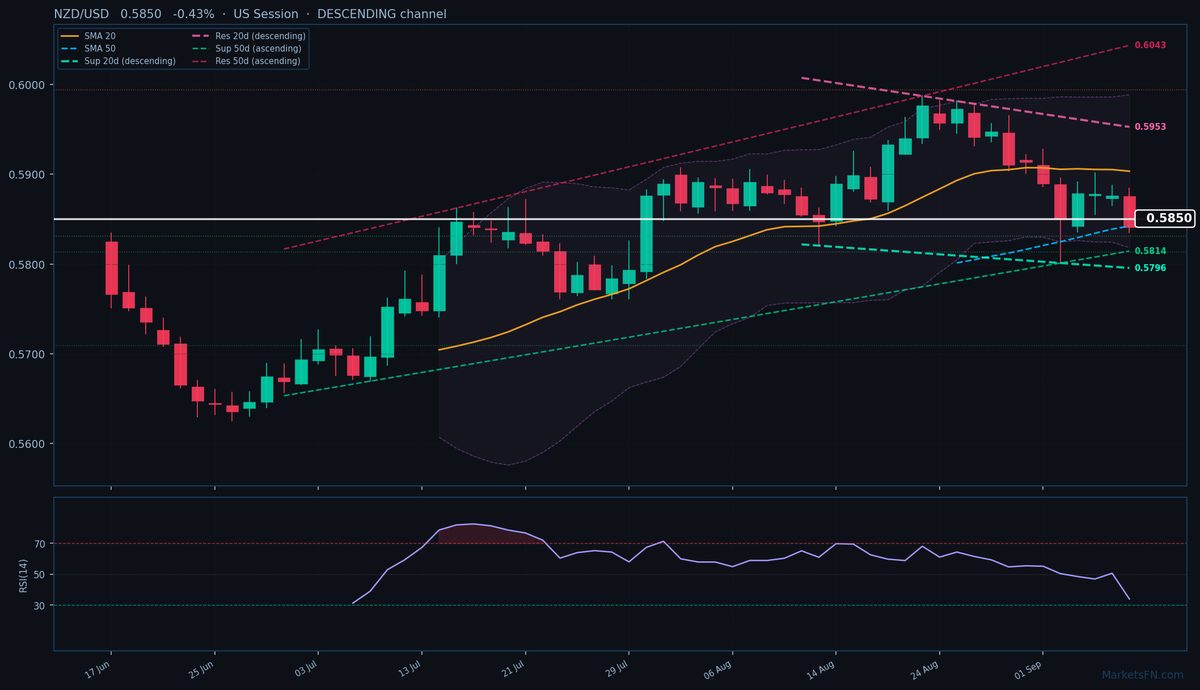
NZD/USD is trading at 0.5850 (-0.43%), caught in a tug-of-war between short-term bearish momentum and medium-term structural support. The pair is trapped between its 20-day SMA (0.5903, 53.3 pips above) and 50-day SMA (0.5842, just 8 pips below), signaling a consolidation phase after breaking below the 20-day SMA last week. Today’s 0.5835-0.5885 range shows indecision, with price hovering near the 50-day SMA like a magnet.
The 20-day dynamic channel is descending, with resistance at 0.5953 (+102.1 pips) and support at 0.5796 (-54.9 pips), while the 50-day channel remains ascending (support 0.5814, -36.1 pips; resistance 0.6043, +192.9 pips). This creates a technical battleground — bears dominate the short-term trend, but bulls still control the intermediate structure. Immediate static support at 0.5831 (9.1 pips below) aligns with the 50-day SMA, forming a critical floor. A break targets S2 at 0.5814 (26.7 pips down). Overhead, R1 at 0.5994 (153.3 pips above) looks distant without catalyst.
RSI at 33.9 shows neutral momentum, neither oversold nor confirming downside acceleration. The descending 20-day channel suggests selling pressure persists, but the ascending 50-day channel and SMA support create a base. Watch for a break of 0.5831 static support — if held, we could see a bounce toward 0.5903 (20-day SMA). A close below 0.5814 (50-day dynamic support) would confirm bearish continuation toward 0.5796 (20-day dynamic support). US session liquidity will test these levels.
Disclaimer
The content on MarketsFN.com is provided for educational and informational purposes only and does not constitute financial advice. All investments involve risk and past performance does not guarantee future results.