Nasdaq 100 52-Week Highs & Lows Radar: Atlassianoration (TEAM), Electronic Arts, (EA) and more
MarketsFN Team

Nasdaq 100 52-Week Highs & Lows Radar: Atlassianoration (TEAM), Electronic Arts, (EA) and more
Screening all 101 Nasdaq 100 constituents for stocks nearest to their 52-week high and their 52-week low. Data as of August 31, 2026. % Realized = 52-week total return.
Legend: RSI > 70 = overbought · RSI < 30 = oversold · Green % Realized = positive 52W return · Red = negative.
📈 Nearest to 52-Week High
Sectors represented: Technology (2), Communication Services (1), Healthcare (1), Consumer Cyclical (1)
| Ticker | Company | Sector | Price Last | % Realized | 52-Week High Date | RSI | % above MA200 | Trend |
|---|---|---|---|---|---|---|---|---|
| TEAM | Atlassian Corporation | Technology | $193.71 | +12.18% | 2026-08-31 | 80.0 | +78.5% | Above MA20, MA50, MA200 |
| EA | Electronic Arts, Inc | Communication Services | $209.70 | +0.38% | 2026-08-04 | — | — | — |
| CRWD | Crowdstrike Holdings Inc | Technology | $226.65 | +119.25% | 2026-08-27 | 61.5 | +60.8% | Above MA20, MA50, MA200 |
| BIIB | Biogen Inc | Healthcare | $218.25 | +56.31% | 2026-08-19 | 57.9 | +14.9% | Above MA20, MA50, MA200 |
| SBUX | Starbucks Corp | Consumer Cyclical | $106.85 | +19.01% | 2026-08-13 | 52.2 | +9.9% | Above MA20, MA50, MA200 |
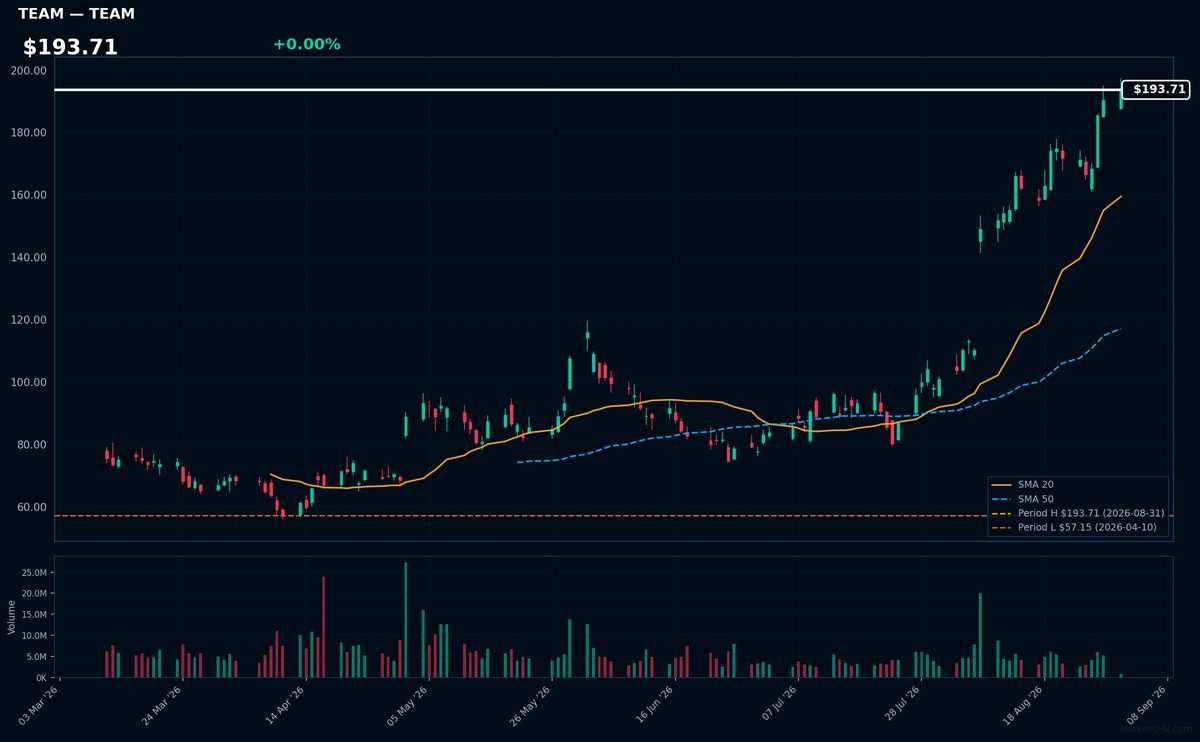
TEAM | Atlassian Corporation | Technology | Price Last: $193.71 | % Realized: +12.18% | RSI: 80.0 | % above MA200: +78.5% | Trend: Above MA20, MA50, MA200
Atlassian Corporation is a software company providing collaboration and productivity tools like Jira and Trello. Investors should care because its products are widely adopted by enterprises, driving recurring revenue and growth.
Atlassian's technicals indicate strong momentum: RSI(14) is 80.0, nearing overbought territory, with a bullish MA alignment (price > MA20 > MA50 > MA200) and 0.0% below its 52-Week high, suggesting a potential breakout.
Related headlines
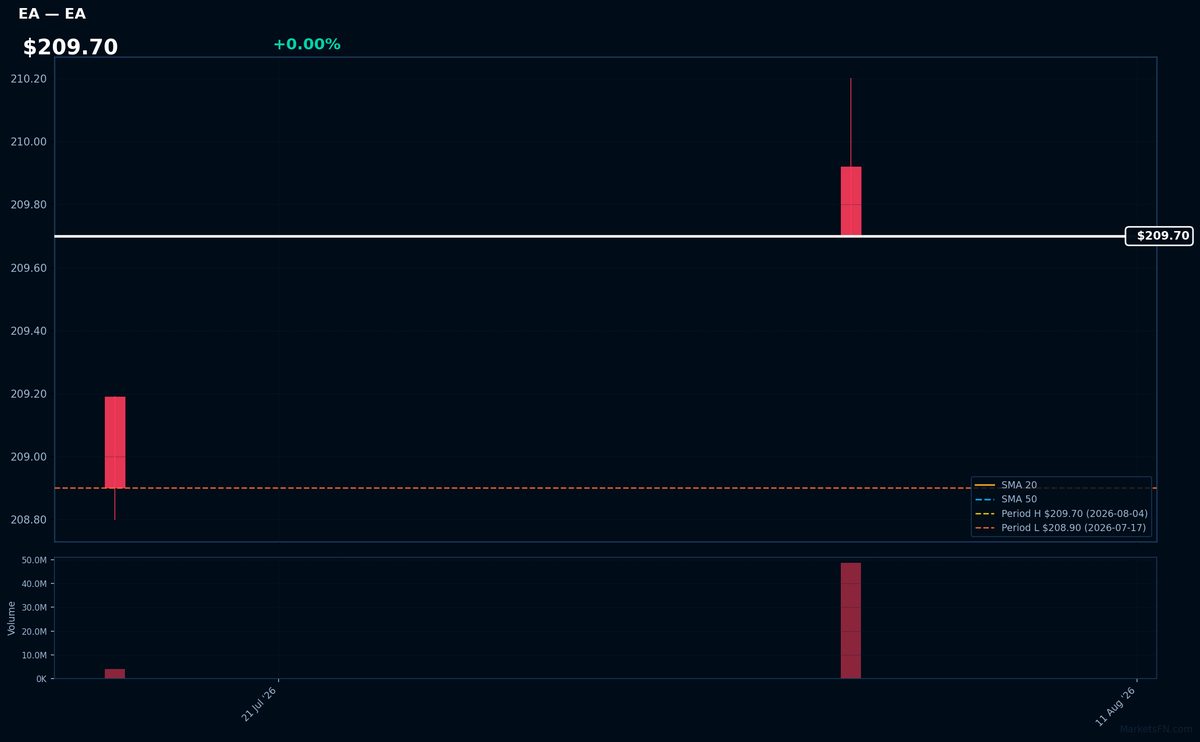
EA | Electronic Arts, Inc | Communication Services | Price Last: $209.70 | % Realized: +0.38% | RSI: — | % above MA200: — | Trend: —
Electronic Arts, Inc (EA) is a video game company that develops and publishes games such as FIFA and Madden NFL. Investors should care because its games have a large and dedicated player base, potentially driving revenue.
The stock is near its 52-Week high, up 0.4% over the period. Since MA and RSI data is incomplete or N/A, the technical situation cannot be fully assessed.
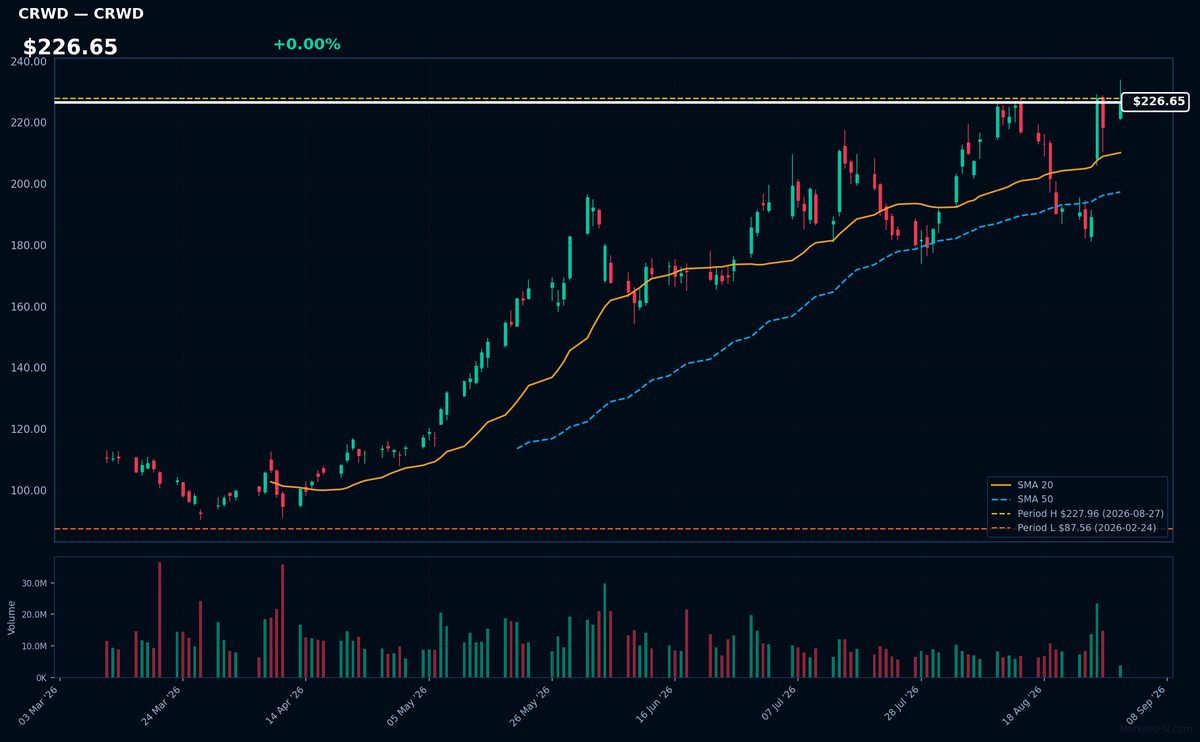
CRWD | Crowdstrike Holdings Inc | Technology | Price Last: $226.65 | % Realized: +119.25% | RSI: 61.5 | % above MA200: +60.8% | Trend: Above MA20, MA50, MA200
Crowdstrike Holdings Inc is a cybersecurity company providing cloud-delivered endpoint protection. Investors should care because its innovative Falcon platform has driven significant growth, making it a key player in the rapidly expanding cybersecurity market.
Crowdstrike's technicals indicate sustained uptrend with price > MA20 > MA50 > MA200, RSI(14) at 61.5, and 0.6% below its 52-Week high, suggesting momentum near a potential breakout level, with 119.3% return over the 52-Week period.
Related headlines
- Cognizant and CrowdStrike Protect Critical Operations Across Converged IT and OT Environments
- CrowdStrike Brings the Falcon Platform to Snowflake, Unifying Security and Data at Enterprise Scale
- CrowdStrike Expands Project QuiltWorks Across the Tech Ecosystem, Uniting More Data Sources to Secure Frontier AI Risk
- CrowdStrike and Google Announce the Falcon Platform on Google Cloud
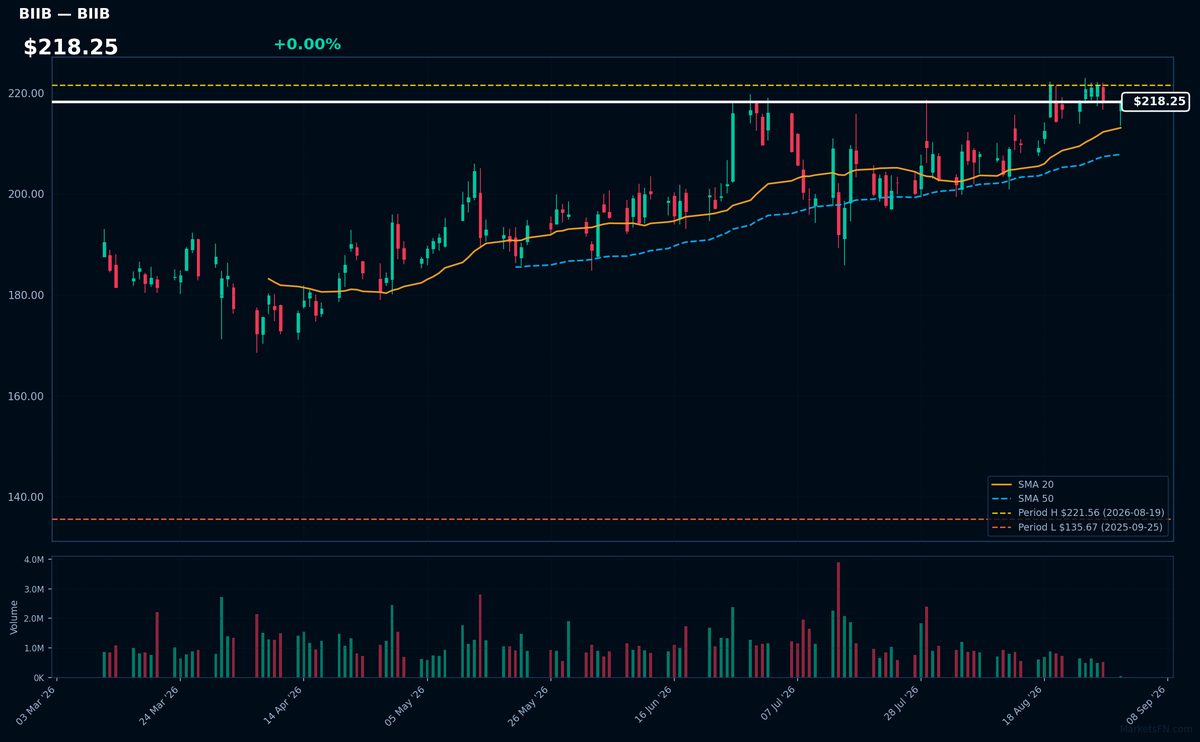
BIIB | Biogen Inc | Healthcare | Price Last: $218.25 | % Realized: +56.31% | RSI: 57.9 | % above MA200: +14.9% | Trend: Above MA20, MA50, MA200
Biogen Inc is a biotechnology company that develops treatments for neurological diseases, such as multiple sclerosis and Alzheimer's. Investors should care because its therapies address significant unmet medical needs, potentially driving revenue growth.
Biogen's technicals indicate sustained uptrend with price > MA20 > MA50 > MA200, RSI(14) at 57.9, and 1.5% below 52-Week high, suggesting momentum near a potential breakout level, with 56.3% 52-Week return.
Related headlines
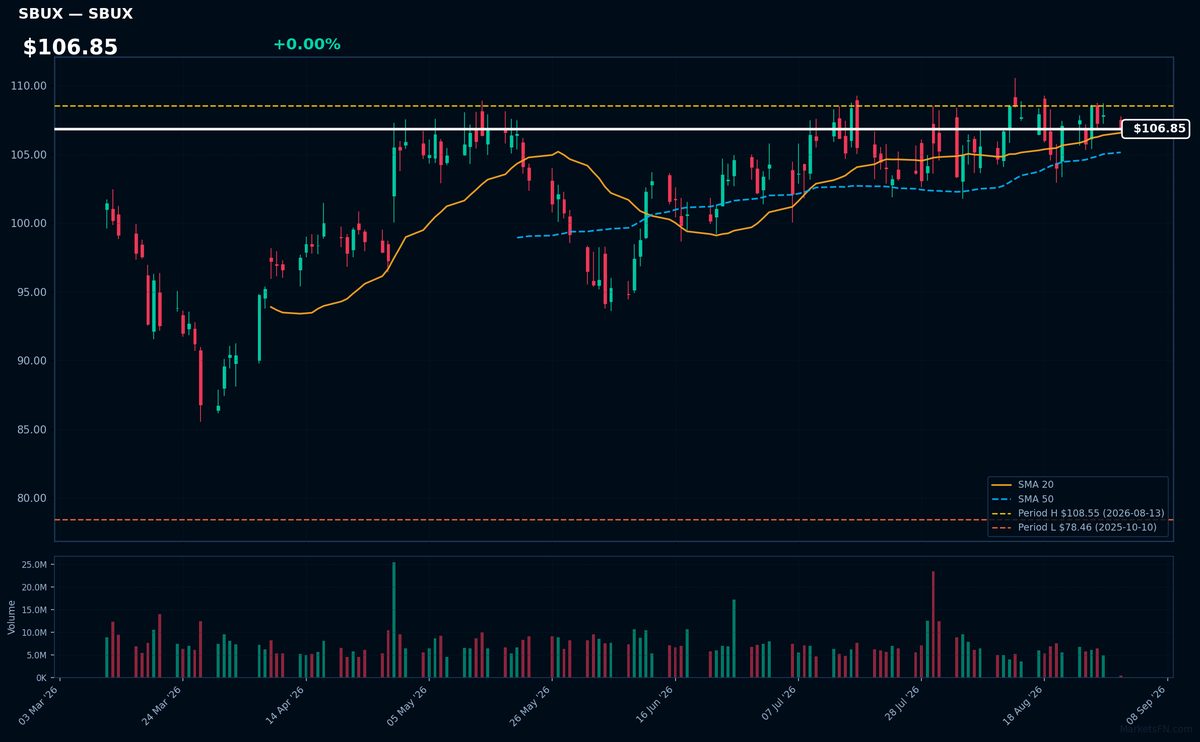
SBUX | Starbucks Corp | Consumer Cyclical | Price Last: $106.85 | % Realized: +19.01% | RSI: 52.2 | % above MA200: +9.9% | Trend: Above MA20, MA50, MA200
Starbucks Corp operates a global chain of coffeehouses, offering a wide range of coffee beverages and food products. Investors should care about its brand loyalty, global expansion, and same-store sales growth, which drive revenue and profitability.
The stock is in a sustained uptrend with price > MA20 > MA50 > MA200, RSI(14) at 52.2, and is 1.6% below its 52-Week high, indicating momentum; the 19.0% 52-Week return supports this, showing no warning signs.
Related headlines
- Starbucks investors push to split chair and CEO roles held by Niccol
- Is Starbucks Pumpkin Spice Latte basic? Martha Stewart answers in new ads
- Starbucks Union Calls for Boycott in Latest Test of Company Turnaround
- Starbucks Workers United Calls For Boycott Why Union Says SBUX Leaves Us With No Other Choice
📉 Nearest to 52-Week Low
Sectors represented: Communication Services (2), Consumer Defensive (2), Utilities (1)
| Ticker | Company | Sector | Price Last | % Realized | 52-Week Low Date | RSI | % above MA200 | Trend |
|---|---|---|---|---|---|---|---|---|
| EA | Electronic Arts, Inc | Communication Services | $209.70 | +0.38% | 2026-07-17 | — | — | — |
| EXC | Exelon Corp | Utilities | $43.18 | -0.44% | 2025-09-16 | 32.4 | -6.1% | Below MA20, MA50, MA200 |
| MNST | Monster Beverage Corp | Consumer Defensive | $46.06 | -26.50% | 2026-08-17 | 41.7 | -41.3% | Below MA20, MA50, MA200 |
| APP | Applovin Corp | Communication Services | $307.99 | -36.07% | 2026-08-24 | 35.0 | -37.3% | Below MA20, MA50, MA200 |
| PEP | PepsiCo Inc | Consumer Defensive | $139.85 | -6.94% | 2026-07-23 | 48.0 | -6.1% | Above MA50 · Below MA20, MA200 |
EA | Electronic Arts, Inc | Communication Services | Price Last: $209.70 | % Realized: +0.38% | RSI: — | % above MA200: — | Trend: —
Electronic Arts, Inc (EA) is a video game company that develops and publishes games such as FIFA and Madden NFL. Investors should care because its games have a large and dedicated player base, potentially driving revenue.
The stock is near its 52-Week high, up 0.4% over the period. Since MA and RSI data is incomplete or N/A, the technical situation cannot be fully assessed.
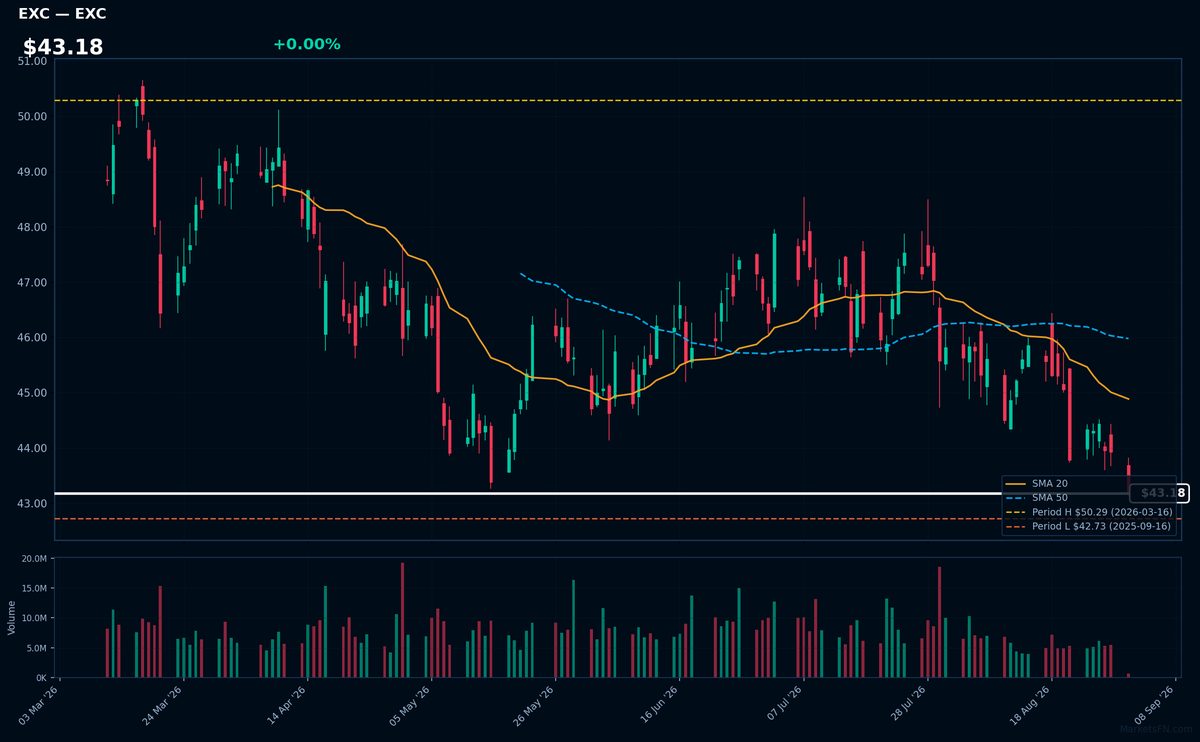
EXC | Exelon Corp | Utilities | Price Last: $43.18 | % Realized: -0.44% | RSI: 32.4 | % above MA200: -6.1% | Trend: Below MA20, MA50, MA200
Exelon Corp is a utility company that generates and distributes electricity, operating nuclear, natural gas, and renewable energy facilities. Investors care about its stable cash flows and dividend yield, given its role in meeting US energy demands.
Exelon Corp's technicals indicate a warning sign with an RSI(14) of 32.4, suggesting oversold conditions, and the stock is below MA20, MA50, and MA200, showing mixed signals. It's 1.1% above its 52-Week low, testing major support.
Related headlines
- Exelon Announces Key Leadership Position Changes
- Exelon Secures More Than $1 Billion in Customer Protections Through Pioneering Transmission Security Agreements
- Exelon high probability data center load falls 40%
- Exelon Corp (EXC) (Q2 2026) Earnings Call Highlights: Navigating Regulatory Hurdles and Data ...
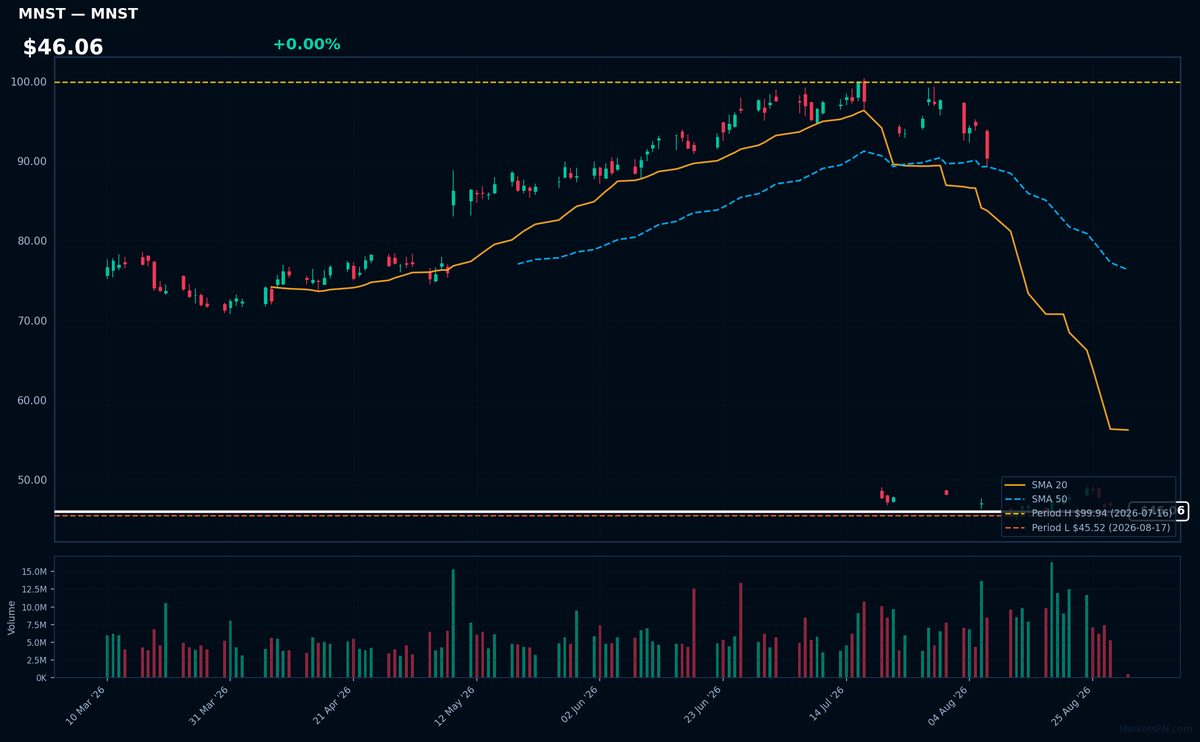
MNST | Monster Beverage Corp | Consumer Defensive | Price Last: $46.06 | % Realized: -26.50% | RSI: 41.7 | % above MA200: -41.3% | Trend: Below MA20, MA50, MA200
Monster Beverage Corp is a leading energy drink manufacturer with a portfolio of brands including Monster Energy. Investors care about its performance due to its dominant market position and growth prospects in the energy drink segment.
The stock is in a sustained downtrend with price ($46.06) below MA20, MA50, and MA200. RSI(14) is 41.7, nearing oversold territory. The stock is 1.2% above its 52-Week low, testing major support after a -26.5% 52-Week return, indicating a potential warning sign.
Related headlines
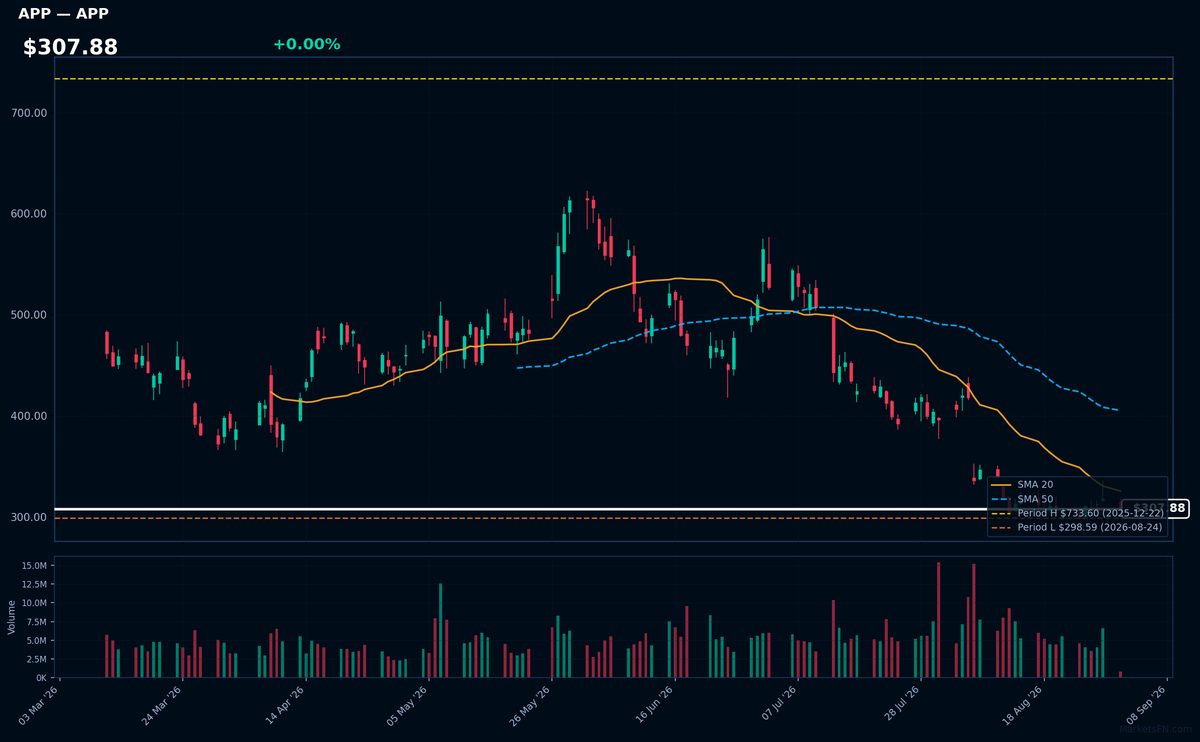
APP | Applovin Corp | Communication Services | Price Last: $307.99 | % Realized: -36.07% | RSI: 35.0 | % above MA200: -37.3% | Trend: Below MA20, MA50, MA200
Applovin Corp is a mobile technology company that enables advertisers to promote their apps through its platform, and app developers to grow their businesses; investors should care because its performance reflects mobile advertising and app development trends.
Applovin Corp's technicals indicate a sustained downtrend with price ($307.88) below MA20, MA50, and MA200; RSI(14) is 35.0, nearing oversold territory, and the stock is 3.1% above its 52-Week low, testing major support, potentially a warning sign.
Related headlines
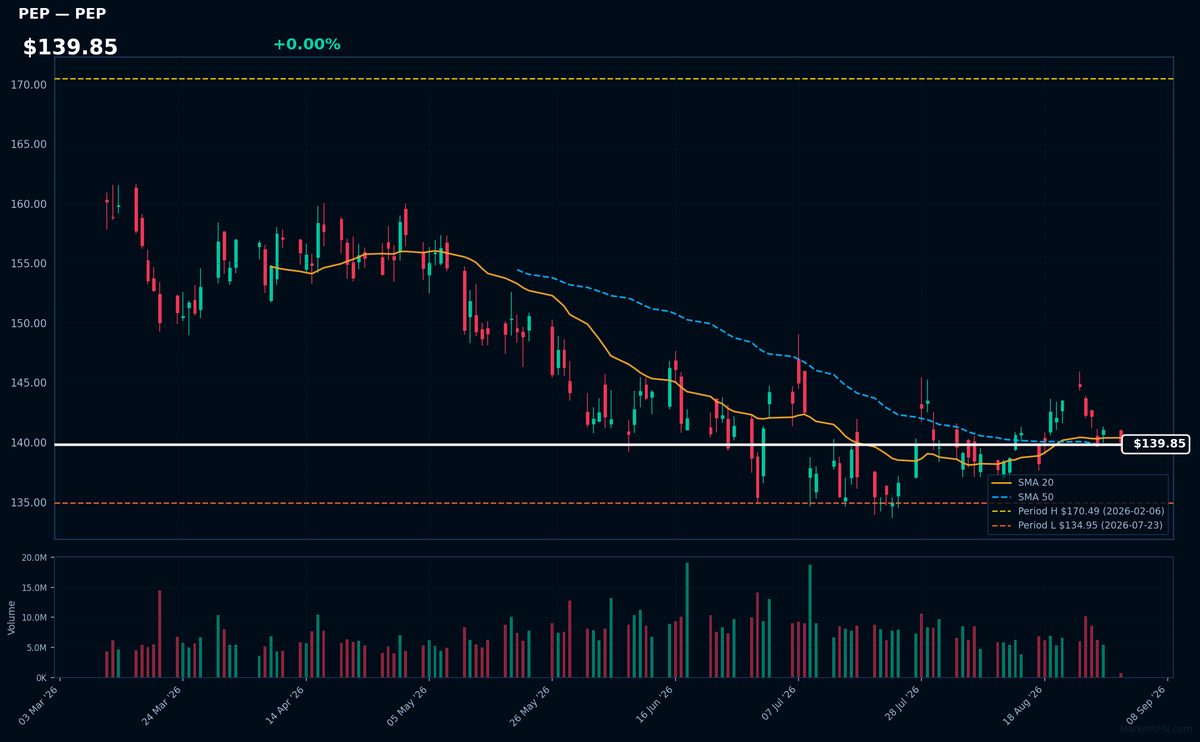
PEP | PepsiCo Inc | Consumer Defensive | Price Last: $139.85 | % Realized: -6.94% | RSI: 48.0 | % above MA200: -6.1% | Trend: Above MA50 · Below MA20, MA200
PepsiCo Inc is a diversified food and beverage company with popular brands like Pepsi, Lay's, and Gatorade, generating revenue through beverage sales, snack foods, and other categories, making it a significant player in the consumer staples sector.
PepsiCo's technicals indicate a mixed signal: RSI(14) at 48.0, price above MA50 but below MA20/MA200, and only 3.6% above its 52-Week low, suggesting a testing of major support with no clear momentum direction.
Related headlines
Market Commentary
The Nasdaq 100 stocks listed near 52-week extremes indicate a significant price movement, with some stocks reaching new highs and others hitting lows. Stocks like TEAM and EA are exactly at their 52-week highs, while CRWD, BIIB, and SBUX are marginally below their peaks. Conversely, EA is just 0.4% above its 52-week low, and other stocks like EXC, MNST, APP, and PEP are also near their lows.
The technology sector is driving these price levels, with companies like Atlassian Corporation and Crowdstrike Holdings performing well. Macro themes such as investor sentiment and market trends are also influencing these stocks. The presence of EA at both extremes highlights the volatility within the sector.
Key levels to watch include the 52-week highs and lows for these stocks. A breakout above the 52-week high or a breakdown below the 52-week low could be triggered by various catalysts, including earnings reports and broader market trends. Monitoring these levels and potential catalysts will be crucial in determining the future direction of these Nasdaq 100 stocks.
Methodology: All 101 Nasdaq 100 constituents screened. 52-week high = highest daily close over the past 252 trading days (approx. 1 year). 52-week low = lowest daily close over the same period. Distance = (current price / extreme − 1) × 100. Technical indicators computed on up to 1 year of daily OHLCV data.
Disclaimer: For informational purposes only. Not investment advice. Past performance is not indicative of future results.