Nasdaq 100 2026 YTD Highs & Lows Radar: Palantir (PLTR), Electronic Arts, (EA) and more
MarketsFN Team

Nasdaq 100 2026 YTD Highs & Lows Radar: Palantir (PLTR), Electronic Arts, (EA) and more
Screening all 101 Nasdaq 100 constituents for stocks nearest to their 2026 year-to-date high and their 2026 YTD low. Data as of September 01, 2026. % Realized = total return since Jan 1 2026.
Legend: RSI > 70 = overbought · RSI < 30 = oversold · Green % Realized = positive YTD return · Red = negative.
📈 Nearest to 2026 High
Sectors represented: Technology (4), Communication Services (1)
| Ticker | Company | Sector | Price Last | % Realized | 2026 YTD High Date | RSI | % above MA200 | Trend |
|---|---|---|---|---|---|---|---|---|
| PLTR | Palantir Technologies Inc | Technology | $186.38 | +11.03% | 2026-08-31 | 65.8 | +23.1% | Above MA20, MA50, MA200 |
| CRWD | Crowdstrike Holdings Inc | Technology | $231.00 | +103.71% | 2026-08-31 | 59.4 | +63.4% | Above MA20, MA50, MA200 |
| PAYX | Paychex Inc | Technology | $127.34 | +17.26% | 2026-08-31 | 67.6 | +22.6% | Above MA20, MA50, MA200 |
| TEAM | Atlassian Corporation | Technology | $194.17 | +25.47% | 2026-08-31 | 75.7 | +78.7% | Above MA20, MA50, MA200 |
| EA | Electronic Arts, Inc | Communication Services | $209.70 | +0.38% | 2026-08-04 | — | — | — |
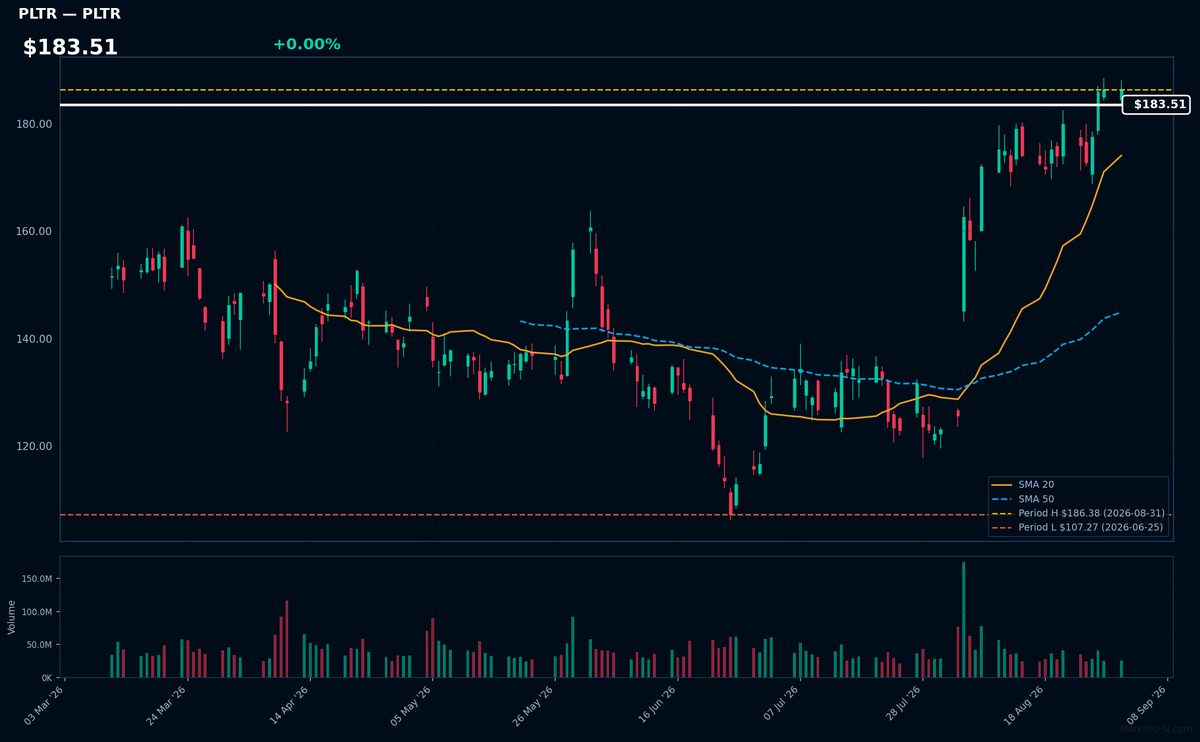
PLTR | Palantir Technologies Inc | Technology | Price Last: $186.38 | % Realized: +11.03% | RSI: 65.8 | % above MA200: +23.1% | Trend: Above MA20, MA50, MA200
Palantir Technologies Inc provides data integration and analytics software, enabling organizations to make informed decisions by leveraging complex data sets; investors should care as its solutions are critical for government and commercial clients seeking data-driven insights.
PLTR's RSI(14) is 65.8, indicating rising momentum as it's above 50; with price above MA20, MA50, and MA200, it shows a strong uptrend; being 0.0% below its 2026 YTD high suggests a potential breakout is imminent.
Related headlines
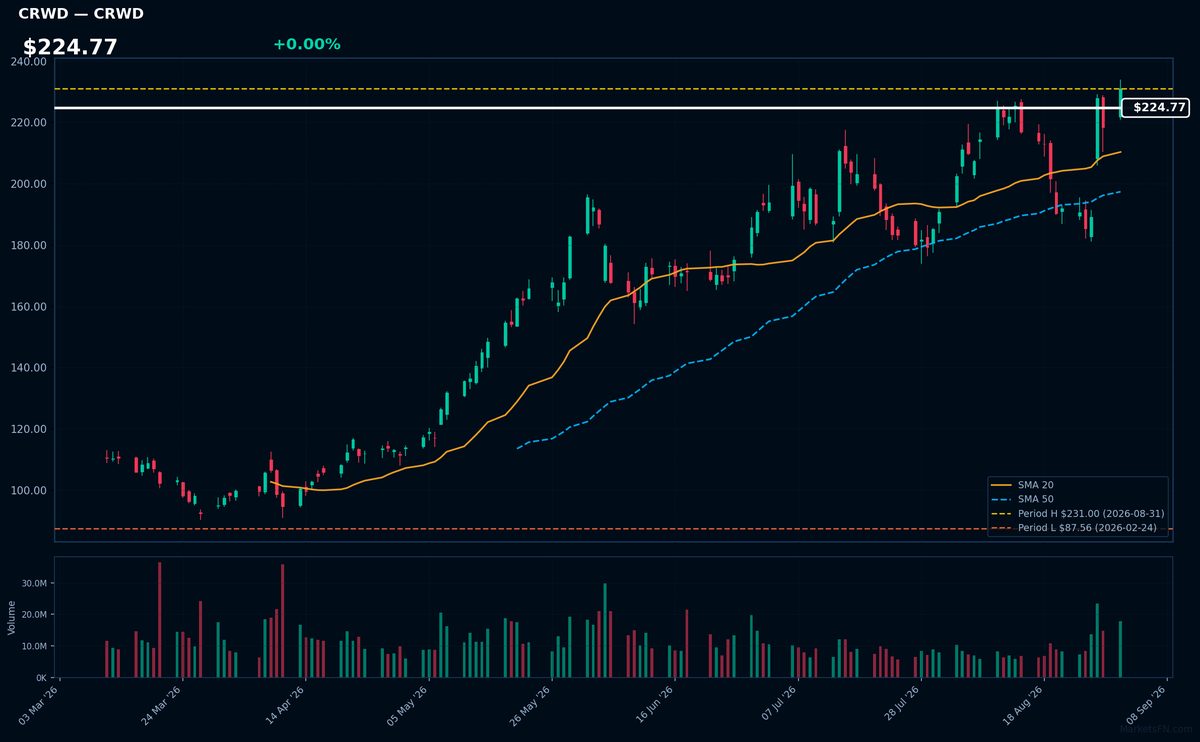
CRWD | Crowdstrike Holdings Inc | Technology | Price Last: $231.00 | % Realized: +103.71% | RSI: 59.4 | % above MA200: +63.4% | Trend: Above MA20, MA50, MA200
Crowdstrike Holdings Inc is a cybersecurity company providing cloud-delivered endpoint and cloud workload protection. Investors should care because its innovative solutions are in high demand, driving growth. Specific details about its products and services are not provided in the data.
Crowdstrike's current technical situation indicates sustained uptrend with bullish MA alignment: price ($224.77) > MA20 > MA50 > MA200. RSI(14) is 59.4, near its 2026 YTD high with 0.0% downside, suggesting potential breakout momentum.
Related headlines
- PANW Vs CRWD Vs OKTA Vs ZS: AI Threats Are Fueling Cybersecurity Stocks Which Has The Biggest Wall Street Upside?
- CrowdStrike Launches AI Partner Specialization, Defining Cybersecuritys Ecosystem for the Agentic Era
- Cognizant and CrowdStrike Protect Critical Operations Across Converged IT and OT Environments
- CrowdStrike Brings the Falcon Platform to Snowflake, Unifying Security and Data at Enterprise Scale
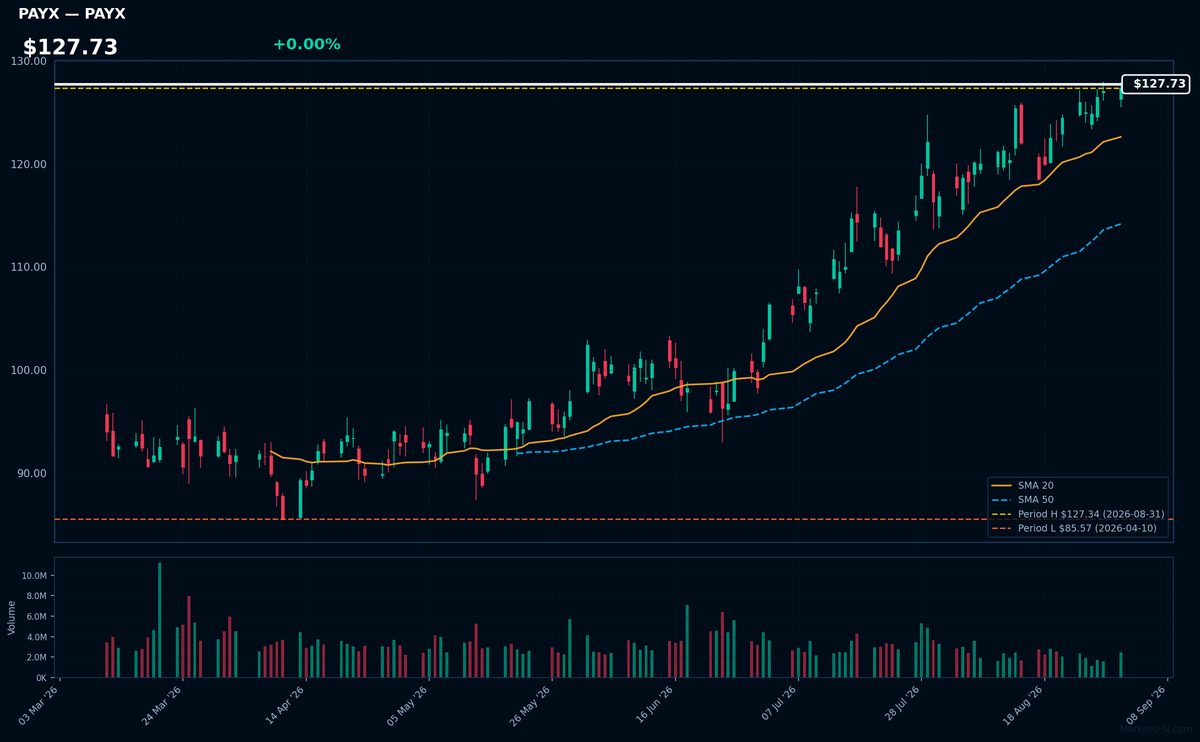
PAYX | Paychex Inc | Technology | Price Last: $127.34 | % Realized: +17.26% | RSI: 67.6 | % above MA200: +22.6% | Trend: Above MA20, MA50, MA200
Paychex Inc provides payroll processing, HR services, and benefits administration to businesses, helping them manage workforce costs and compliance; investors should care because its services are essential to companies, generating recurring revenue and relatively stable growth.
Paychex Inc's current technical situation indicates momentum, with RSI(14) at 67.6 and a bullish MA alignment (price > MA20 > MA50 > MA200); it's near its 2026 YTD high, up 17.3% YTD, suggesting sustained uptrend and potential breakout.
Related headlines
- WISE at Work: Early Results Show Paychex AI Is Reducing Payroll Errors and Improving Service Efficiency at Scale
- Paychex Expands Award-Winning Lifestyle Benefits to 2M+ Employees on the Paycor Platform
- Paychex Expands WISE to Deliver Workforce Intelligence Across Business Tools
- Paychex Named One of Selling Power's 60 Best Companies to Sell For
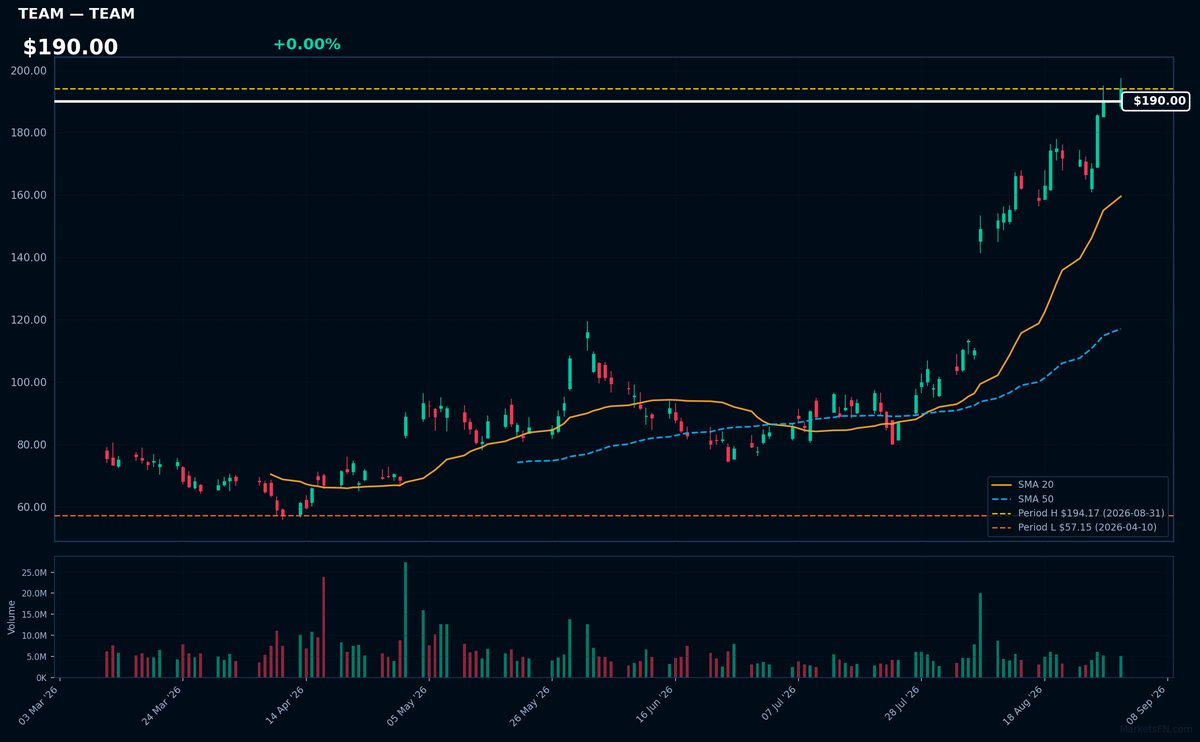
TEAM | Atlassian Corporation | Technology | Price Last: $194.17 | % Realized: +25.47% | RSI: 75.7 | % above MA200: +78.7% | Trend: Above MA20, MA50, MA200
Atlassian Corporation is a software company that provides collaboration and productivity tools like Jira and Trello. Investors should care because its products are widely adopted by enterprises, driving growth and profitability.
Atlassian's technicals indicate strong momentum: RSI(14) is 75.7, and the stock is in a sustained uptrend with price > MA20 > MA50 > MA200. It's 0.0% below its 2026 YTD high, suggesting a potential breakout.
Related headlines
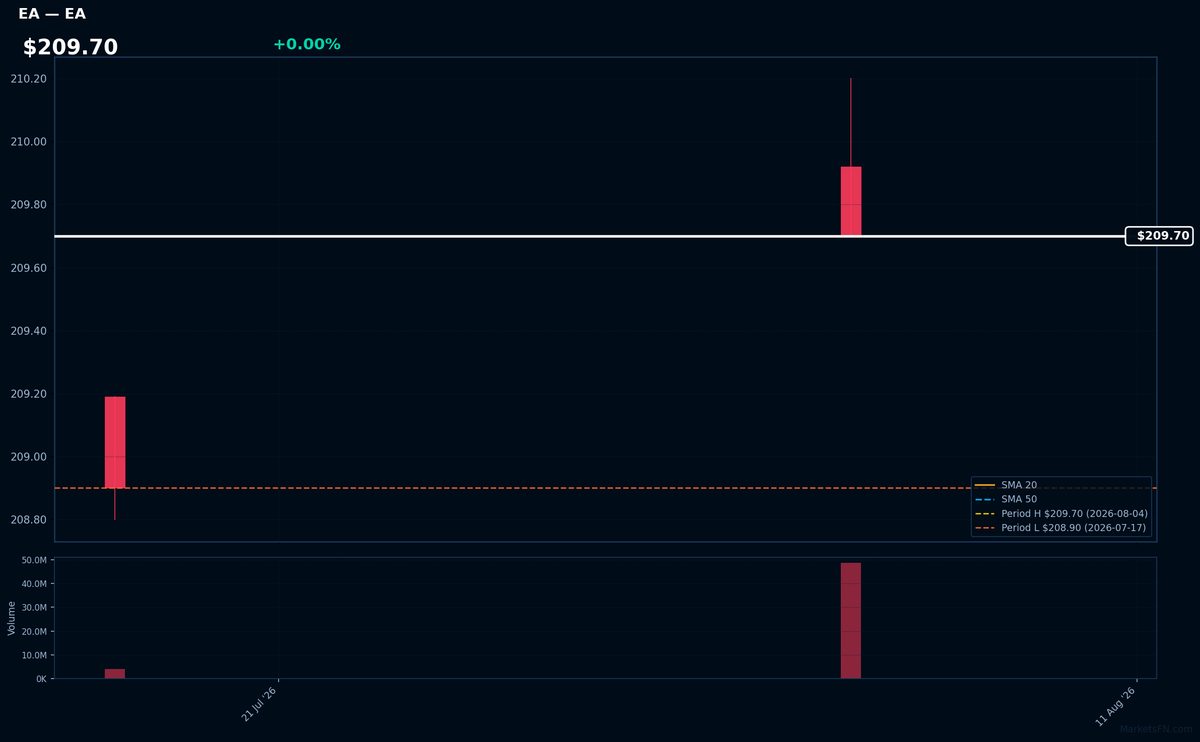
EA | Electronic Arts, Inc | Communication Services | Price Last: $209.70 | % Realized: +0.38% | RSI: — | % above MA200: — | Trend: —
Electronic Arts, Inc (EA) is a video game company that develops and publishes games such as Madden NFL and FIFA. Investors should care because its performance reflects demand for gaming content and the company's ability to innovate and capture market share.
The stock is near its 2026 YTD high, up 0.4% YTD. With RSI(14) and MA data unavailable, we cannot assess momentum or trend alignment. The proximity to its YTD high may indicate a potential breakout.
📉 Nearest to 2026 Low
Sectors represented: Utilities (2), Communication Services (1), Consumer Defensive (1), Industrials (1)
| Ticker | Company | Sector | Price Last | % Realized | 2026 YTD Low Date | RSI | % above MA200 | Trend |
|---|---|---|---|---|---|---|---|---|
| EA | Electronic Arts, Inc | Communication Services | $209.70 | +0.38% | 2026-07-17 | — | — | — |
| MNST | Monster Beverage Corp | Consumer Defensive | $45.92 | -39.71% | 2026-08-17 | 41.5 | -41.3% | Below MA20, MA50, MA200 |
| EXC | Exelon Corp | Utilities | $43.72 | -0.46% | 2026-01-12 | 36.6 | -4.9% | Below MA20, MA50, MA200 |
| XEL | Xcel Energy, Inc | Utilities | $75.69 | +1.35% | 2026-01-07 | 36.7 | -3.8% | Below MA20, MA50, MA200 |
| HON | Honeywell International Inc | Industrials | $213.53 | +3.94% | 2026-01-02 | 32.8 | -7.1% | Below MA20, MA50, MA200 |
EA | Electronic Arts, Inc | Communication Services | Price Last: $209.70 | % Realized: +0.38% | RSI: — | % above MA200: — | Trend: —
Electronic Arts, Inc (EA) is a video game company that develops and publishes games such as Madden NFL and FIFA. Investors should care because its performance reflects demand for gaming content and the company's ability to innovate and capture market share.
The stock is near its 2026 YTD high, up 0.4% YTD. With RSI(14) and MA data unavailable, we cannot assess momentum or trend alignment. The proximity to its YTD high may indicate a potential breakout.
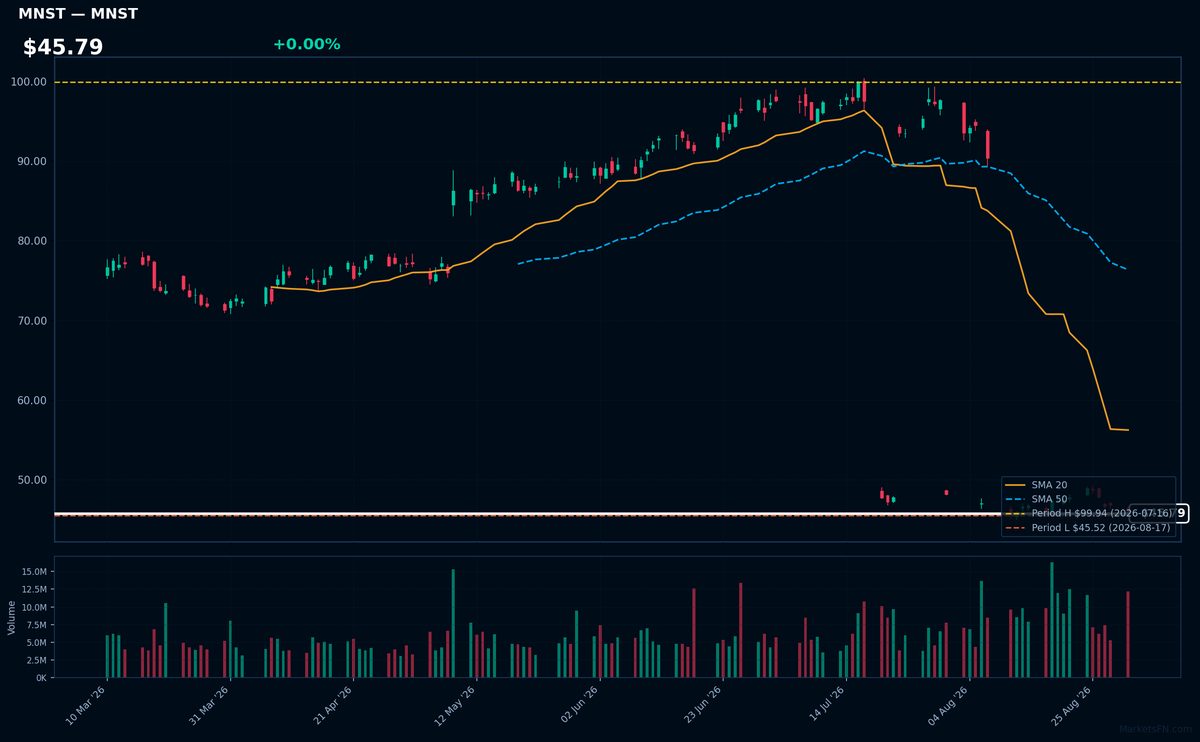
MNST | Monster Beverage Corp | Consumer Defensive | Price Last: $45.92 | % Realized: -39.71% | RSI: 41.5 | % above MA200: -41.3% | Trend: Below MA20, MA50, MA200
Monster Beverage Corp is a leading energy drink manufacturer with popular brands like Monster Energy. Investors should care about its performance as it dominates the energy drink market, and its stock movements can indicate consumer trends and competitive positioning in the beverage industry.
The stock is in a sustained downtrend with price ($45.79) below MA20, MA50, and MA200. RSI(14) is 41.5, nearing oversold territory. Testing major support 0.9% above its 2026 YTD low, with a -39.7% return over the 2026 YTD period, indicating potential further downside.
Related headlines
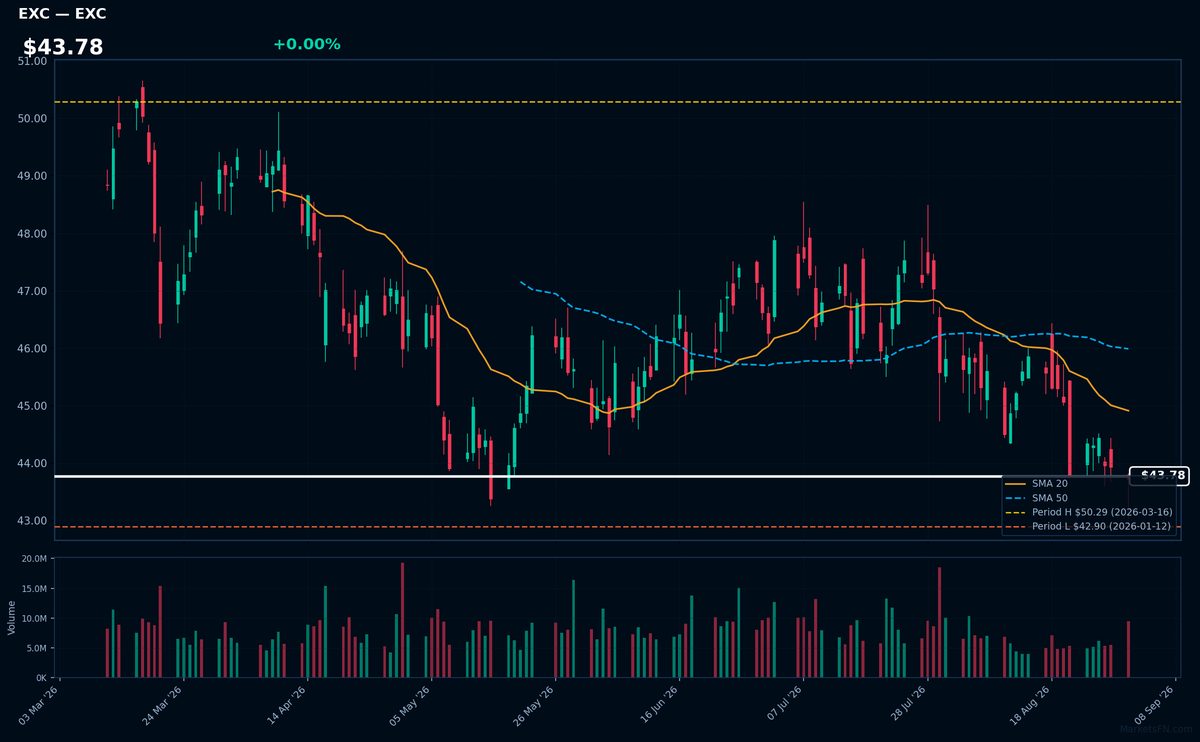
EXC | Exelon Corp | Utilities | Price Last: $43.72 | % Realized: -0.46% | RSI: 36.6 | % above MA200: -4.9% | Trend: Below MA20, MA50, MA200
Exelon Corp is a utility company that generates and distributes electricity, operating nuclear, natural gas, and renewable energy facilities. Investors should care about its stable cash flows and regulatory environment, which impact its dividend sustainability and long-term growth prospects.
Exelon Corp's current technical situation is bearish, with a sustained downtrend indicated by price < MA20 < MA50 < MA200. The RSI(14) is 36.6, nearing oversold territory, and the stock is 1.9% above its 2026 YTD low, testing major support.
Related headlines
- Exelon Announces Key Leadership Position Changes
- Exelon Secures More Than $1 Billion in Customer Protections Through Pioneering Transmission Security Agreements
- Exelon high probability data center load falls 40%
- Exelon Corp (EXC) (Q2 2026) Earnings Call Highlights: Navigating Regulatory Hurdles and Data ...
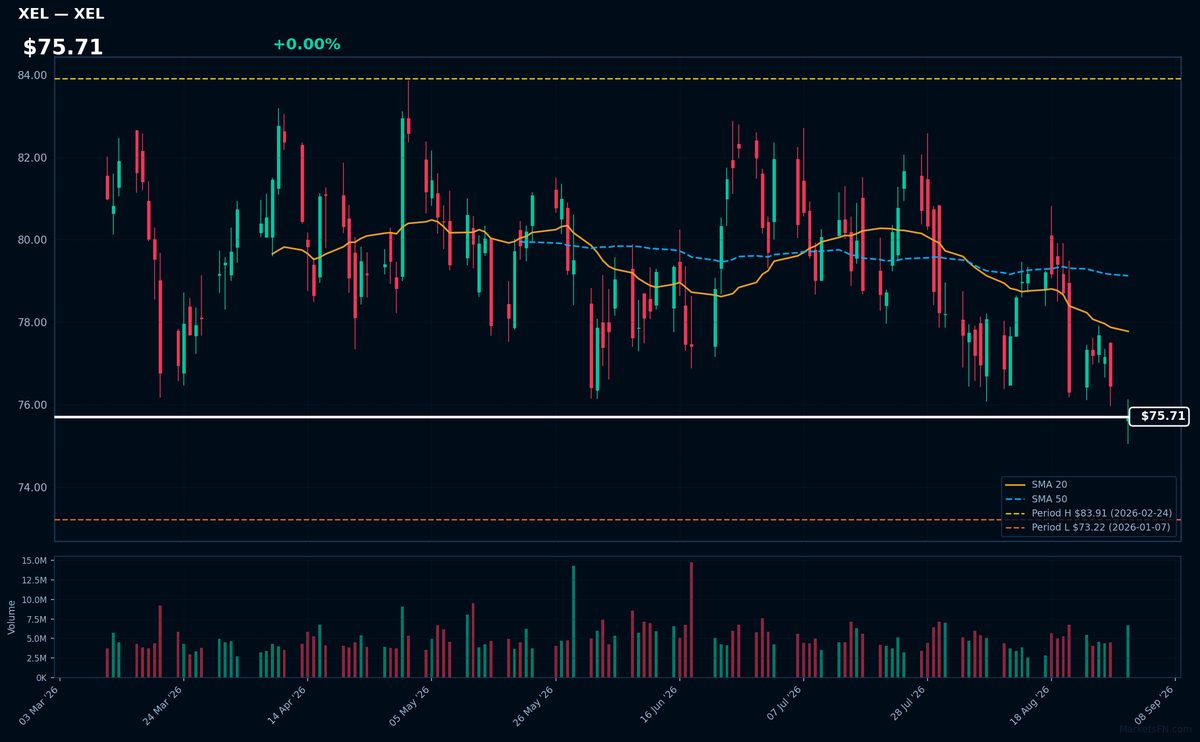
XEL | Xcel Energy, Inc | Utilities | Price Last: $75.69 | % Realized: +1.35% | RSI: 36.7 | % above MA200: -3.8% | Trend: Below MA20, MA50, MA200
Xcel Energy, Inc is a utility company that generates and distributes electricity and natural gas. Investors should care because its stable cash flows and dividend yield can provide a defensive component to a portfolio, with its regulated business model offering a relatively predictable earnings stream.
XEL's technicals indicate a potential support test, with an RSI(14) of 36.7 and the stock below its MA20, MA50, and MA200. Currently, it's 3.4% above its 2026 YTD low, suggesting a warning sign as it nears major support.
Related headlines
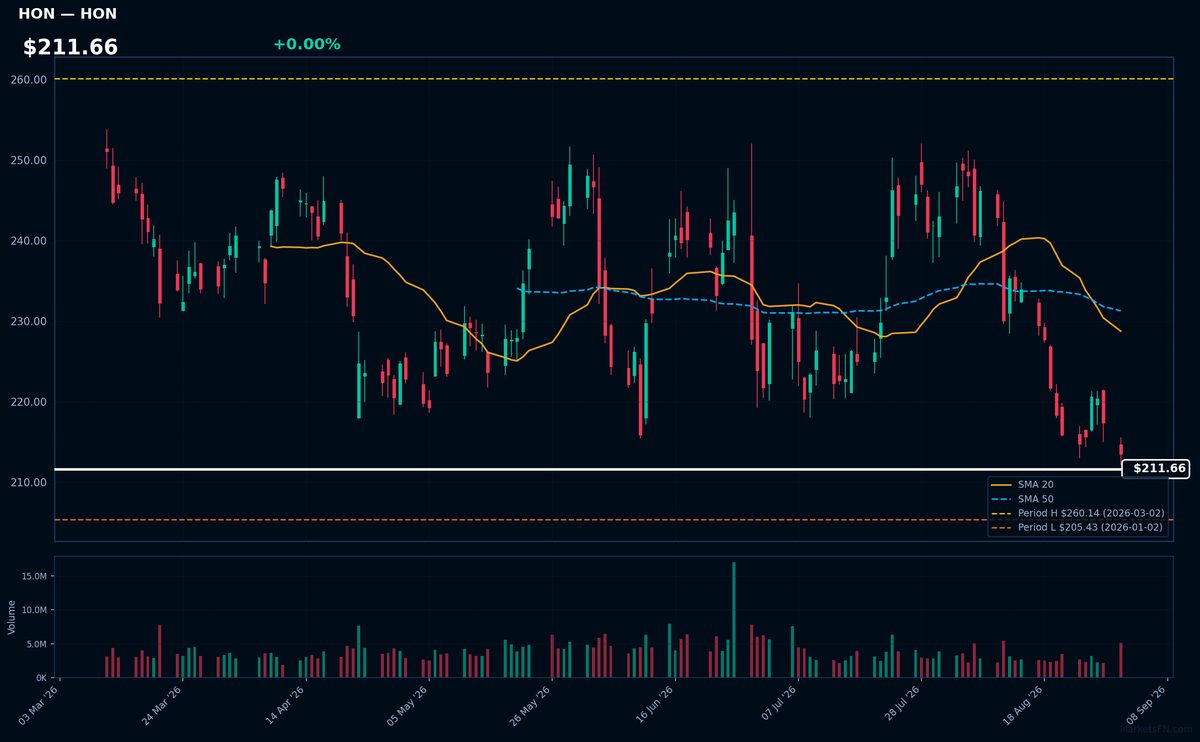
HON | Honeywell International Inc | Industrials | Price Last: $213.53 | % Realized: +3.94% | RSI: 32.8 | % above MA200: -7.1% | Trend: Below MA20, MA50, MA200
Honeywell International Inc is a diversified technology conglomerate that operates in various sectors including aerospace, building technologies, and performance materials. Investors should care due to its diversified revenue streams and exposure to various industrial and commercial markets.
Honeywell's current technical situation shows a potential warning sign with an RSI(14) of 32.8, indicating oversold conditions, and the stock price is below MA20, MA50, and MA200, showing mixed signals, and is only 3.9% above its 2026 YTD low.
Related headlines
- Honeywell Aerospace announces participation at upcoming investor conferences
- Honeywell Aerospace Stock Has Fallen Far Enough. Morgan Stanley Says It's Time to Buy.
- Honeywell Technologies Announces Leadership Updates for Process Technology and Building Automation
- Honeywell Aerospace targets supplier bottlenecks to boost output
Market Commentary
The Nasdaq 100 stocks listed are near their 2026 year-to-date (YTD) extremes, with some at their highs and others at their lows. Specifically, PLTR, CRWD, PAYX, TEAM, and EA are at their 2026 YTD highs, while EA, MNST, EXC, XEL, and HON are near their 2026 YTD lows. This indicates that these stocks have either reached new YTD highs or are trading close to their lowest points this year.
The technology sector themes driving these moves include the performance of specific companies like Palantir Technologies and Crowdstrike Holdings, which are at their YTD highs. Macro conditions may also be influencing the energy and industrials sectors, as seen in the performance of EXC, XEL, and HON. The presence of EA at both the high and low extremes suggests varying performance within the tech sector.
Investors and traders should watch the percentage changes from the YTD extremes for these stocks, as small changes could indicate a shift in trend. For instance, EA is only 0.4% above its YTD low, while HON is 3.9% above its low. Monitoring these movements can provide insights into sector and company-specific performance.
Methodology: All 101 Nasdaq 100 constituents screened. Close prices downloaded from 2026-01-01. Period high = highest close since Jan 1 2026; period low = lowest close since Jan 1 2026. Distance = (current price / period extreme − 1) × 100. Technical indicators computed on up to 1 year of daily OHLCV data.
Disclaimer: For informational purposes only. Not investment advice. Past performance is not indicative of future results.