MarketsFN
S&P 5005,963+0.54%
NASDAQ21,443+0.87%
DOW43,892+0.31%
DAX23,888+0.44%
FTSE 1008,721-0.12%
EUR/USD1.1465+0.07%
GBP/USD1.3220+0.14%
USD/JPY161.31-0.03%
Gold3,241+0.22%
WTI Oil76.40+0.81%
Bitcoin103,241+1.43%
10Y UST4.47%-9bp
S&P 5005,963+0.54%
NASDAQ21,443+0.87%
DOW43,892+0.31%
DAX23,888+0.44%
FTSE 1008,721-0.12%
EUR/USD1.1465+0.07%
GBP/USD1.3220+0.14%
USD/JPY161.31-0.03%
Gold3,241+0.22%
WTI Oil76.40+0.81%
Bitcoin103,241+1.43%
10Y UST4.47%-9bp
Economics

Mortgage Rates Hit 7.03%, Highest in a Year, Squeezing Homebuyers

MarketsFN Data Team
•4 min read
Mortgage Rates Hit 7.03%, Highest in a Year, Squeezing Homebuyers
Housing · Mortgage Rates · Weekly Tracker
7.03%
30-Year Fixed Mortgage Rate
▲ 8.0 bps week-on-week  ·  $2,669/mo on a $400,000 loan

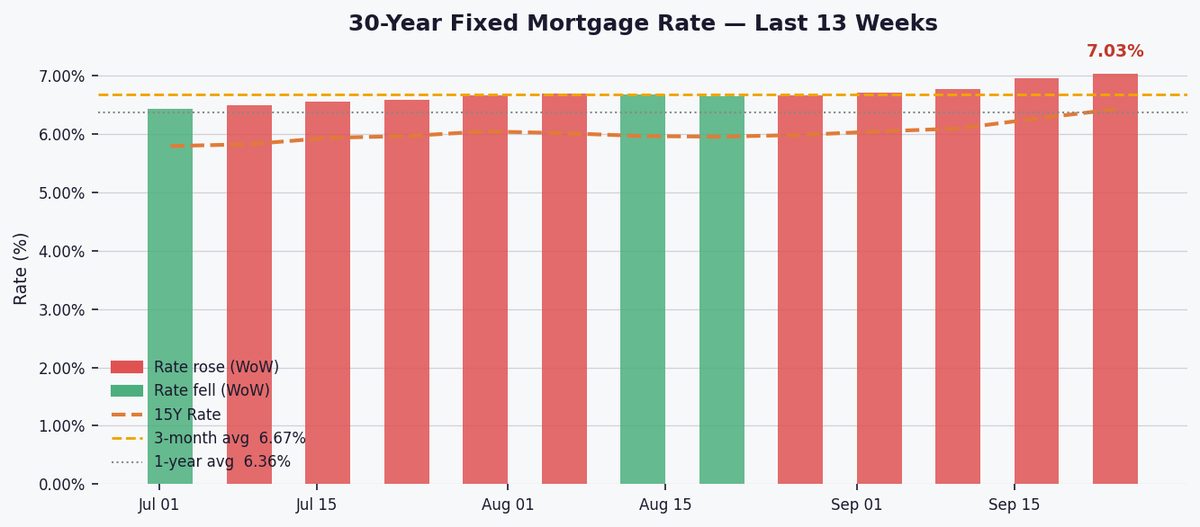
The 30-year fixed mortgage rate rose to 7.03% this week, up 8 basis points from last week, pushing the monthly payment on a $400,000 loan to $2,669—$178 more than a year ago.

The 30-year rate now sits well above its 3-month (6.67%), 1-year (6.36%), and 5-year (6.20%) averages, and matches its 52-week high of 7.03%. A $400,000 mortgage today costs $2,669 monthly, compared to $2,491 a year ago at a 5.98% rate, highlighting the affordability crunch for buyers.

Rates are climbing as the 10-year Treasury yield hits 5.26%, with the mortgage-Treasury spread at 1.77 percentage points—elevated but stable. The Fed’s 3.63% funds rate and inflation fears keep upward pressure on borrowing costs, while lenders maintain cautious pricing amid economic uncertainty.

36-month trend chart
Fig. 2 — 30Y mortgage (red), 15Y mortgage (orange), Fed Funds Rate (dark blue), 10Y Treasury (light blue) over 36 months. Bottom panel: mortgage–Treasury spread — a wide spread signals elevated lender risk premium.

Next week, watch for Fed commentary on rate cuts and September jobs data, which could sway bond markets. Seasonal cooling in homebuying demand may ease rate pressure, but stubborn inflation could prolong the high-rate environment.

Key Statistics at a Glance

Week endingOctober 01, 2026
30Y Fixed Rate7.03%
WoW change▲ 8.0 bps
YTD change+87.0 bps
15Y Fixed Rate6.42%
15Y WoW▲ 16.0 bps
3-month average6.67%
1-year average6.36%
5-year average6.20%
52-week high7.03%
52-week low5.98%
Fed Funds Rate3.63%
10Y Treasury5.26%
Mortgage–10Y Spread1.77 pp
Monthly pmt $400k/30Y$2,669
vs 1 year ago▲ $179/month
Data: Federal Reserve Bank of St. Louis (FRED) · Series: MORTGAGE30US, MORTGAGE15US, FEDFUNDS, DGS10 · 30Y & 15Y rates: Freddie Mac Primary Mortgage Market Survey, released every Thursday.
#Mortgage Rates#30-Year Fixed Rate#15-Year Fixed Rate#Housing Market#Freddie Mac#Real Estate#Federal Reserve#10-Year Treasury#FRED#Home Buying#Interest Rates

Related Articles

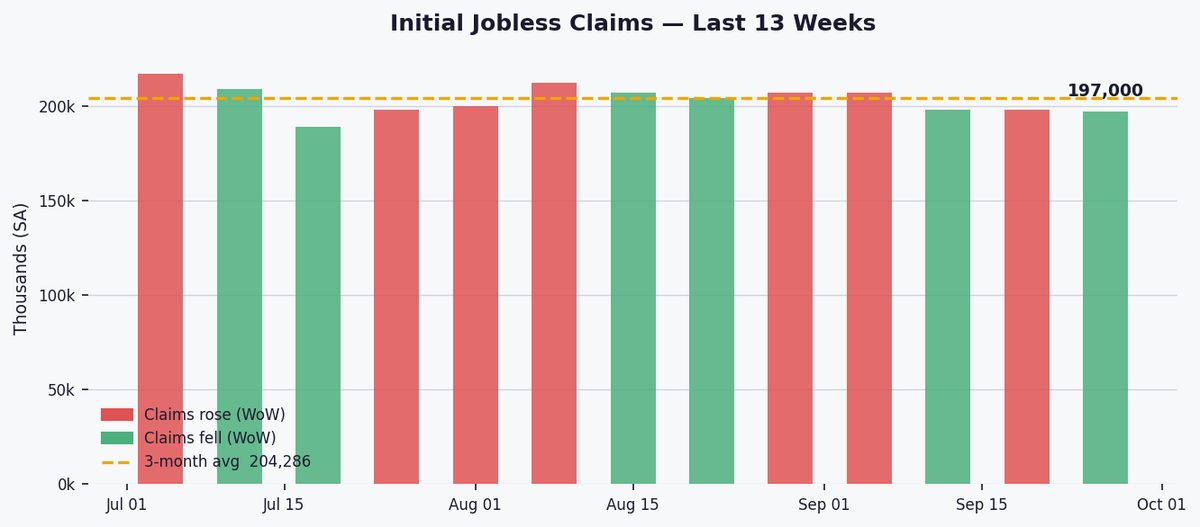
US jobless claims hold steady at 197,000, signaling labor market resilience
Economics

US jobless claims hold steady at 197,000, signaling labor market resilience

MarketsFN Data Team
4 minOct 1, 2026
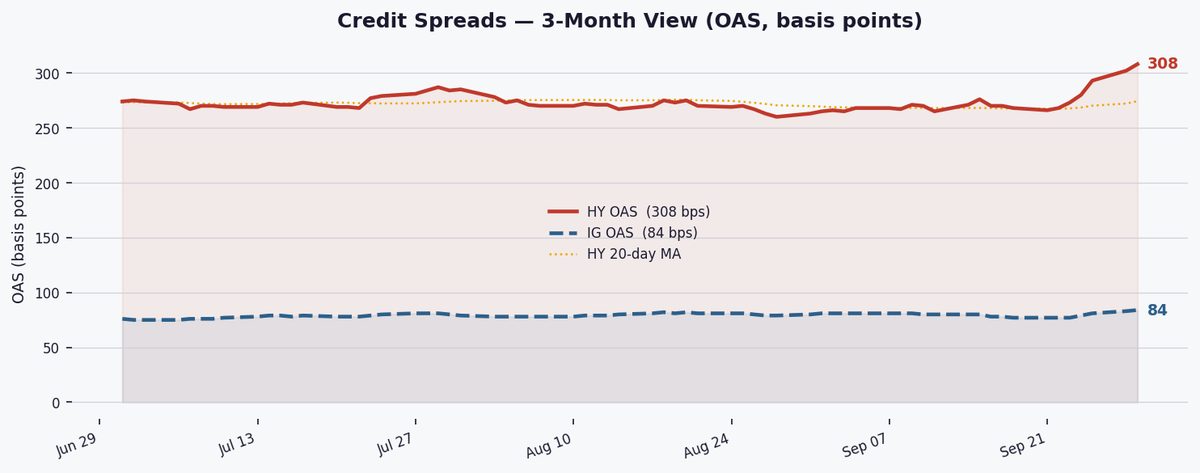
HY spreads widen to 308 bps as credit stress builds amid rising yields
Economics

HY spreads widen to 308 bps as credit stress builds amid rising yields

MarketsFN Data Team
5 minOct 1, 2026
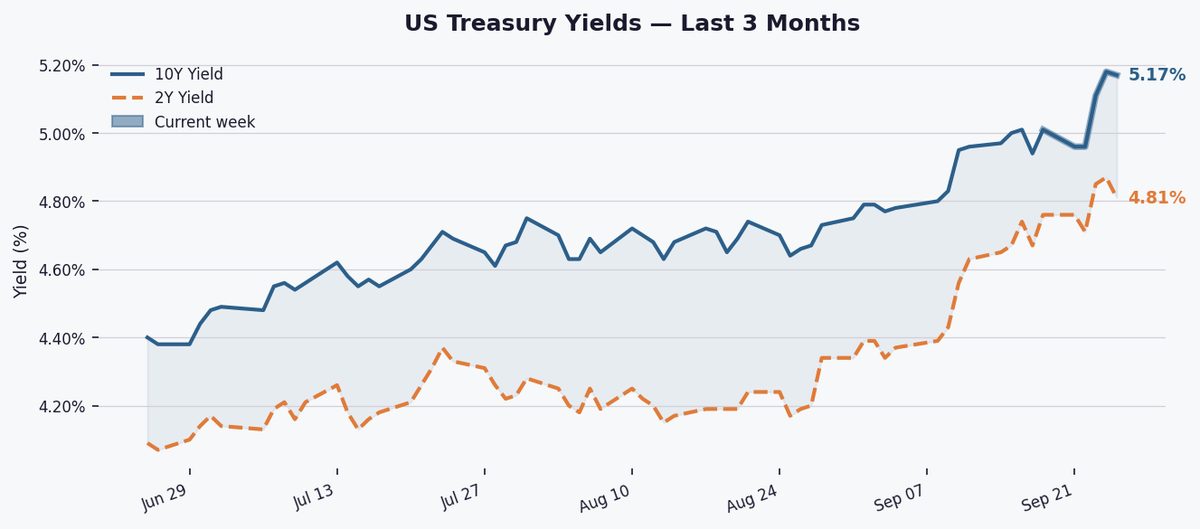
10-Year Yield Nears 52-Week High as Curve Steepens Further
Economics

10-Year Yield Nears 52-Week High as Curve Steepens Further

MarketsFN Data Team
4 minSep 29, 2026