GBP/USD: Down 0.12% to 1.3527 — Descending Channel
MarketsFN Team
GBP/USD: Down 0.12% to 1.3527 — Descending Channel
Published: September 10, 2026 · MarketsFN Team · US Session
| Pair | Rate | Change | RSI(14) | SMA-20 | SMA-50 | 52W High | 52W Low | Pivot | R1 | S1 |
|---|---|---|---|---|---|---|---|---|---|---|
| GBP/USD | 1.3527 | -0.12% | 34.5 | 1.3561 | 1.3474 | 1.3846 | 1.3019 | 1.3547 | 1.3565 | 1.3527 |
📊 Support & Resistance Levels
Dynamic Trendlines
| Level | Type | Direction | Distance |
|---|---|---|---|
| 1.3471 | 20d Support | → flat | -0.42% / 56.2 pips |
| 1.3559 | 20d Resistance | ↘ descending | +0.23% / 31.8 pips |
| 1.3438 | 50d Support | ↗ ascending | -0.66% / 89.5 pips |
| 1.3736 | 50d Resistance | ↗ ascending | +1.54% / 208.2 pips |
Static Levels
| Level | Type | Touches | Distance |
|---|---|---|---|
| 1.3588 | Resistance | 2× | +0.29% / 39.7 pips |
| 1.3474 | Support | 2× | -0.55% / 75.1 pips |
| 1.3322 | Support | 2× | -1.67% / 226.5 pips |
| 1.3303 | Support | 2× | -1.81% / 245.5 pips |
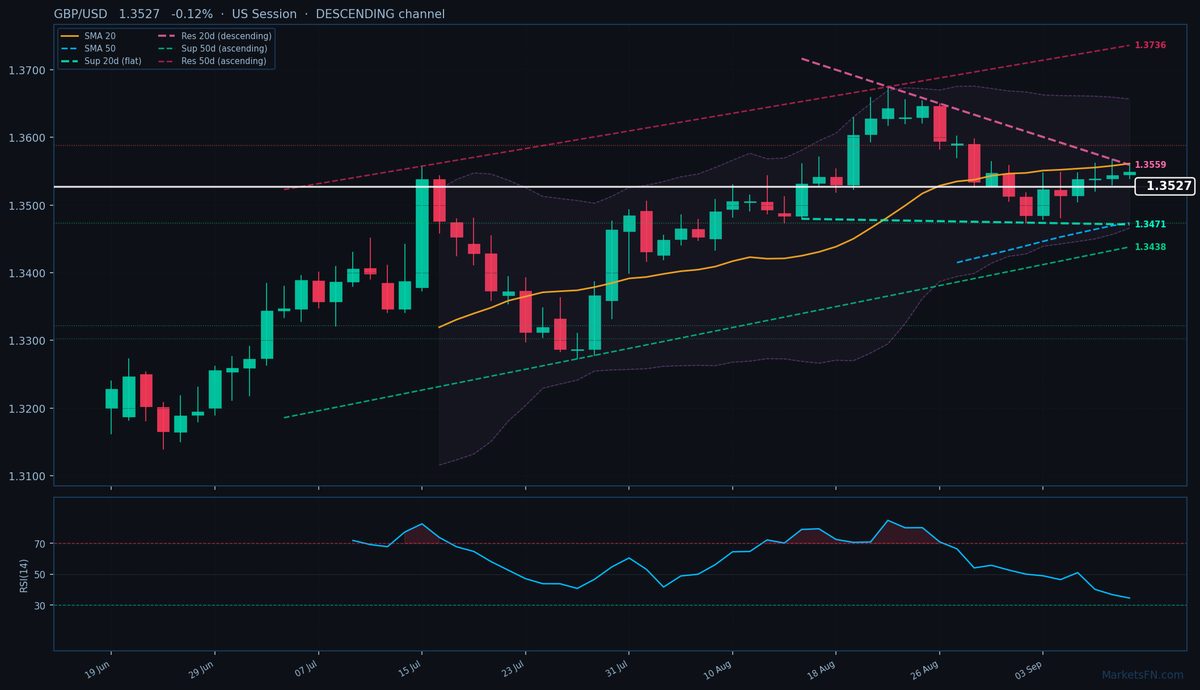
GBP/USD is trading at 1.3527 (-0.12%), trapped in a consolidation phase between its 20-day SMA (1.3561, 34.2 pips above) and 50-day SMA (1.3474, 52.7 pips below). The rate is testing the lower bound of a descending 20-day channel, with dynamic resistance at 1.3559 (31.8 pips above, descending slope) and dynamic support at 1.3471 (56.2 pips below, flat). The broader 50-day channel remains ascending, with resistance far above at 1.3736 (208.2 pips away) and support at 1.3438 (89.5 pips below).
Static levels show immediate resistance at R1 (1.3565, 38.2 pips above) and support at S1 (1.3527, coinciding with current price). A break below S1 targets 1.3474 (75.1 pips lower), a key static support level with two prior touches. The RSI at 34.5 is neutral but drifting toward oversold territory, suggesting limited downside momentum unless dollar strength accelerates.
The short-term outlook hinges on whether GBP/USD holds the 20-day dynamic support at 1.3471. A failure here would confirm the descending 20-day channel’s dominance and open a test of the 50-day SMA (1.3474). Conversely, a rebound above the 20-day SMA (1.3561) could challenge the descending resistance at 1.3559. Watch today’s US session for volatility—a close below 1.3527 (S1) would signal bearish continuation, while reclaiming 1.3547 (pivot) could stabilize the pair. The 50-day ascending channel’s support at 1.3438 remains the structural floor for any deeper pullback.
Disclaimer
The content on MarketsFN.com is provided for educational and informational purposes only and does not constitute financial advice. All investments involve risk and past performance does not guarantee future results.