FX Midday Briefing — Tue 15 Sep 2026: USD/JPY Gains 0.42% as US Session Kicks Off
MarketsFN FX Desk

Mid-session update on Tuesday 15 September 2026: with the US session underway, G10 and emerging FX markets are showing 15 pairs bid and 4 offered against the Dollar. The session's leading movers are USD/JPY (+0.42%), USD/SEK (+0.34%), USD/ZAR (+0.31%). Cross-asset flows from US equity and bond markets are increasingly influencing FX positioning as European traders hand off to their New York counterparts.
This midday snapshot includes updated intraday pivot levels, the full day's economic calendar with actual releases for morning data, and fresh candlestick charts for all 19 pairs. Afternoon risk events — if any remain on the calendar — are flagged in the calendar section below.
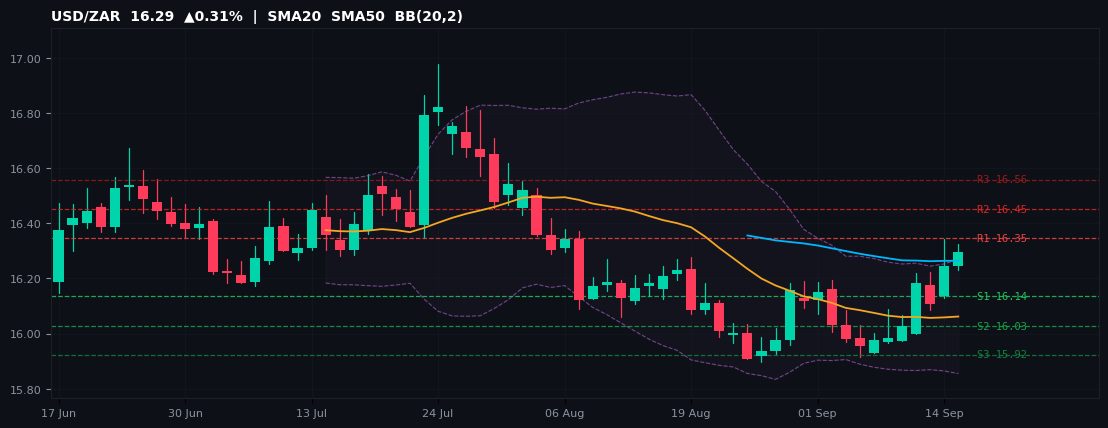
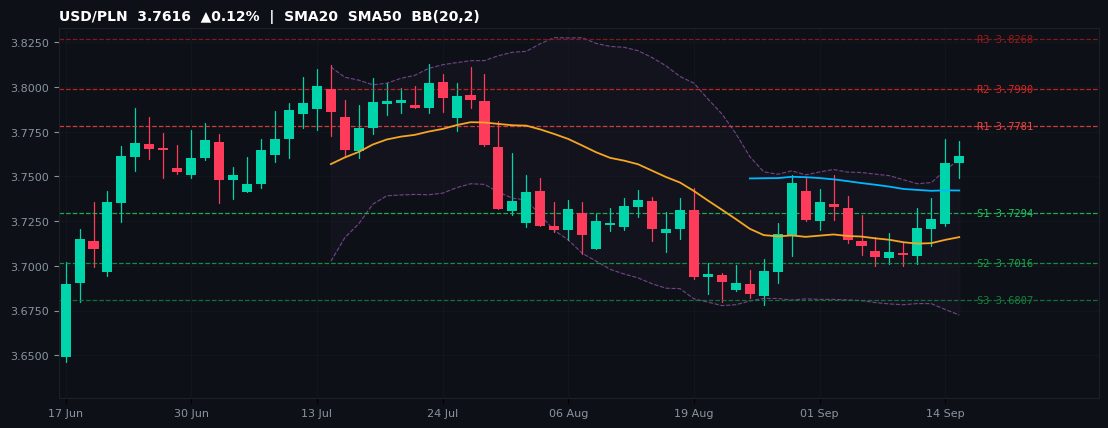
All pivot levels (R1 R2 R3 / S1 S2 S3) are computed from yesterday's full-session OHLC via the standard floor-pivot formula. Charts cover 65 daily bars with SMA20, SMA50 and Bollinger Bands (20,2).
Today's Economic Calendar
| Time (UTC) | Event | CCY | Previous | Forecast | Actual |
|---|---|---|---|---|---|
| 02:00 | ● Fixed Asset Investment (YoY) (Aug) | CNY | -6.7% | -7.1% | -7.2% |
| 02:00 | ● Industrial Production (YoY) (Aug) | CNY | 4.5% | 4.8% | 5.2% |
| 02:00 | ● Chinese Industrial Production YTD (YoY) (Aug) | CNY | 5.3% | — | 5.3% |
| 02:00 | ● Chinese Unemployment Rate (Aug) | CNY | 5.2% | 5.2% | 5.3% |
| 02:00 | ● NBS Press Conference | CNY | — | — | — |
| 06:00 | ● Average Earnings Index +Bonus (Jul) | GBP | 4.2% | 3.9% | 3.9% |
| 06:00 | ● Claimant Count Change (Aug) | GBP | -11.8K | 8.3K | 27.8K |
| 06:00 | ● Employment Change 3M/3M (MoM) (Jul) | GBP | 83K | — | 67K |
| 06:00 | ● Unemployment Rate (Jul) | GBP | 4.9% | 5.0% | 4.9% |
| 06:45 | ● French CPI (MoM) (Aug) | EUR | 0.6% | 0.7% | 0.7% |
| 06:45 | ● French HICP (MoM) (Aug) | EUR | 0.6% | 0.8% | 0.7% |
| 07:00 | ● Spanish CPI (YoY) (Aug) | EUR | 3.6% | 4.3% | 4.3% |
| 07:00 | ● Spanish HICP (YoY) (Aug) | EUR | 3.9% | 4.5% | 4.6% |
| 08:15 | ● German Buba Vice President Buch Speaks | EUR | — | — | — |
| 09:00 | ● German ZEW Current Conditions (Sep) | EUR | -61.1 | -53.0 | -47.1 |
| 09:00 | ● German ZEW Economic Sentiment (Sep) | EUR | 34.2 | 39.8 | 34.7 |
| 09:00 | ● Trade Balance (Jul) | EUR | 7.2B | 3.7B | 14.2B |
| 09:00 | ● ZEW Economic Sentiment (Sep) | EUR | 31.4 | 39.2 | 25.8 |
| 12:00 | ● Retail Sales (YoY) (Jul) | BRL | 2.8% | 2.2% | 1.2% |
| 12:00 | ● Retail Sales (MoM) (Jul) | BRL | 0.3% | -0.2% | -0.8% |
| 12:15 | ● ADP Employment Change Weekly | USD | 12.00K | — | 16.30K |
| 12:30 | ● NY Empire State Manufacturing Index (Sep) | USD | 20.60 | 14.80 | 7.60 |
| 12:30 | ● Wholesale Sales (MoM) (Jul) | CAD | 2.8% | -0.5% | 0.3% |
| 17:00 | ● 20-Year Bond Auction | USD | 5.204% | — | — |
| 17:00 | ● ECB's Schnabel Speaks | EUR | — | — | — |
| 20:30 | ● API Weekly Crude Oil Stock | USD | -0.300M | — | — |
| 21:00 | ● Westpac Consumer Sentiment | NZD | 80.4 | — | — |
| 22:45 | ● Current Account (QoQ) (Q2) | NZD | -1.01B | -2.57B | — |
| 22:45 | ● Current Account (YoY) (Q2) | NZD | -16.30B | — | — |
| 23:50 | ● Adjusted Trade Balance | JPY | -0.69T | -1.00T | — |
| 23:50 | ● Exports (YoY) (Aug) | JPY | 23.2% | 18.2% | — |
| 23:50 | ● Trade Balance (Aug) | JPY | -634.5B | -1,052.6B | — |
Major Pairs
EUR/USD
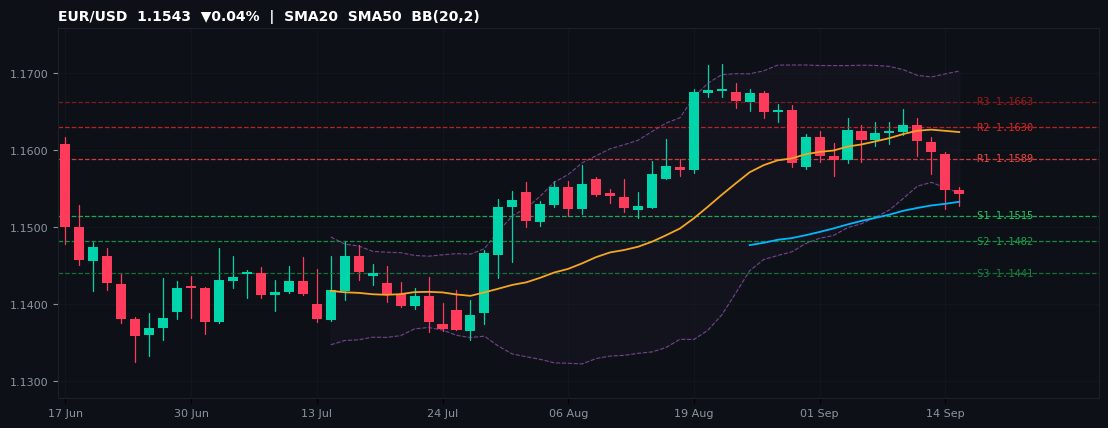
1.1543 ▼0.04% Day H 1.1552 / L 1.1527 52W 1.1324–1.2082
| R3 | R2 | R1 | S1 | S2 | S3 |
|---|---|---|---|---|---|
| 1.1663 | 1.1630 | 1.1589 | 1.1515 | 1.1482 | 1.1441 |
With the US session now active, EUR/USD trades at 1.1543 (-0.04% vs. yesterday's close), at the 29th percentile of its 1.1324–1.2082 52-week range. Today's intraday range of 1.1527–1.1552 (0.0025 pips) is above the average daily range. The intraday bias is neutral-to-bearish while price holds below the daily pivot at 1.1556.
Price is closest to S1 at 1.1515 — a decisive break below S1 (1.1515) exposes S2 (1.1482). The R1–S1 corridor (1.1589–1.1515) defines the equilibrium zone for the afternoon session; a sustained directional break will likely set the tone into tomorrow's Asian open.
For EUR/USD, price is in the lower half of its annual range, keeping the path of least resistance lower. The 52-week range of 1.1324–1.2082 places the pair at the 29th percentile annually. Key risk: any USD-moving headline into the NY close could extend the intraday range well beyond current pivot boundaries.
EUR/USDRangebound
GBP/USD
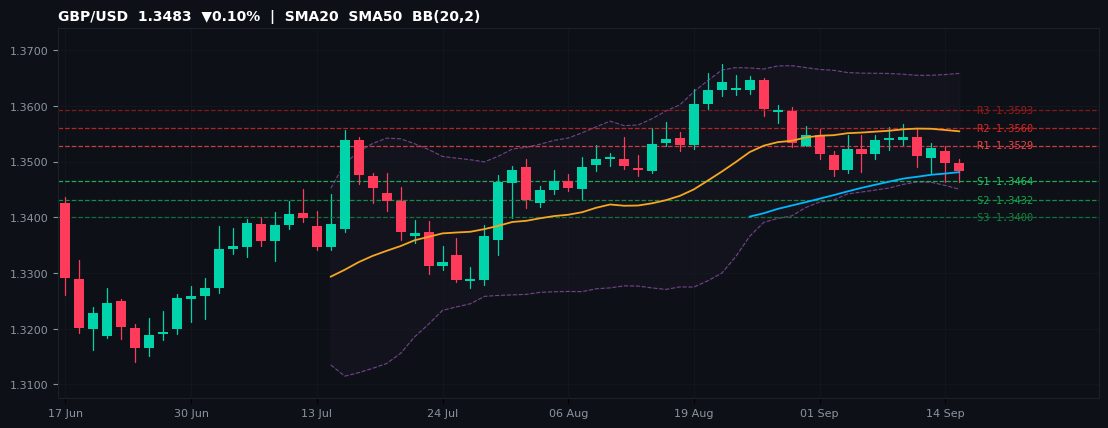
1.3483 ▼0.10% Day H 1.3504 / L 1.3463 52W 1.3009–1.3868
| R3 | R2 | R1 | S1 | S2 | S3 |
|---|---|---|---|---|---|
| 1.3593 | 1.3560 | 1.3529 | 1.3464 | 1.3432 | 1.3400 |
With the US session now active, GBP/USD trades at 1.3483 (-0.10% vs. yesterday's close), at the 55th percentile of its 1.3009–1.3868 52-week range. Today's intraday range of 1.3463–1.3504 (0.0041 pips) is above the average daily range. The intraday bias is neutral-to-bearish while price holds below the daily pivot at 1.3496.
Price is closest to S1 at 1.3464 — a decisive break below S1 (1.3464) exposes S2 (1.3432). The R1–S1 corridor (1.3529–1.3464) defines the equilibrium zone for the afternoon session; a sustained directional break will likely set the tone into tomorrow's Asian open.
For GBP/USD, intraday momentum is constructive; the upper half of the annual range favours dip-buyers. The 52-week range of 1.3009–1.3868 places the pair at the 55th percentile annually. Key risk: any USD-moving headline into the NY close could extend the intraday range well beyond current pivot boundaries.
GBP/USDRangebound
USD/JPY
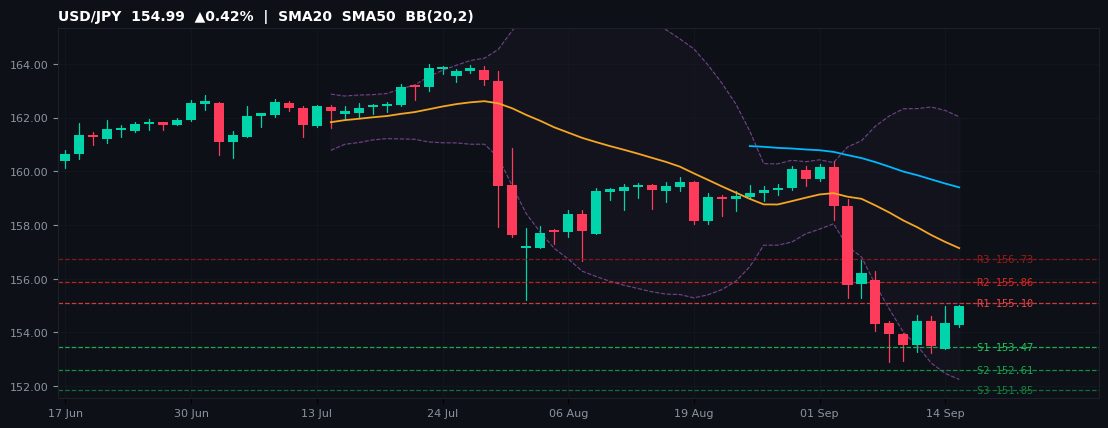
154.99 ▲0.42% Day H 155.03 / L 154.20 52W 146.58–163.98
| R3 | R2 | R1 | S1 | S2 | S3 |
|---|---|---|---|---|---|
| 156.73 | 155.86 | 155.10 | 153.47 | 152.61 | 151.85 |
With the US session now active, USD/JPY trades at 154.99 (+0.42% vs. yesterday's close), at the 48th percentile of its 146.58–163.98 52-week range. Today's intraday range of 154.20–155.03 (0.82 pips) is above the average daily range. The intraday bias tilts bullish with price above the daily pivot at 154.23.
Price is closest to R1 at 155.10 — a decisive break above R1 (155.10) opens R2 (155.86). The R1–S1 corridor (155.10–153.47) defines the equilibrium zone for the afternoon session; a sustained directional break will likely set the tone into tomorrow's Asian open.
For USD/JPY, price is in the lower half of its annual range, keeping the path of least resistance lower. The 52-week range of 146.58–163.98 places the pair at the 48th percentile annually. Key risk: any USD-moving headline into the NY close could extend the intraday range well beyond current pivot boundaries.
USD/JPYBullish
USD/CHF
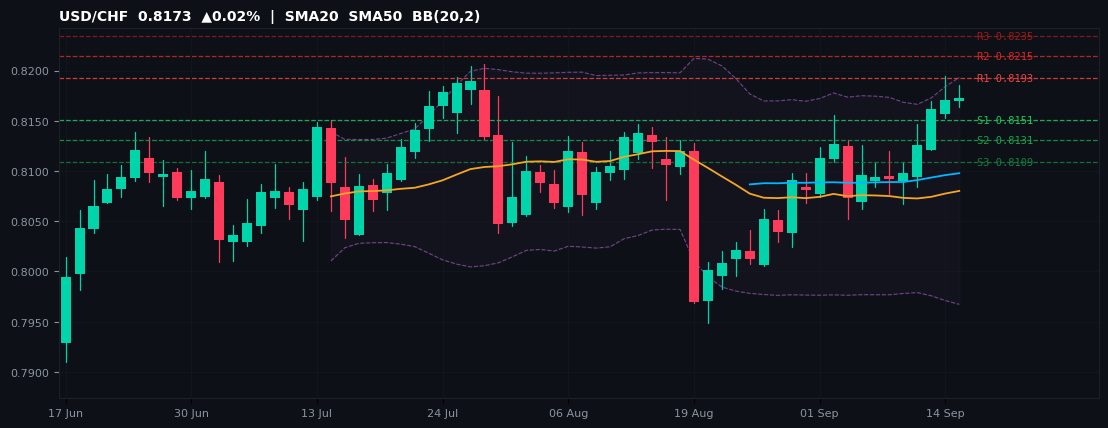
0.8173 ▲0.02% Day H 0.8185 / L 0.8164 52W 0.7602–0.8206
| R3 | R2 | R1 | S1 | S2 | S3 |
|---|---|---|---|---|---|
| 0.8235 | 0.8215 | 0.8193 | 0.8151 | 0.8131 | 0.8109 |
With the US session now active, USD/CHF trades at 0.8173 (+0.02% vs. yesterday's close), just 0.41% below its 52-week high of 0.8206. Today's intraday range of 0.8164–0.8185 (0.0022 pips) is above the average daily range. The intraday bias is neutral-to-bearish while price holds below the daily pivot at 0.8173.
Price is closest to R1 at 0.8193 — a decisive break above R1 (0.8193) opens R2 (0.8215). The R1–S1 corridor (0.8193–0.8151) defines the equilibrium zone for the afternoon session; a sustained directional break will likely set the tone into tomorrow's Asian open.
For USD/CHF, upside momentum is intact; the 52W high is the key target on a sustained break above R2. The 52-week range of 0.7602–0.8206 places the pair at the 94th percentile annually. Key risk: any USD-moving headline into the NY close could extend the intraday range well beyond current pivot boundaries.
USD/CHFRangeboundNear 52W High
AUD/USD
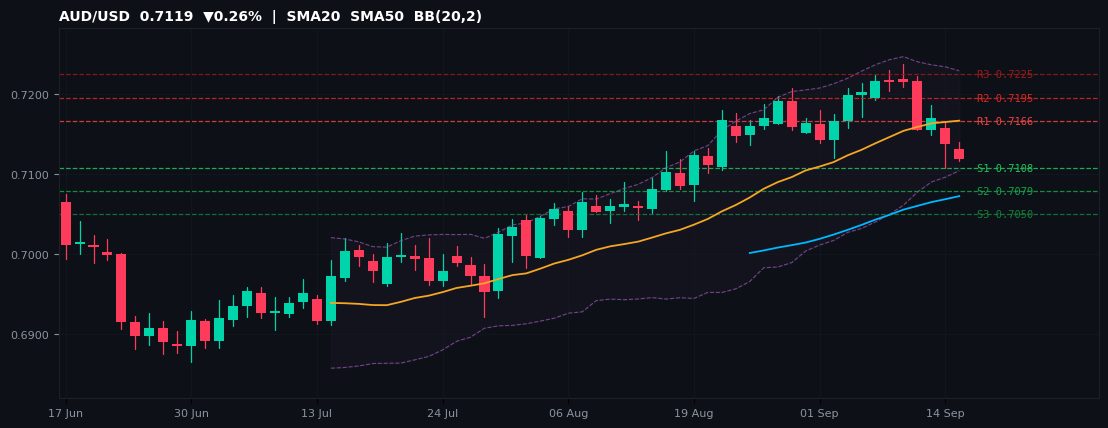
0.7119 ▼0.26% Day H 0.7141 / L 0.7117 52W 0.6421–0.7277
| R3 | R2 | R1 | S1 | S2 | S3 |
|---|---|---|---|---|---|
| 0.7225 | 0.7195 | 0.7166 | 0.7108 | 0.7079 | 0.7050 |
With the US session now active, AUD/USD trades at 0.7119 (-0.26% vs. yesterday's close), at the 82th percentile of its 0.6421–0.7277 52-week range. Today's intraday range of 0.7117–0.7141 (0.0024 pips) is above the average daily range. The intraday bias is neutral-to-bearish while price holds below the daily pivot at 0.7137.
Price is closest to S1 at 0.7108 — a decisive break below S1 (0.7108) exposes S2 (0.7079). The R1–S1 corridor (0.7166–0.7108) defines the equilibrium zone for the afternoon session; a sustained directional break will likely set the tone into tomorrow's Asian open.
For AUD/USD, intraday momentum is constructive; the upper half of the annual range favours dip-buyers. The 52-week range of 0.6421–0.7277 places the pair at the 82th percentile annually. Key risk: any USD-moving headline into the NY close could extend the intraday range well beyond current pivot boundaries.
AUD/USDRangebound
NZD/USD
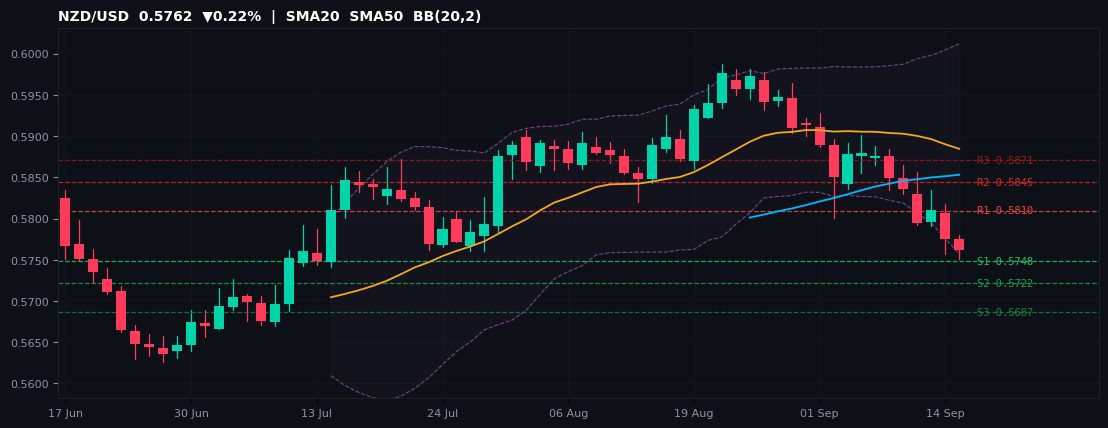
0.5762 ▼0.22% Day H 0.5780 / L 0.5751 52W 0.5576–0.6092
| R3 | R2 | R1 | S1 | S2 | S3 |
|---|---|---|---|---|---|
| 0.5871 | 0.5845 | 0.5810 | 0.5748 | 0.5722 | 0.5687 |
With the US session now active, NZD/USD trades at 0.5762 (-0.22% vs. yesterday's close), at the 36th percentile of its 0.5576–0.6092 52-week range. Today's intraday range of 0.5751–0.5780 (0.0029 pips) is above the average daily range. The intraday bias is neutral-to-bearish while price holds below the daily pivot at 0.5783.
Price is closest to S1 at 0.5748 — a decisive break below S1 (0.5748) exposes S2 (0.5722). The R1–S1 corridor (0.5810–0.5748) defines the equilibrium zone for the afternoon session; a sustained directional break will likely set the tone into tomorrow's Asian open.
For NZD/USD, price is in the lower half of its annual range, keeping the path of least resistance lower. The 52-week range of 0.5576–0.6092 places the pair at the 36th percentile annually. Key risk: any USD-moving headline into the NY close could extend the intraday range well beyond current pivot boundaries.
NZD/USDRangebound
USD/CAD
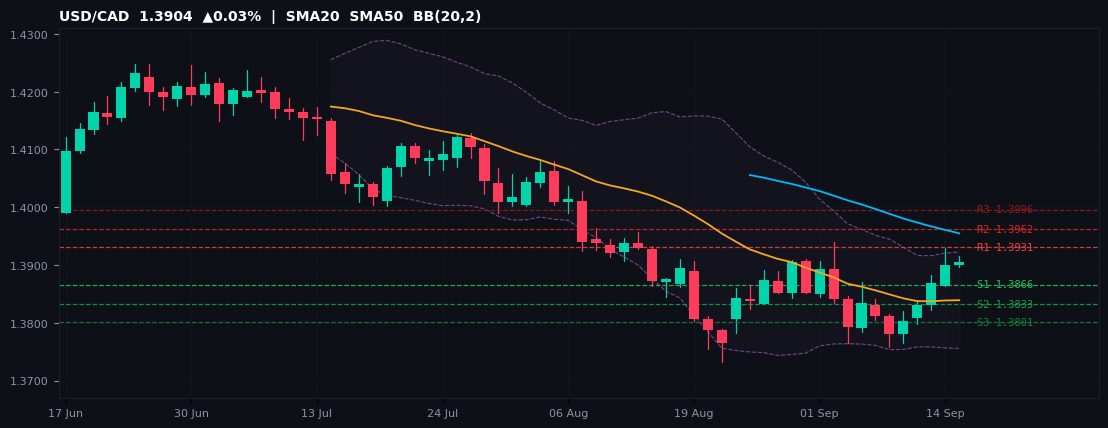
1.3904 ▲0.03% Day H 1.3915 / L 1.3896 52W 1.3480–1.4247
| R3 | R2 | R1 | S1 | S2 | S3 |
|---|---|---|---|---|---|
| 1.3996 | 1.3962 | 1.3931 | 1.3866 | 1.3833 | 1.3801 |
With the US session now active, USD/CAD trades at 1.3904 (+0.03% vs. yesterday's close), at the 55th percentile of its 1.3480–1.4247 52-week range. Today's intraday range of 1.3896–1.3915 (0.0019 pips) is above the average daily range. The intraday bias tilts bullish with price above the daily pivot at 1.3898.
Price is closest to R1 at 1.3931 — a decisive break above R1 (1.3931) opens R2 (1.3962). The R1–S1 corridor (1.3931–1.3866) defines the equilibrium zone for the afternoon session; a sustained directional break will likely set the tone into tomorrow's Asian open.
For USD/CAD, intraday momentum is constructive; the upper half of the annual range favours dip-buyers. The 52-week range of 1.3480–1.4247 places the pair at the 55th percentile annually. Key risk: any USD-moving headline into the NY close could extend the intraday range well beyond current pivot boundaries.
USD/CADRangebound
📚 Book Insights
If You Believe Markets Are Efficient, Do Not Read This
A practitioner's guide to structural market inefficiencies — how central bank policy divergence, carry dynamics, and cross-asset flows create durable FX trading edges that efficient-market theorists systematically underestimate.
Read the analysis →Cross Pairs
EUR/GBP
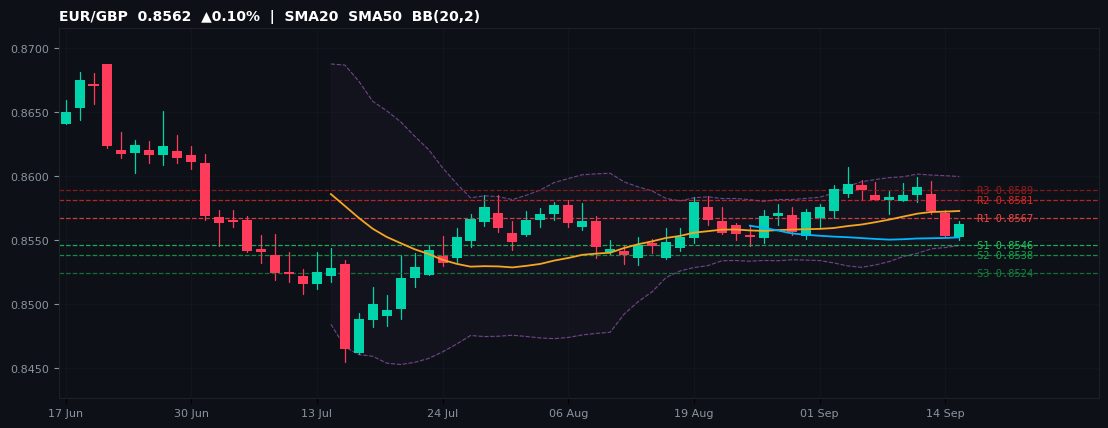
0.8562 ▲0.10% Day H 0.8564 / L 0.8550 52W 0.8454–0.8865
| R3 | R2 | R1 | S1 | S2 | S3 |
|---|---|---|---|---|---|
| 0.8589 | 0.8581 | 0.8567 | 0.8546 | 0.8538 | 0.8524 |
With the US session now active, EUR/GBP trades at 0.8562 (+0.10% vs. yesterday's close), just 1.28% above its 52-week floor at 0.8454. Today's intraday range of 0.8550–0.8564 (0.0015 pips) is above the average daily range. The intraday bias tilts bullish with price above the daily pivot at 0.8560.
Price is closest to R1 at 0.8567 — a decisive break above R1 (0.8567) opens R2 (0.8581). The R1–S1 corridor (0.8567–0.8546) defines the equilibrium zone for the afternoon session; a sustained directional break will likely set the tone into tomorrow's Asian open.
For EUR/GBP, the annual support remains the decisive level — bulls need a firm hold here to prevent a deeper pullback. The 52-week range of 0.8454–0.8865 places the pair at the 26th percentile annually. Key risk: any USD-moving headline into the NY close could extend the intraday range well beyond current pivot boundaries.
EUR/GBPRangeboundNear 52W Low
EUR/JPY
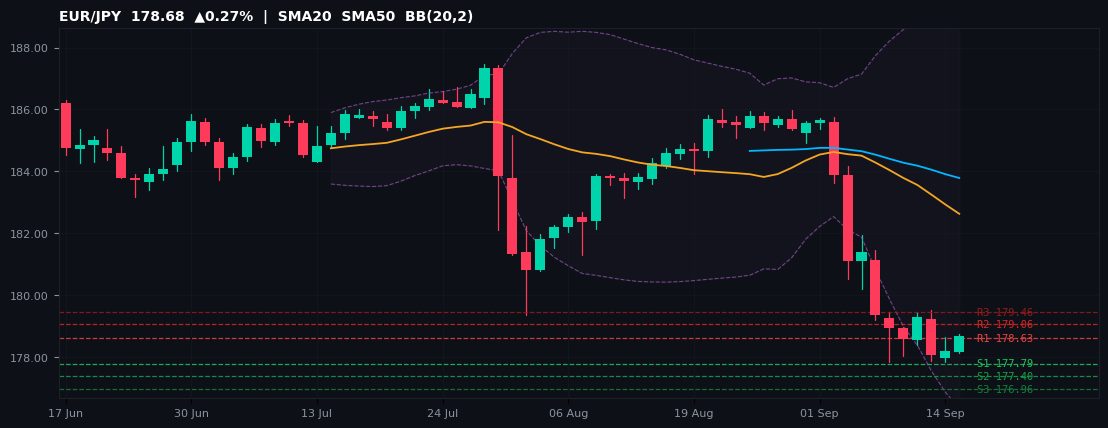
178.68 ▲0.27% Day H 178.76 / L 178.12 52W 172.26–187.94
| R3 | R2 | R1 | S1 | S2 | S3 |
|---|---|---|---|---|---|
| 179.46 | 179.06 | 178.63 | 177.79 | 177.40 | 176.96 |
With the US session now active, EUR/JPY trades at 178.68 (+0.27% vs. yesterday's close), at the 41th percentile of its 172.26–187.94 52-week range. Today's intraday range of 178.12–178.76 (0.64 pips) is above the average daily range. The intraday bias tilts bullish with price above the daily pivot at 178.23.
Price is closest to R1 at 178.63 — a decisive break above R1 (178.63) opens R2 (179.06). The R1–S1 corridor (178.63–177.79) defines the equilibrium zone for the afternoon session; a sustained directional break will likely set the tone into tomorrow's Asian open.
For EUR/JPY, price is in the lower half of its annual range, keeping the path of least resistance lower. The 52-week range of 172.26–187.94 places the pair at the 41th percentile annually. Key risk: any USD-moving headline into the NY close could extend the intraday range well beyond current pivot boundaries.
EUR/JPYRangeboundAbove R1
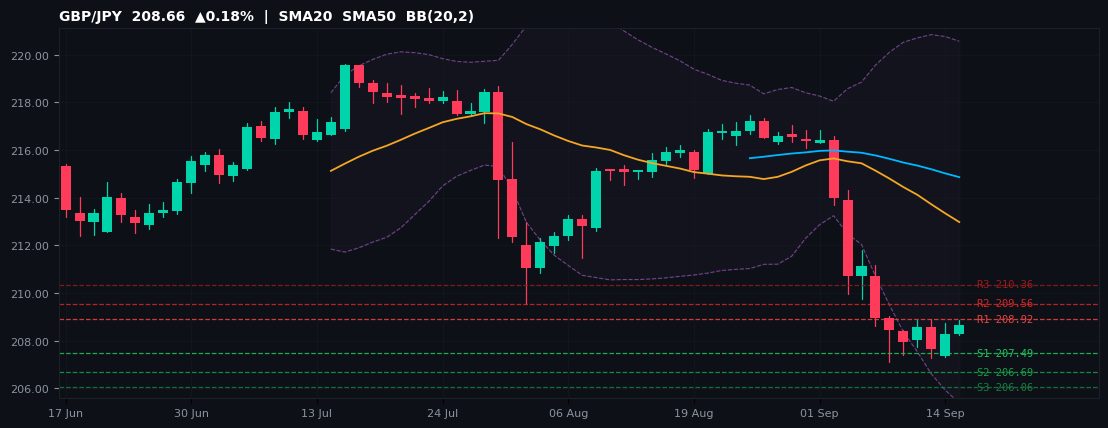
GBP/JPY
208.66 ▲0.18% Day H 208.85 / L 208.23 52W 197.48–219.60
| R3 | R2 | R1 | S1 | S2 | S3 |
|---|---|---|---|---|---|
| 210.36 | 209.56 | 208.92 | 207.49 | 206.69 | 206.06 |
With the US session now active, GBP/JPY trades at 208.66 (+0.18% vs. yesterday's close), at the 51th percentile of its 197.48–219.60 52-week range. Today's intraday range of 208.23–208.85 (0.62 pips) is above the average daily range. The intraday bias tilts bullish with price above the daily pivot at 208.12.
Price is closest to R1 at 208.92 — a decisive break above R1 (208.92) opens R2 (209.56). The R1–S1 corridor (208.92–207.49) defines the equilibrium zone for the afternoon session; a sustained directional break will likely set the tone into tomorrow's Asian open.
For GBP/JPY, intraday momentum is constructive; the upper half of the annual range favours dip-buyers. The 52-week range of 197.48–219.60 places the pair at the 51th percentile annually. Key risk: any USD-moving headline into the NY close could extend the intraday range well beyond current pivot boundaries.
GBP/JPYRangebound
AUD/JPY
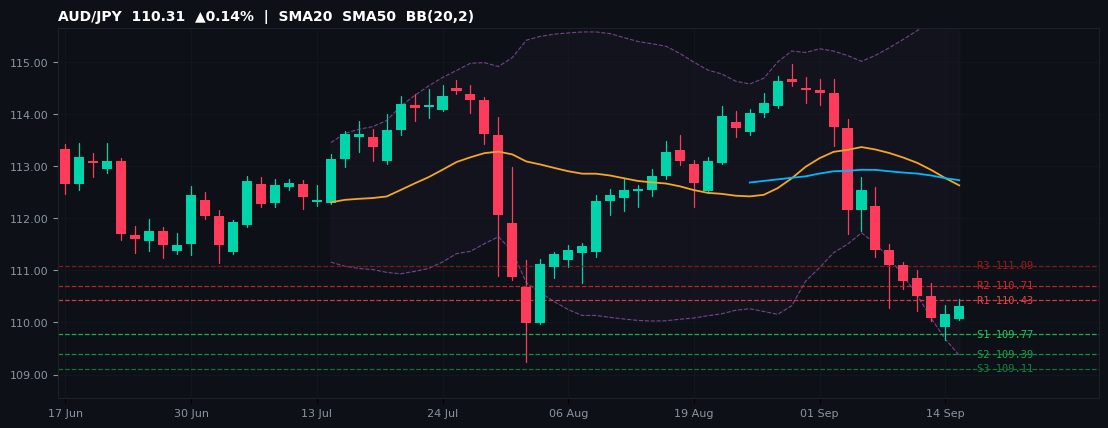
110.31 ▲0.14% Day H 110.45 / L 110.04 52W 96.25–114.95
| R3 | R2 | R1 | S1 | S2 | S3 |
|---|---|---|---|---|---|
| 111.09 | 110.71 | 110.43 | 109.77 | 109.39 | 109.11 |
With the US session now active, AUD/JPY trades at 110.31 (+0.14% vs. yesterday's close), at the 75th percentile of its 96.25–114.95 52-week range. Today's intraday range of 110.04–110.45 (0.41 pips) is above the average daily range. The intraday bias tilts bullish with price above the daily pivot at 110.05.
Price is closest to R1 at 110.43 — a decisive break above R1 (110.43) opens R2 (110.71). The R1–S1 corridor (110.43–109.77) defines the equilibrium zone for the afternoon session; a sustained directional break will likely set the tone into tomorrow's Asian open.
For AUD/JPY, intraday momentum is constructive; the upper half of the annual range favours dip-buyers. The 52-week range of 96.25–114.95 places the pair at the 75th percentile annually. Key risk: any USD-moving headline into the NY close could extend the intraday range well beyond current pivot boundaries.
AUD/JPYRangebound
🏭 Forex Course — Quick Quiz
Test Your Knowledge on Today's Key Themes
Five questions on carry trade dynamics, central bank divergence, commodity-currency correlations and technical extremes. Instant results, mobile-friendly.
Start the Quiz →Nordic Pairs
USD/NOK
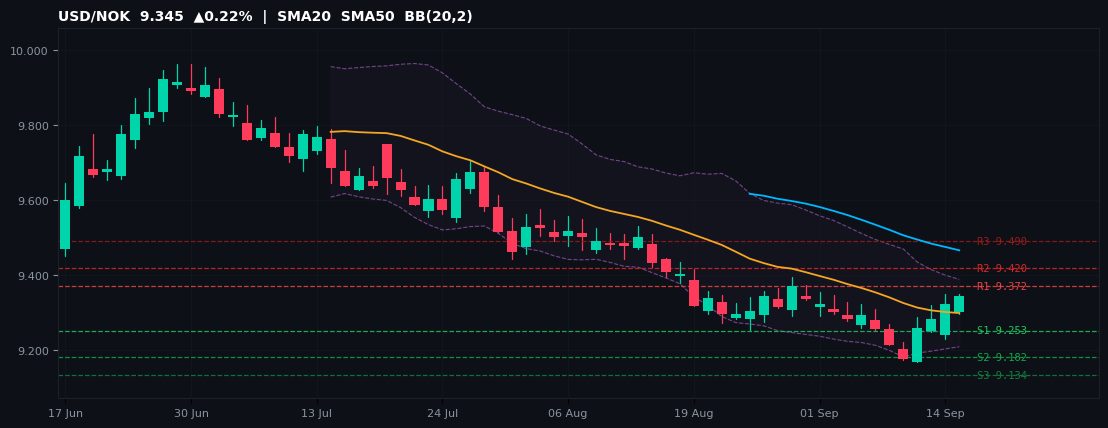
9.345 ▲0.22% Day H 9.350 / L 9.296 52W 9.144–10.297
| R3 | R2 | R1 | S1 | S2 | S3 |
|---|---|---|---|---|---|
| 9.490 | 9.420 | 9.372 | 9.253 | 9.182 | 9.134 |
With the US session now active, USD/NOK trades at 9.345 (+0.22% vs. yesterday's close), at the 17th percentile of its 9.144–10.297 52-week range. Today's intraday range of 9.296–9.350 (0.054 pips) is above the average daily range. The intraday bias tilts bullish with price above the daily pivot at 9.301.
Price is closest to R1 at 9.372 — a decisive break above R1 (9.372) opens R2 (9.420). The R1–S1 corridor (9.372–9.253) defines the equilibrium zone for the afternoon session; a sustained directional break will likely set the tone into tomorrow's Asian open.
For USD/NOK, price is in the lower half of its annual range, keeping the path of least resistance lower. The 52-week range of 9.144–10.297 places the pair at the 17th percentile annually. Key risk: any USD-moving headline into the NY close could extend the intraday range well beyond current pivot boundaries.
USD/NOKRangebound
USD/SEK
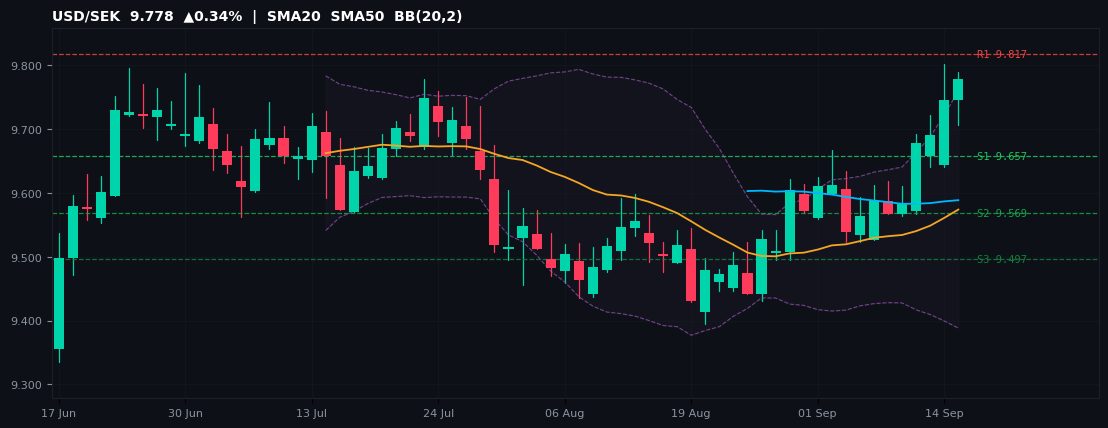
9.778 ▲0.34% Day H 9.789 / L 9.706 52W 8.737–9.801
| R3 | R2 | R1 | S1 | S2 | S3 |
|---|---|---|---|---|---|
| 9.977 | 9.889 | 9.817 | 9.657 | 9.569 | 9.497 |
With the US session now active, USD/SEK trades at 9.778 (+0.34% vs. yesterday's close), just 0.24% below its 52-week high of 9.801. Today's intraday range of 9.706–9.789 (0.084 pips) is above the average daily range. The intraday bias tilts bullish with price above the daily pivot at 9.729.
Price is closest to R1 at 9.817 — a decisive break above R1 (9.817) opens R2 (9.889). The R1–S1 corridor (9.817–9.657) defines the equilibrium zone for the afternoon session; a sustained directional break will likely set the tone into tomorrow's Asian open.
For USD/SEK, upside momentum is intact; the 52W high is the key target on a sustained break above R2. The 52-week range of 8.737–9.801 places the pair at the 98th percentile annually. Key risk: any USD-moving headline into the NY close could extend the intraday range well beyond current pivot boundaries.
USD/SEKBullishNear 52W High
EUR/NOK
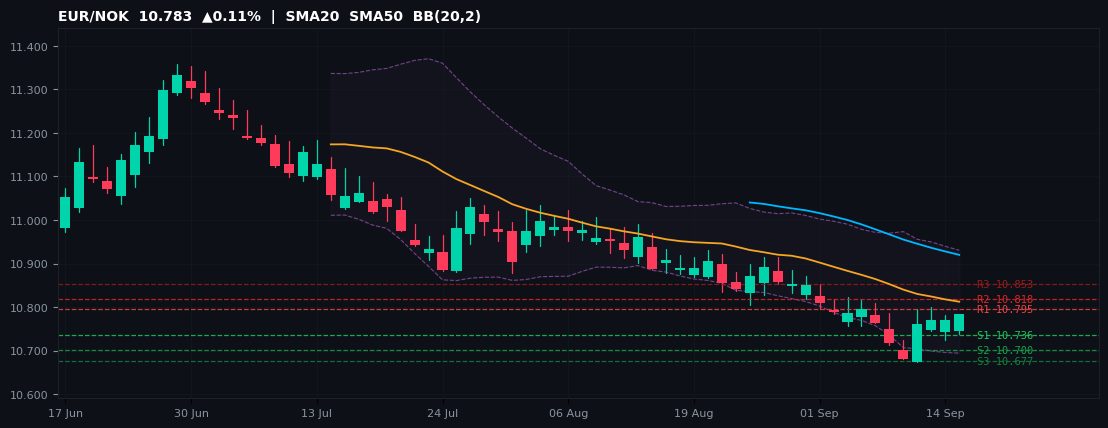
10.783 ▲0.11% Day H 10.784 / L 10.737 52W 10.673–12.012
| R3 | R2 | R1 | S1 | S2 | S3 |
|---|---|---|---|---|---|
| 10.853 | 10.818 | 10.795 | 10.736 | 10.700 | 10.677 |
With the US session now active, EUR/NOK trades at 10.783 (+0.11% vs. yesterday's close), just 1.03% above its 52-week floor at 10.673. Today's intraday range of 10.737–10.784 (0.047 pips) is above the average daily range. The intraday bias tilts bullish with price above the daily pivot at 10.759.
Price is closest to R1 at 10.795 — a decisive break above R1 (10.795) opens R2 (10.818). The R1–S1 corridor (10.795–10.736) defines the equilibrium zone for the afternoon session; a sustained directional break will likely set the tone into tomorrow's Asian open.
For EUR/NOK, the annual support remains the decisive level — bulls need a firm hold here to prevent a deeper pullback. The 52-week range of 10.673–12.012 places the pair at the 8th percentile annually. Key risk: any USD-moving headline into the NY close could extend the intraday range well beyond current pivot boundaries.
EUR/NOKRangeboundNear 52W Low
NOK/SEK
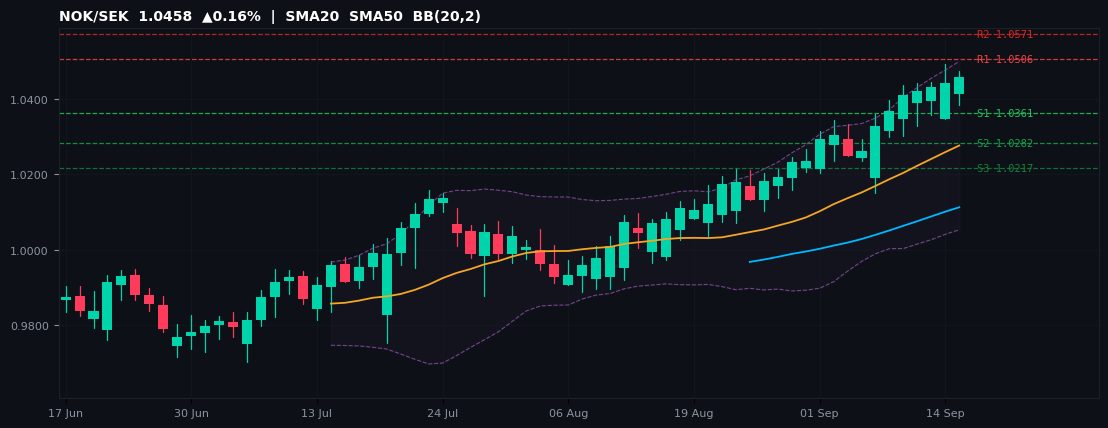
1.0458 ▲0.16% Day H 1.0473 / L 1.0382 52W 0.9064–1.0491
| R3 | R2 | R1 | S1 | S2 | S3 |
|---|---|---|---|---|---|
| 1.0650 | 1.0571 | 1.0506 | 1.0361 | 1.0282 | 1.0217 |
With the US session now active, NOK/SEK trades at 1.0458 (+0.16% vs. yesterday's close), just 0.31% below its 52-week high of 1.0491. Today's intraday range of 1.0382–1.0473 (0.0091 pips) is above the average daily range. The intraday bias tilts bullish with price above the daily pivot at 1.0426.
Price is closest to R1 at 1.0506 — a decisive break above R1 (1.0506) opens R2 (1.0571). The R1–S1 corridor (1.0506–1.0361) defines the equilibrium zone for the afternoon session; a sustained directional break will likely set the tone into tomorrow's Asian open.
For NOK/SEK, upside momentum is intact; the 52W high is the key target on a sustained break above R2. The 52-week range of 0.9064–1.0491 places the pair at the 98th percentile annually. Key risk: any USD-moving headline into the NY close could extend the intraday range well beyond current pivot boundaries.
NOK/SEKRangeboundNear 52W High
Exotic Pairs
USD/TRY
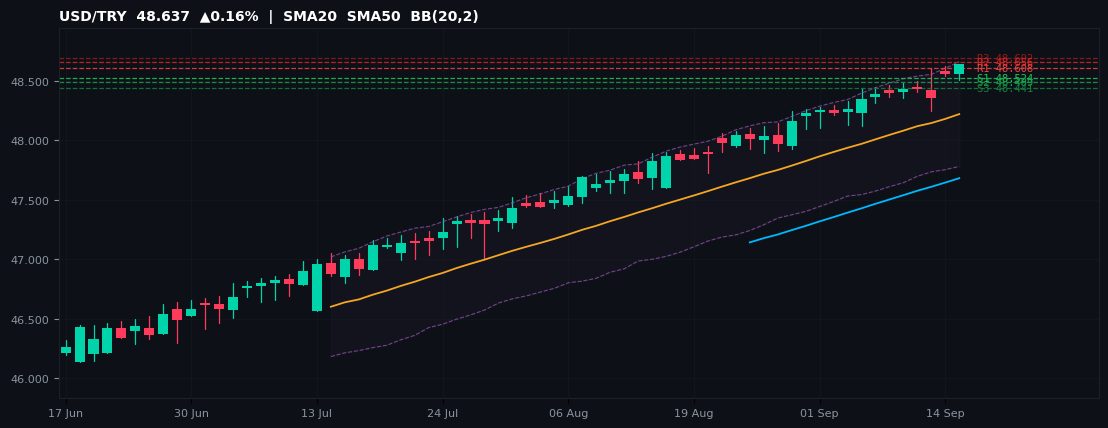
48.637 ▲0.16% Day H 48.638 / L 48.503 52W 41.151–48.638
| R3 | R2 | R1 | S1 | S2 | S3 |
|---|---|---|---|---|---|
| 48.692 | 48.656 | 48.608 | 48.524 | 48.489 | 48.441 |
With the US session now active, USD/TRY trades at 48.637 (+0.16% vs. yesterday's close), just 0.00% below its 52-week high of 48.638. Today's intraday range of 48.503–48.638 (0.135 pips) is above the average daily range. The intraday bias tilts bullish with price above the daily pivot at 48.573.
Price is closest to R1 at 48.608 — a decisive break above R1 (48.608) opens R2 (48.656). The R1–S1 corridor (48.608–48.524) defines the equilibrium zone for the afternoon session; a sustained directional break will likely set the tone into tomorrow's Asian open.
For USD/TRY, upside momentum is intact; the 52W high is the key target on a sustained break above R2. The 52-week range of 41.151–48.638 places the pair at the 100th percentile annually. Key risk: any USD-moving headline into the NY close could extend the intraday range well beyond current pivot boundaries.
USD/TRYRangeboundAbove R1Near 52W High
USD/MXN
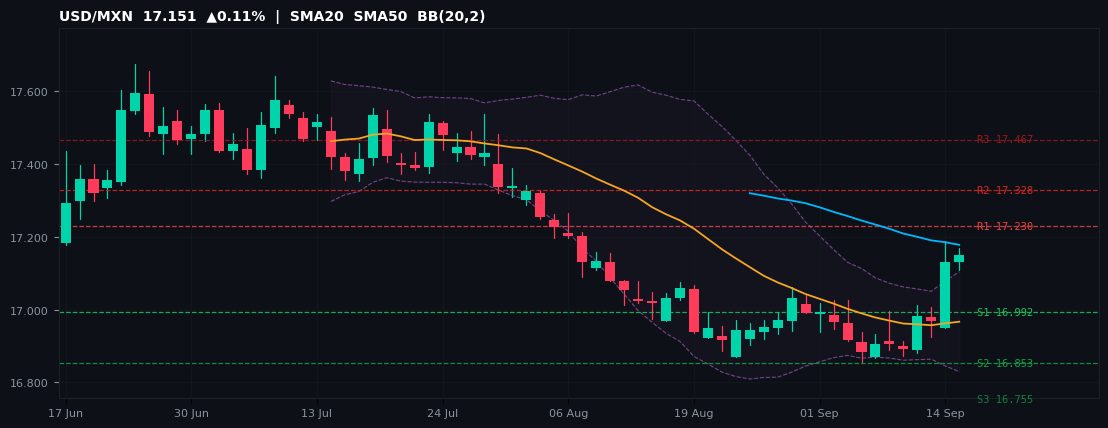
17.151 ▲0.11% Day H 17.170 / L 17.109 52W 16.855–18.768
| R3 | R2 | R1 | S1 | S2 | S3 |
|---|---|---|---|---|---|
| 17.467 | 17.328 | 17.230 | 16.992 | 16.853 | 16.755 |
With the US session now active, USD/MXN trades at 17.151 (+0.11% vs. yesterday's close), at the 15th percentile of its 16.855–18.768 52-week range. Today's intraday range of 17.109–17.170 (0.061 pips) is above the average daily range. The intraday bias tilts bullish with price above the daily pivot at 17.090.
Price is closest to R1 at 17.230 — a decisive break above R1 (17.230) opens R2 (17.328). The R1–S1 corridor (17.230–16.992) defines the equilibrium zone for the afternoon session; a sustained directional break will likely set the tone into tomorrow's Asian open.
For USD/MXN, price is in the lower half of its annual range, keeping the path of least resistance lower. The 52-week range of 16.855–18.768 places the pair at the 15th percentile annually. Key risk: any USD-moving headline into the NY close could extend the intraday range well beyond current pivot boundaries.
USD/MXNRangebound
USD/ZAR
16.29 ▲0.31% Day H 16.33 / L 16.23 52W 15.64–17.57
| R3 | R2 | R1 | S1 | S2 | S3 |
|---|---|---|---|---|---|
| 16.56 | 16.45 | 16.35 | 16.14 | 16.03 | 15.92 |
With the US session now active, USD/ZAR trades at 16.29 (+0.31% vs. yesterday's close), at the 34th percentile of its 15.64–17.57 52-week range. Today's intraday range of 16.23–16.33 (0.09 pips) is above the average daily range. The intraday bias tilts bullish with price above the daily pivot at 16.24.
Price is closest to R1 at 16.35 — a decisive break above R1 (16.35) opens R2 (16.45). The R1–S1 corridor (16.35–16.14) defines the equilibrium zone for the afternoon session; a sustained directional break will likely set the tone into tomorrow's Asian open.
For USD/ZAR, price is in the lower half of its annual range, keeping the path of least resistance lower. The 52-week range of 15.64–17.57 places the pair at the 34th percentile annually. Key risk: any USD-moving headline into the NY close could extend the intraday range well beyond current pivot boundaries.
USD/ZARBullish
USD/PLN
3.7616 ▲0.12% Day H 3.7695 / L 3.7492 52W 3.4750–3.8127
| R3 | R2 | R1 | S1 | S2 | S3 |
|---|---|---|---|---|---|
| 3.8268 | 3.7990 | 3.7781 | 3.7294 | 3.7016 | 3.6807 |
With the US session now active, USD/PLN trades at 3.7616 (+0.12% vs. yesterday's close), just 1.36% below its 52-week high of 3.8127. Today's intraday range of 3.7492–3.7695 (0.0203 pips) is above the average daily range. The intraday bias tilts bullish with price above the daily pivot at 3.7503.
Price is closest to R1 at 3.7781 — a decisive break above R1 (3.7781) opens R2 (3.7990). The R1–S1 corridor (3.7781–3.7294) defines the equilibrium zone for the afternoon session; a sustained directional break will likely set the tone into tomorrow's Asian open.
For USD/PLN, upside momentum is intact; the 52W high is the key target on a sustained break above R2. The 52-week range of 3.4750–3.8127 places the pair at the 85th percentile annually. Key risk: any USD-moving headline into the NY close could extend the intraday range well beyond current pivot boundaries.
USD/PLNRangeboundNear 52W High
Informational purposes only — not investment advice. Pivot levels computed from yesterday's session OHLC via standard floor-pivot formula. Prices sourced from MetaTrader 5 as of Tuesday 15 September 2026 midday (15:30 CET). Past performance is not indicative of future results.