Fibonacci Retracement Analysis: USD/JPY and GBP/USD Near Key Levels
MarketsFN Team
Published: October 21, 2026
Market Overview
The US Dollar is experiencing limited short-term gains ahead of a potential Federal Reserve pause, while it hovers near a three-week low, influenced by fluctuating oil prices. The British Pound remains stable despite a rise in UK CPI inflation to 3.5% YoY, above expectations, while the Japanese Yen strengthens following a record bond auction, contributing to a decline in the Dollar. Overall, the currency market is reacting to mixed economic indicators and central bank signals, shaping movements in various pairs.
USD/JPY - U.S. Dollar / Japanese Yen
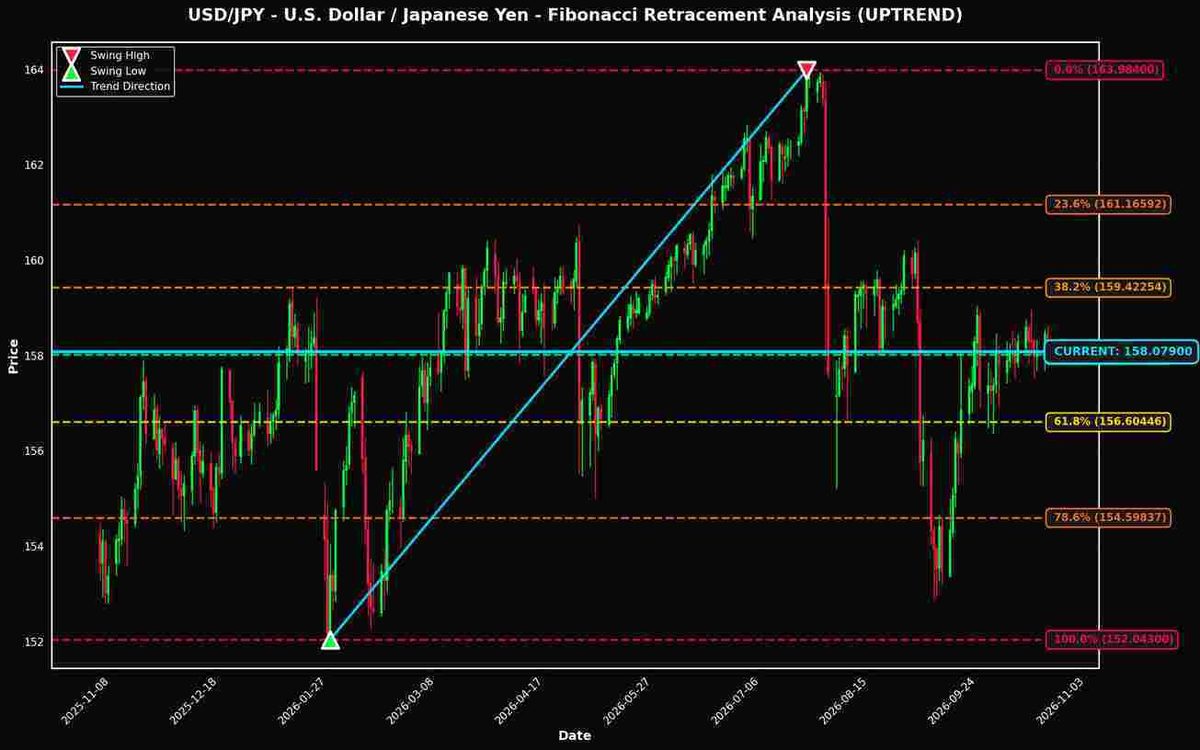
Currently trading at 158.07900 (-0.04% today), USD/JPY is positioned just 0.04% away from the critical 50.0% Fibonacci retracement level, making it a pair to watch closely.

Technical Analysis
### USD/JPY Technical Analysis As of the latest data, USD/JPY is trading at 158.079, firmly positioned within an uptrend. The recent swing high at 163.984 and swing low at 152.043 provide critical reference points for Fibonacci retracement analysis. The current price is notably close to the 50.0% Fibonacci retracement level at 158.01350, just 0.04% away, indicating a pivotal area of interest for traders. The proximity to the 50.0% retracement level is particularly significant, as this level often acts as a psychological barrier and a fulcrum for potential trend continuation or reversal. A sustained hold above this level may suggest that bullish momentum is intact, potentially propelling the price towards the next Fibonacci resistance level at 38.2% (159.42254), which is just 0.85% above the current price. Conversely, a decisive break below 50.0% could signal a correction, with support likely found at the 61.8% level (156.60446). In terms of key support and resistance zones, the area around 158.01350 (50.0%) serves as a critical support zone. Should this level fail to hold, 156.60446 (61.8%) emerges as the next significant support. On the resistance front, the swing high of 163.984 remains a key target, with the 23.6% level (161.16592) also acting as a near-term resistance point. For traders, the implications are clear: a rebound from the 50.0% level could present a long opportunity, while a break below this level may necessitate a reassessment of bullish positions. Important levels to watch include 158.01350 (50.0% retracement), 159.42254 (38.2% retracement), and the support at 156.60446 (61.8% retracement). Monitoring price action around these levels will be crucial in determining the next directional move for USD/JPY.
Fibonacci Levels
| Level | Price | Distance | Status |
|---|---|---|---|
| 0.0% | 163.98400 | +5.90500 (+3.74%) | ↑ RESISTANCE |
| 23.6% | 161.16592 | +3.08692 (+1.95%) | ↑ RESISTANCE |
| 38.2% | 159.42254 | +1.34354 (+0.85%) | ↑ RESISTANCE |
| 50.0% | 158.01350 | -0.06550 (-0.04%) | ↓ SUPPORT |
| 61.8% | 156.60446 | -1.47454 (-0.93%) | ↓ SUPPORT |
| 78.6% | 154.59837 | -3.48063 (-2.20%) | ↓ SUPPORT |
| 100.0% | 152.04300 | -6.03600 (-3.82%) | ↓ SUPPORT |
GBP/USD - British Pound / U.S. Dollar
Trading at 1.33743 (-0.02% today), GBP/USD is also showing interesting positioning near the 61.8% level (only 0.28% away).
The GBP/USD is currently trading at 1.33743, positioned just 0.28% above the critical 61.8% Fibonacci retracement level at 1.33372, which is a significant zone in the context of the prevailing uptrend. This proximity suggests potential support, as the 61.8% level is widely regarded as a strong retracement point where buyers may enter the market. Should the price hold above this level, the next resistance targets are the 50.0% level at 1.34385 and the 38.2% level at 1.35398, which represent potential profit-taking areas for bullish traders. Conversely, if the price breaches the 61.8% support, it may open the door to test the 78.6% level at 1.31930. Traders should closely monitor the 61.8% level for signs of bullish reversal or possible breakdown. A decisive close above 1.34385 could signal a continuation of the uptrend, while a close below 1.33372 may warrant caution for long positions.
Fibonacci Levels
| Level | Price | Distance | Status |
|---|---|---|---|
| 0.0% | 1.38677 | +0.04934 (+3.69%) | ↑ RESISTANCE |
| 23.6% | 1.36651 | +0.02908 (+2.17%) | ↑ RESISTANCE |
| 38.2% | 1.35398 | +0.01655 (+1.24%) | ↑ RESISTANCE |
| 50.0% | 1.34385 | +0.00642 (+0.48%) | ↑ RESISTANCE |
| 61.8% | 1.33372 | -0.00371 (-0.28%) | ↓ SUPPORT |
| 78.6% | 1.31930 | -0.01813 (-1.36%) | ↓ SUPPORT |
| 100.0% | 1.30093 | -0.03650 (-2.73%) | ↓ SUPPORT |
Key Takeaways
- USD/JPY is positioned near the 50.0% Fibonacci level, a historically significant price zone
- GBP/USD is also testing the 61.8% retracement level
- These Fibonacci levels often act as dynamic support and resistance zones
- Traders should monitor price action at these levels for potential trading opportunities
- Risk management remains crucial when trading near Fibonacci retracement levels
Disclaimer
The content on MarketsFN.com is provided for educational and informational purposes only. It does not constitute financial advice, investment recommendations, or trading guidance. All investments involve risks, and past performance does not guarantee future results. You are solely responsible for your investment decisions and should conduct independent research and consult a qualified financial advisor before acting. MarketsFN.com and its authors are not liable for any losses or damages arising from your use of this information.