EUR/USD: Down 0.05% to 1.1627 — Bullish — Above Key MAs
MarketsFN Team
EUR/USD: Down 0.05% to 1.1627 — Bullish — Above Key MAs
Published: September 10, 2026 · MarketsFN Team · US Session
| Pair | Rate | Change | RSI(14) | SMA-20 | SMA-50 | 52W High | 52W Low | Pivot | R1 | S1 |
|---|---|---|---|---|---|---|---|---|---|---|
| EUR/USD | 1.1627 | -0.05% | 40.4 | 1.1626 | 1.1525 | 1.2041 | 1.1358 | 1.1635 | 1.1651 | 1.1617 |
📊 Support & Resistance Levels
Dynamic Trendlines
| Level | Type | Direction | Distance |
|---|---|---|---|
| 1.1586 | 20d Support | ↗ ascending | -0.36% / 41.5 pips |
| 1.1649 | 20d Resistance | ↘ descending | +0.19% / 22.0 pips |
| 1.1592 | 50d Support | ↗ ascending | -0.30% / 35.4 pips |
| 1.1822 | 50d Resistance | ↗ ascending | +1.67% / 194.6 pips |
Static Levels
| Level | Type | Touches | Distance |
|---|---|---|---|
| 1.1729 | Resistance | 2× | +0.86% / 100.5 pips |
| 1.1668 | Resistance | 2× | +0.34% / 39.4 pips |
| 1.1640 | Resistance | 2× | +0.10% / 11.8 pips |
| 1.1616 | Support | 2× | -0.10% / 12.1 pips |
| 1.1575 | Support | 3× | -0.46% / 53.5 pips |
| 1.1505 | Support | 2× | -1.06% / 122.7 pips |
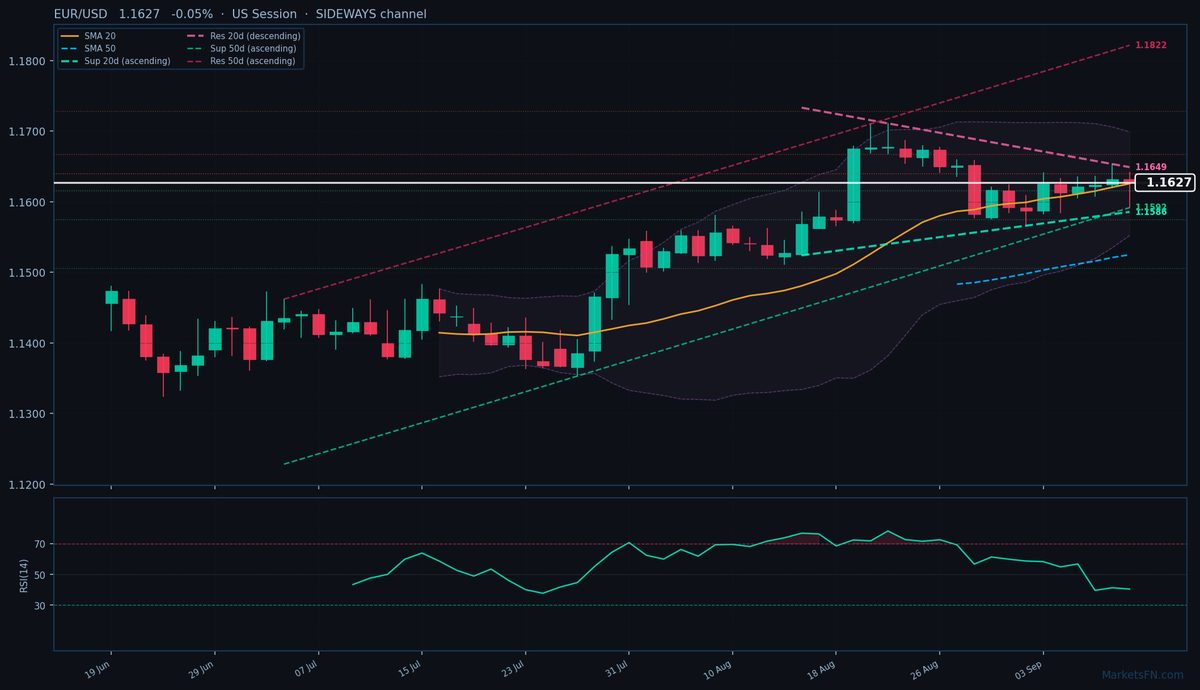
EUR/USD is trading at 1.1627 (-0.05%), hovering just above its SMA-20 (1.1626) and firmly above the SMA-50 (1.1525), confirming the pair remains in a broader uptrend despite today’s minor pullback. The 50-day dynamic channel is ascending, with immediate support at 1.1592 (-35.4 pips) and resistance at 1.1822 (+194.6 pips), while the 20-day channel shows a sideways bias with descending resistance at 1.1649 (+22.0 pips) and ascending support at 1.1586 (-41.5 pips).
Static levels reveal tight near-term boundaries: R1 at 1.1640 (+11.8 pips) and S1 at 1.1616 (-12.1 pips) are the closest hurdles, with today’s range (1.1591–1.1642) already testing these zones. The RSI at 40.4 is neutral but leaning toward oversold, suggesting limited downside momentum unless the pair breaches the 20-day dynamic support (1.1586).
The short-term outlook hinges on whether EUR/USD can reclaim the pivot at 1.1635 (+0.8 pips) to challenge R1. Failure here could see a retest of S1 (1.1616) or the 20-day dynamic support (1.1586). Given the ascending 50-day channel, dips toward 1.1592–1.1586 may attract buyers, but a close below 1.1586 would invalidate the near-term uptrend. Watch US session flows for confirmation—a break above 1.1649 (20-day dynamic resistance) would signal renewed bullish momentum.
Disclaimer
The content on MarketsFN.com is provided for educational and informational purposes only and does not constitute financial advice. All investments involve risk and past performance does not guarantee future results.