Dogecoin Tests Key Support at $0.0796 Amid Bearish RSI Signal
QuoteReporter
•2 min read
Dogecoin Tests Key Support at $0.0796 Amid Bearish RSI Signal
Dogecoin (DOGE/USD) | September 16, 2026 $0.0796 -0.59%
🔍 Technical Analysis
**Dogecoin (DOGE) Technical Analysis**
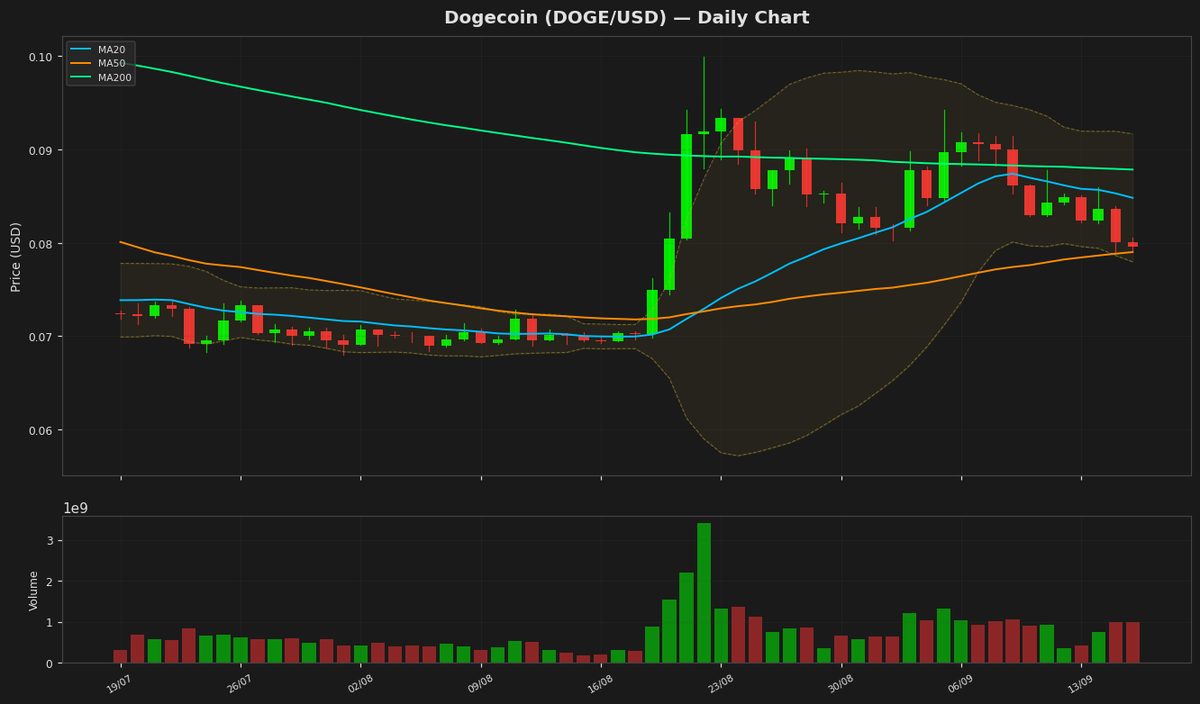
Dogecoin is currently trading at $0.0796, showing a slight daily decline of 0.59%. The price remains below the 20-day moving average (MA20) at $0.0848 but is hovering near the 50-day moving average (MA50) at $0.0790, indicating a neutral to slightly bearish short-term trend. The 200-day moving average (MA200) at $0.0878 acts as a key resistance level.
Bollinger Bands show moderate volatility, with the upper band at $0.0917 and the lower band at $0.0780. The current price is near the lower band, suggesting potential oversold conditions. The RSI at 46.88 is neutral, neither overbought nor oversold, indicating a lack of strong momentum. The MACD line (0.000317) is below the signal line (0.001586), reflecting weak bullish momentum.
Key support lies at the recent low of $0.0779 (Bollinger lower band) and the yearly low of $0.0679. Resistance levels include the MA20 at $0.0848 and the 52-week high of $0.1511. The ATR (14) at 0.0043 suggests low volatility, which may precede a breakout.
In summary, DOGE is in a consolidation phase with a slight bearish bias. A break above the MA20 could signal a bullish reversal, while a drop below $0.0779 may lead to further downside.
Dogecoin is currently trading at $0.0796, showing a slight daily decline of 0.59%. The price remains below the 20-day moving average (MA20) at $0.0848 but is hovering near the 50-day moving average (MA50) at $0.0790, indicating a neutral to slightly bearish short-term trend. The 200-day moving average (MA200) at $0.0878 acts as a key resistance level.
Bollinger Bands show moderate volatility, with the upper band at $0.0917 and the lower band at $0.0780. The current price is near the lower band, suggesting potential oversold conditions. The RSI at 46.88 is neutral, neither overbought nor oversold, indicating a lack of strong momentum. The MACD line (0.000317) is below the signal line (0.001586), reflecting weak bullish momentum.
Key support lies at the recent low of $0.0779 (Bollinger lower band) and the yearly low of $0.0679. Resistance levels include the MA20 at $0.0848 and the 52-week high of $0.1511. The ATR (14) at 0.0043 suggests low volatility, which may precede a breakout.
In summary, DOGE is in a consolidation phase with a slight bearish bias. A break above the MA20 could signal a bullish reversal, while a drop below $0.0779 may lead to further downside.
Technical Metrics
| Metric | Value |
|---|---|
| Current Price | $0.0796 |
| Daily Change | -0.59% |
| MA 20 | $0.0848 |
| % from MA20 | -6.15% |
| MA 50 | $0.0790 |
| % from MA50 | +0.75% |
| MA 200 | $0.0878 |
| % from MA200 | -9.39% |
| BB Upper | $0.0917 |
| % from BB Upper | -13.17% |
| BB Lower | $0.0780 |
| % from BB Lower | +2.11% |
| RSI (14) | 46.88 |
| MACD | 0.000317 |
| MACD Signal | 0.001586 |
| ATR (14) | 0.004325 |
| 3-Day High | $0.0860 |
| 3-Day Low | $0.0790 |
| 52-Week High | $0.1511 |
| % from 52W High | -47.31% |
| 52-Week Low | $0.0680 |
| % from 52W Low | +17.11% |
| YTD High | $0.1561 |
| % from YTD High | -49.00% |
| YTD Low | $0.0680 |
| % from YTD Low | +17.11% |
📊 Market Commentary
Dogecoin (DOGE) is currently trading at $0.0796, showing a slight decline of 0.59% today. The Relative Strength Index (RSI) at 46.9 suggests a neutral market stance, neither overbought nor oversold, indicating balanced buying and selling pressure. Over the past 52 weeks, DOGE has fluctuated between $0.0680 and $0.1511, reflecting its characteristic volatility within the meme coin sector.
Market sentiment around Dogecoin remains mixed. While its strong community support and occasional social media-driven rallies provide optimism, the lack of significant utility compared to more fundamentally driven cryptocurrencies keeps some traders cautious. Key support levels to watch include the yearly low of $0.0680, while resistance sits near the psychological $0.10 mark, followed by the yearly high of $0.1511.
Traders are monitoring broader market trends, particularly Bitcoin’s performance, which often influences altcoin movements. Additionally, any notable developments in adoption, such as new merchant integrations or high-profile endorsements, could spark short-term volatility. Given DOGE’s history of rapid price swings, liquidity and trading volume are also critical indicators being tracked. For now, the asset appears to be in a consolidation phase, with traders awaiting clearer signals before taking decisive positions.
Market sentiment around Dogecoin remains mixed. While its strong community support and occasional social media-driven rallies provide optimism, the lack of significant utility compared to more fundamentally driven cryptocurrencies keeps some traders cautious. Key support levels to watch include the yearly low of $0.0680, while resistance sits near the psychological $0.10 mark, followed by the yearly high of $0.1511.
Traders are monitoring broader market trends, particularly Bitcoin’s performance, which often influences altcoin movements. Additionally, any notable developments in adoption, such as new merchant integrations or high-profile endorsements, could spark short-term volatility. Given DOGE’s history of rapid price swings, liquidity and trading volume are also critical indicators being tracked. For now, the asset appears to be in a consolidation phase, with traders awaiting clearer signals before taking decisive positions.
Disclaimer
The content on MarketsFN.com is provided for educational and informational purposes only. It does not constitute financial advice or investment recommendations. All investments involve risk. Cryptocurrency markets are highly volatile. Past performance does not guarantee future results.