Crypto Market Slumps: Solana, BNB, and Dogecoin Lead Today's Losses
QuoteReporter
•5 min read
Crypto Market Report | October 27, 2026
📊 Crypto Market Overview
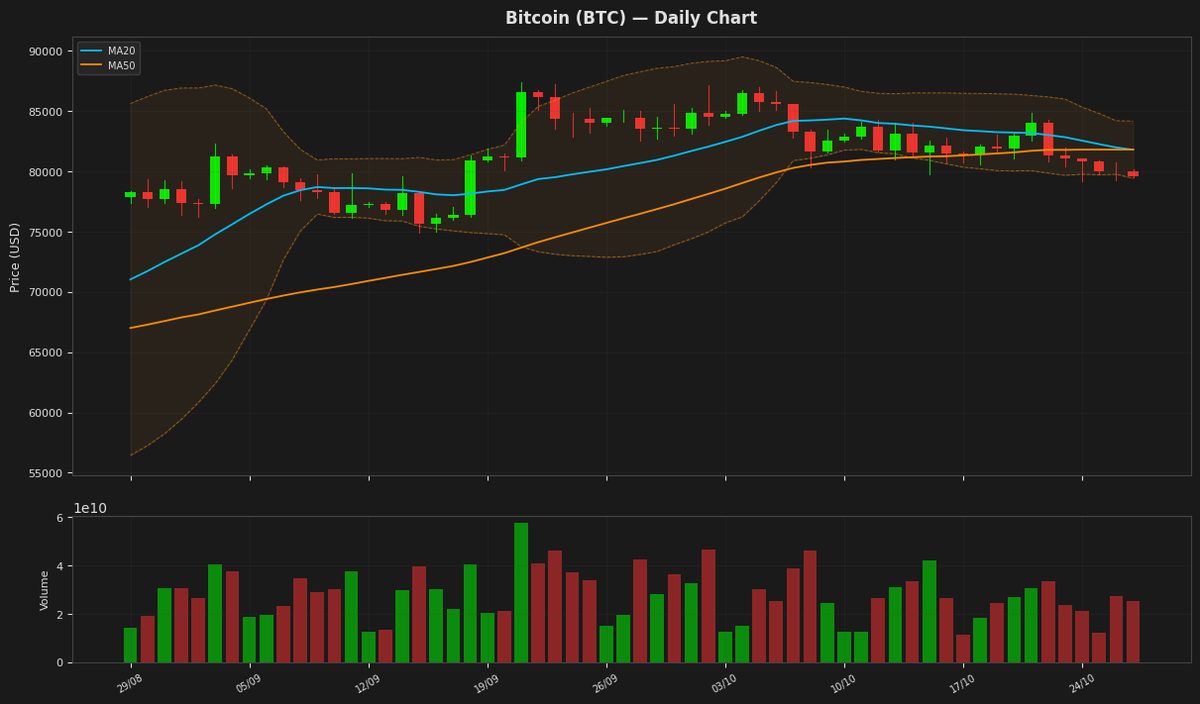
The cryptocurrency market is currently experiencing a mixed sentiment, with most major assets trading in the red. Bitcoin, the largest cryptocurrency by market capitalization, has seen a decline of 0.53% over the past 24 hours, trading at $79,582.4531. The Relative Strength Index (RSI) for Bitcoin stands at 32.9, indicating that it is approaching oversold territory. The Moving Average Convergence Divergence (MACD) is negative at -554.7703, suggesting a bearish trend.
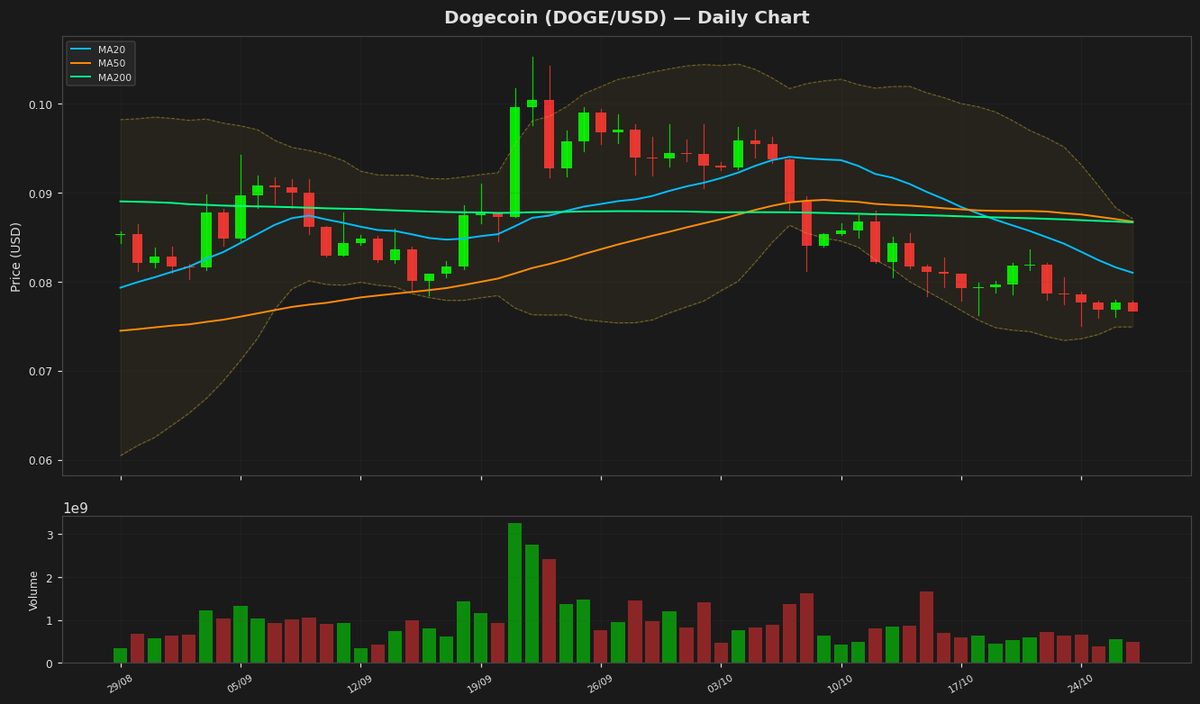
Other major cryptocurrencies, including Ethereum, Ripple, Solana, BNB, Tron, and Dogecoin, have also seen declines, ranging from 0.55% to 1.11%. Ethereum's RSI is particularly low at 25.3, indicating that it is heavily oversold. Solana and Dogecoin are also in oversold territory, with RSIs of 28.6 and 24.1, respectively.
In terms of macro context, the recent news has been mixed. Binance has filed for a crypto license in Brazil ahead of a Friday deadline, indicating the exchange's efforts to expand its global presence. However, the crypto space has also seen several high-profile security breaches, including a $953,000 hack attributed to the Bloom bot and a keystone breach that allowed hackers to verify wallets as genuine. On the other hand, Ripple has won final US approval for a national trust bank, a positive development for the company.
Notable technical signals include the negative MACD readings for most major cryptocurrencies, indicating a bearish trend. Bitcoin ETFs have seen a significant outflow of $774 million, although they have clawed back $110 million. The US Office of the Comptroller of the Currency has called on community banks to become payment stablecoin issuers, a development that could have implications for the stablecoin market. Overall, the cryptocurrency market is currently characterized by a bearish sentiment, with many assets trading in oversold territory.
📰 Crypto News
- Bloom bot hackers loot $953K faster than you can microwave popcorn
- Binance files for Brazil crypto license ahead of Friday deadline
- Bitcoin ETFs claw back $110M after $774M exit
- Here’s what happened in crypto today
- RedotPay weighs confidential US IPO filing by year-end: Bloomberg
- Keystone breach deepens: Hackers stole key used to verify wallets as genuine
- Ripple wins final US approval for national trust bank
- US OCC calls on community banks to become payment stablecoin issuers
- An AI label alone no longer wins lenders, JPMorgan says
- Solana bug reports now cost 1 SOL as AI floods security teams with spam
- Ethereum fixes Glamsterdam bug that could have sent staking deposits to builders
- Zcash co-founder proposes ending grants funding, citing $125 million treasury
- Ripple gets a final go-ahead to launch its own U.S. national trust bank
- Canada’s Draft Stablecoin Rules Cap Redemption Fees at 1% and Ban Yield
- OpenAI Launches GPT-6.1 Terra, Its Half-Good AI Model at Half the Price
🔍 Technical Analysis
Bitcoin (BTC) — -0.53%
$79,582.45 52W: $57,747.77 — $87,363.76
Bitcoin's price is currently at $79,582, showing a slight decline, and is positioned near the lower band of the Bollinger Bands at $79,419, indicating potential support. The RSI is at 32.88, suggesting the asset is approaching oversold territory. The MACD is below its signal line, indicating a bearish trend. The ATR remains high at $1,875, indicating significant volatility.
Ethereum (ETH) — -0.55%
$2,307.54 52W: $1,506.51 — $2,805.50
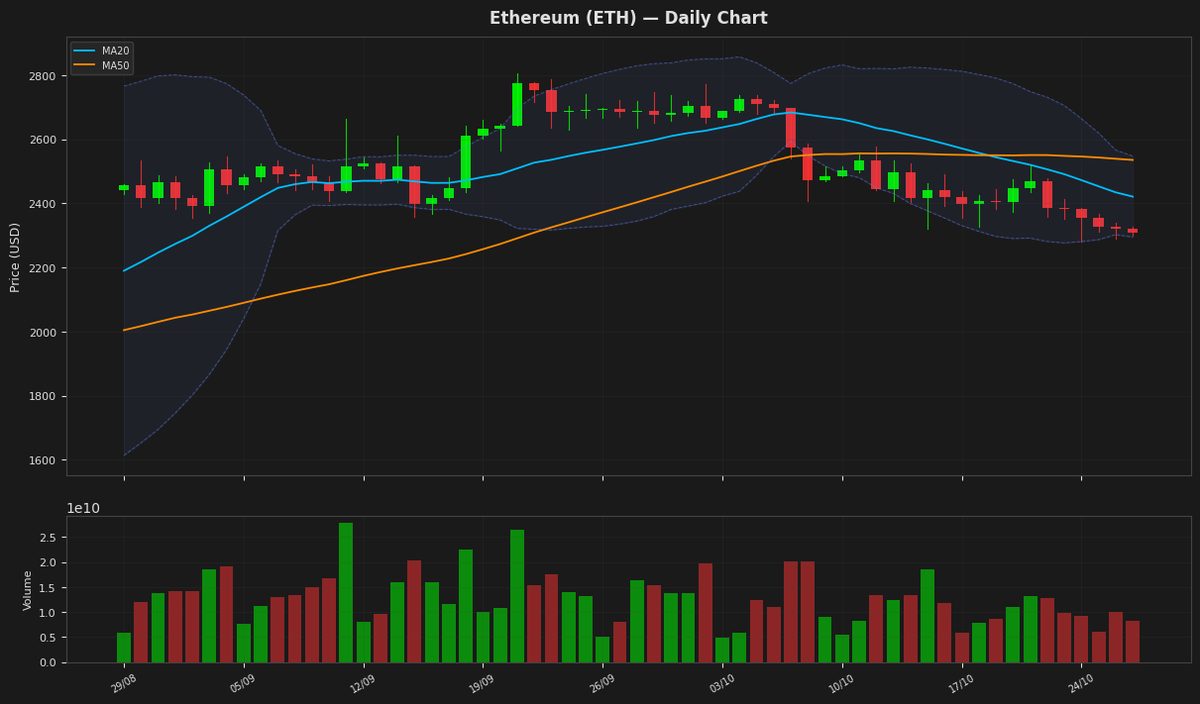
Ethereum's price is currently at $2,307.54, showing a slight decline, and is positioned near the lower Bollinger Band at $2,294.96, indicating potential oversold conditions as the RSI(14) stands at 25.34. The MACD is below its signal line, suggesting a bearish trend. The price is also below both the MA20 and MA50, further reinforcing the bearish sentiment.
Ripple (XRP) — -0.74%
$1.2972 52W: $0.988422 — $1.6838
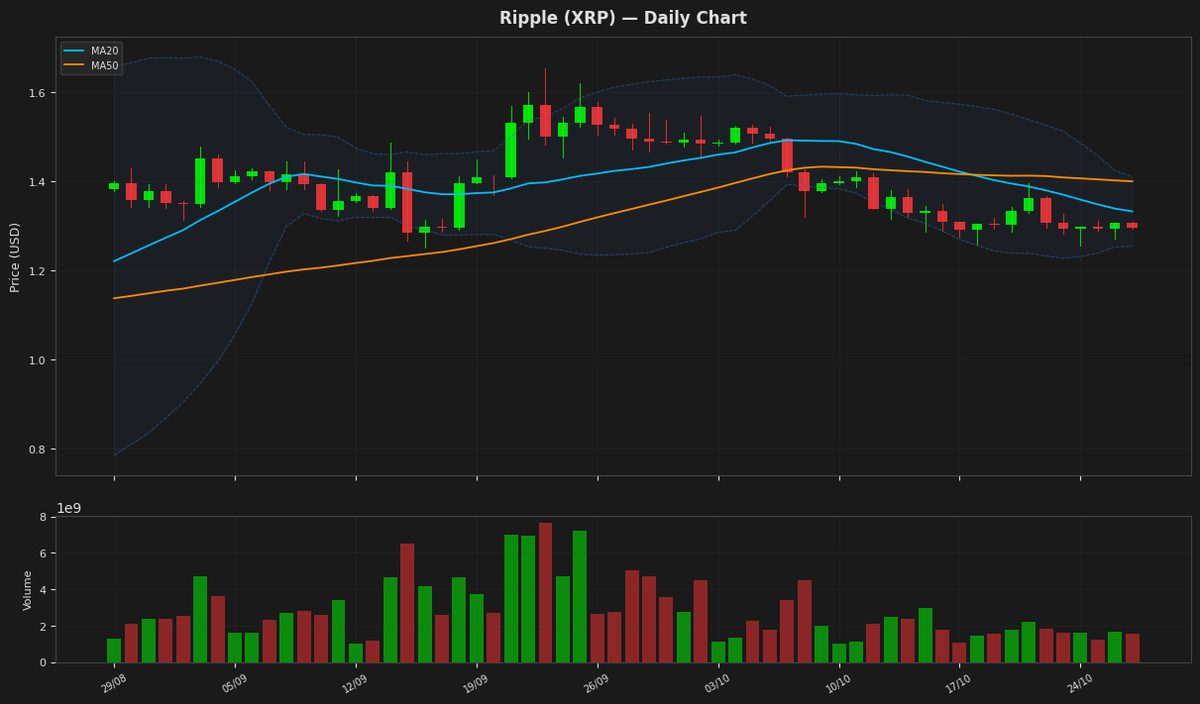
Ripple's price is currently at $1.297200, showing a decline of 0.74% for the day, and is positioned between the Bollinger Band upper and lower limits, indicating a consolidating trend. The RSI at 36.771201 suggests the asset is nearing oversold territory, while the MACD is below its signal line, indicating a potential bearish signal. The price is also below both the MA20 and MA50, further indicating a bearish trend. The ATR suggests moderate volatility.
Solana (SOL) — -1.11%
$99.6400 52W: $60.4147 — $124.6174
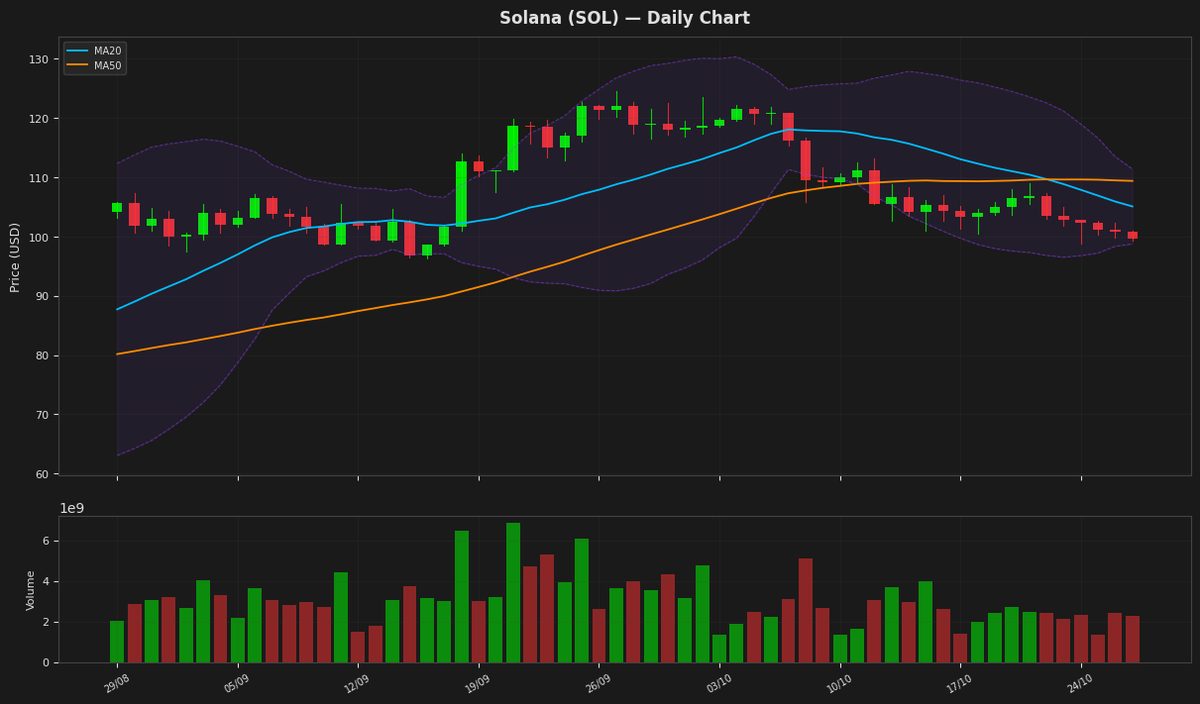
Solana's price is currently at $99.64, showing a slight decline, and is positioned near the lower Bollinger Band at $98.75, indicating potential oversold conditions as supported by the RSI(14) value of 28.60. The MACD is below its signal line, suggesting a bearish trend. The price is also below both MA20 and MA50, further indicating a downtrend.
BNB (BNB) — -0.86%
$735.0600 52W: $538.5992 — $808.4329
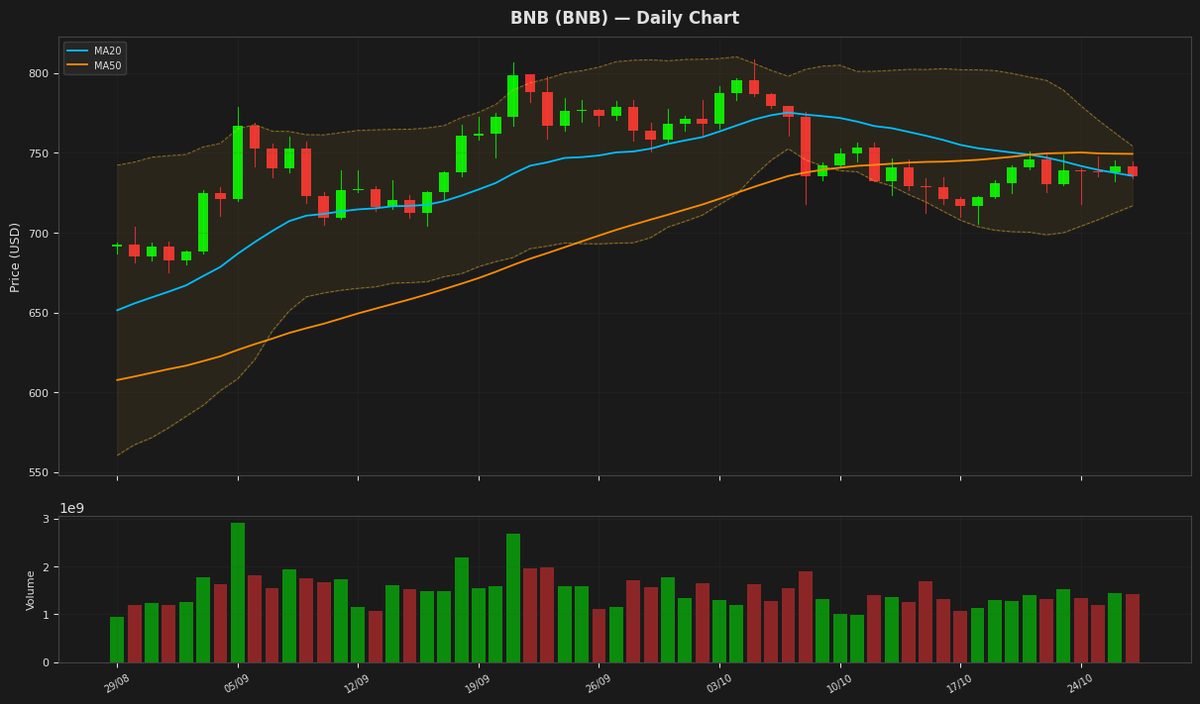
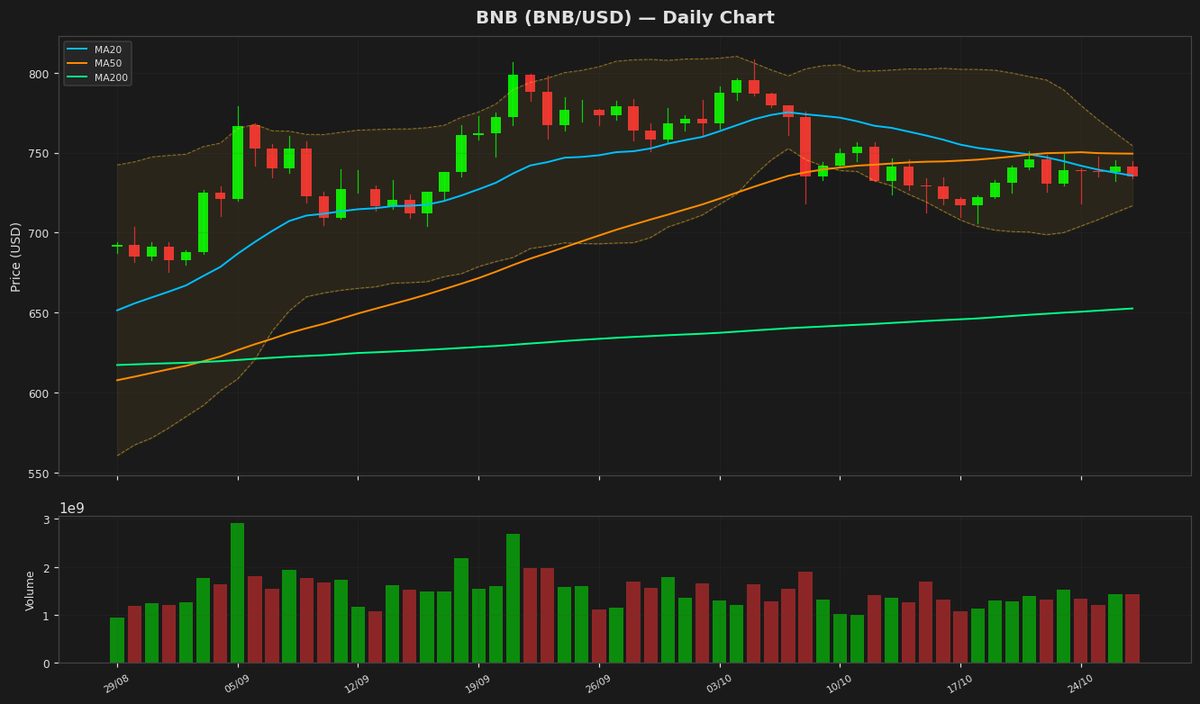
BNB is currently trading at $735.06, near its 20-day moving average of $735.59, indicating a lack of clear direction. The Relative Strength Index (RSI) at 46.58 suggests a neutral stance, while the MACD below its signal line indicates a bearish signal. The price is also within the Bollinger Bands, with the upper and lower bands at $754.35 and $716.82 respectively, indicating moderate volatility.
Tron (TRX) — -0.62%
$0.326898 52W: $0.278283 — $0.376332
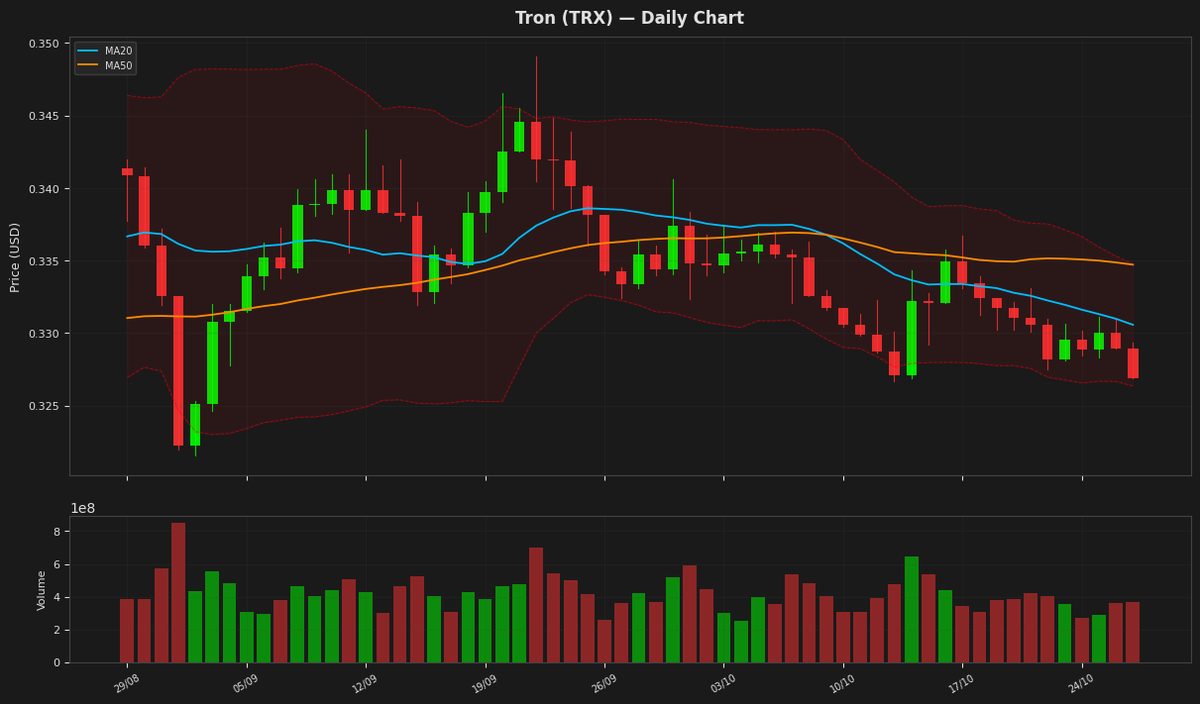
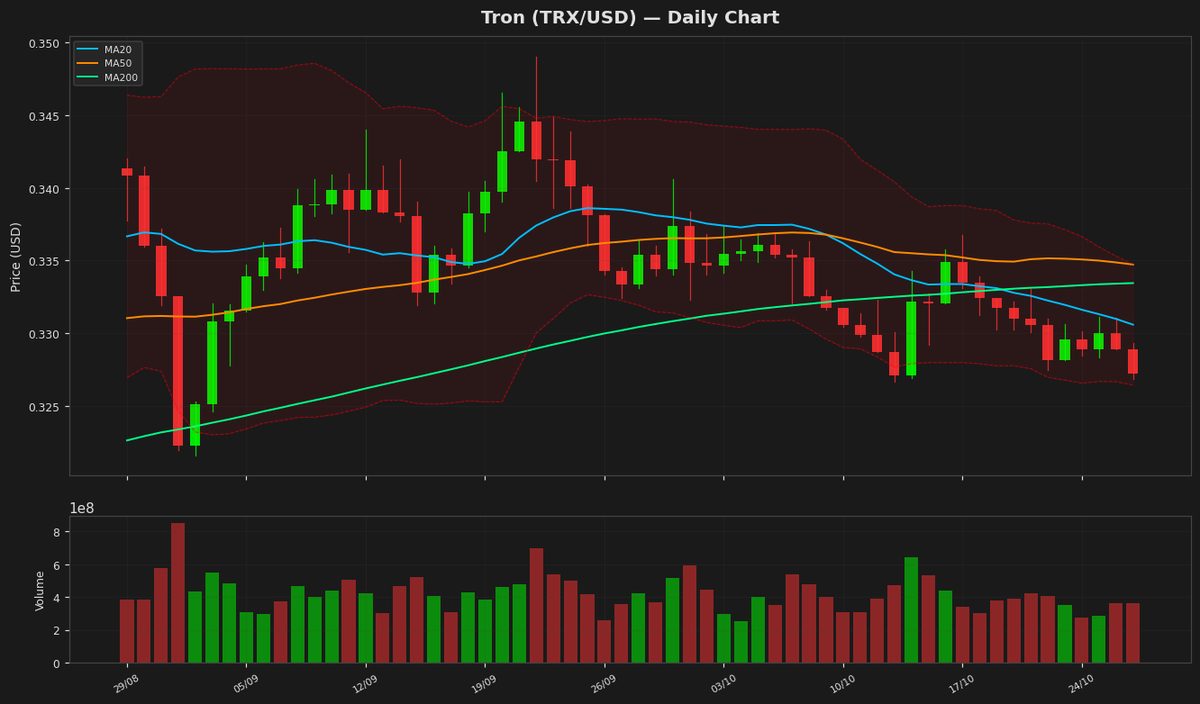
Tron's price is currently at $0.326898, showing a minor decline of 0.62% and hovering near the lower Bollinger Band at $0.326358, indicating potential support. The RSI is at 49.513675, suggesting a neutral stance, while the MACD is slightly below its signal line, indicating a bearish signal. The ATR is relatively low at 0.003076, indicating low volatility.
Dogecoin (DOGE) — -0.81%
$0.076970 52W: $0.067973 — $0.118255
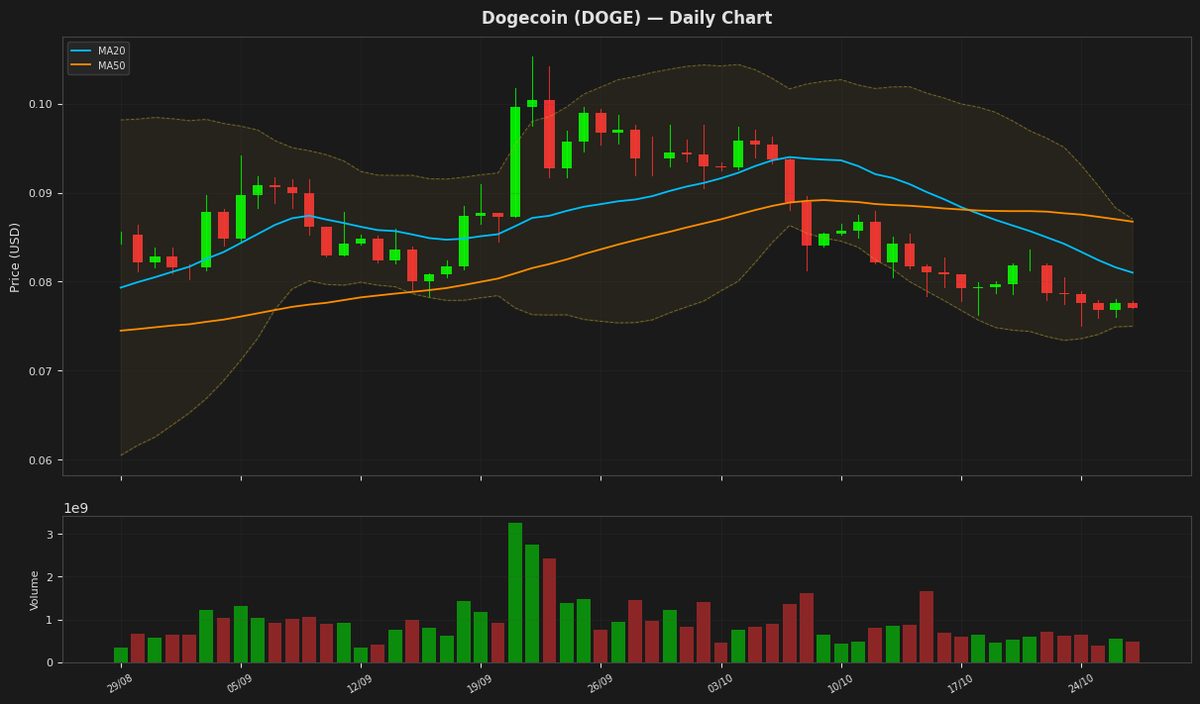
Dogecoin's price is currently at $0.076970, showing a decline and sitting near the lower Bollinger Band at 0.074966, indicating potential oversold conditions as supported by the RSI(14) value of 24.096811. The MACD is below its signal line, suggesting a bearish trend. The price is also below both the MA20 and MA50, further indicating a downtrend.
Disclaimer
The content on MarketsFN.com is provided for educational and informational purposes only. It does not constitute financial advice or investment recommendations. All investments involve risk. Past performance does not guarantee future results.