Tron Holds Steady at $0.3272 Amid Neutral RSI Signals
QuoteReporter
•2 min read
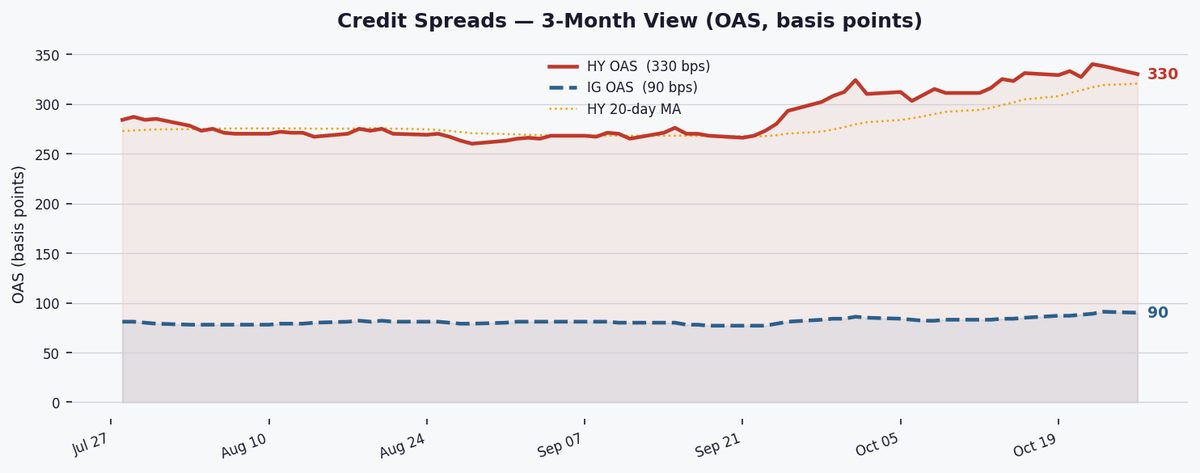
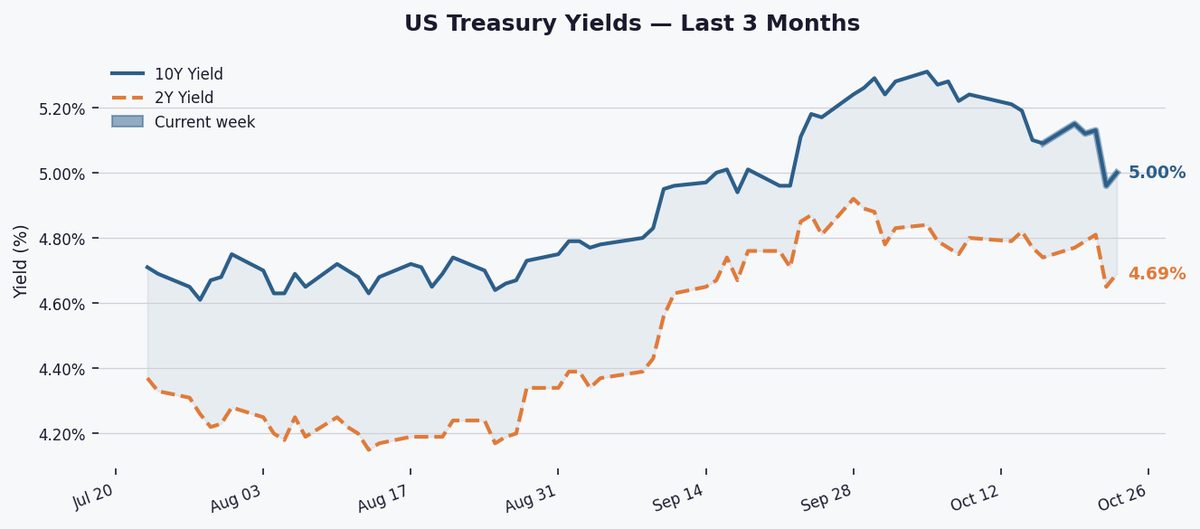
With the 10-year Treasury yield holding near 5% and the S&P 500 rallying to fresh highs, Tron's muted price action reflects a crypto market cautiously weighing macro risks against speculative appetite. The neutral RSI reading at $0.3272 suggests TRX traders are awaiting clearer signals from both Fed policy and broader risk asset trends before committing to directional bets.
Tron Holds Steady at $0.3272 Amid Neutral RSI Signals
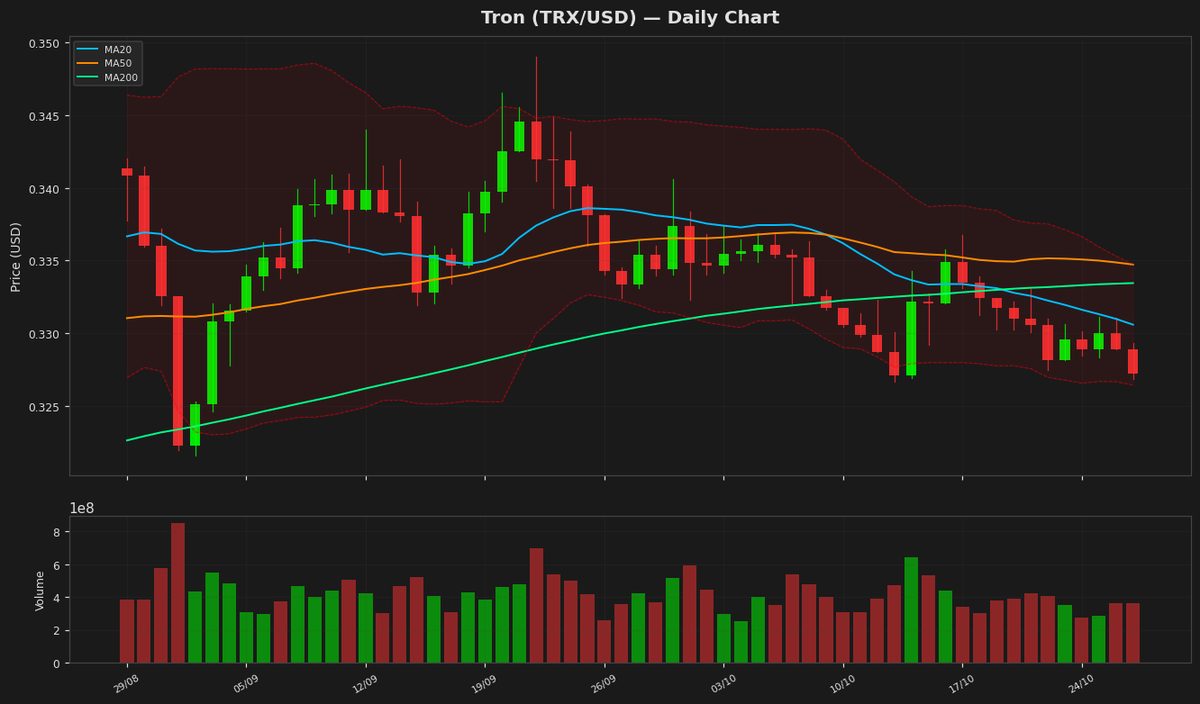
Tron (TRX/USD) | October 27, 2026 $0.3272 -0.51%
🔍 Technical Analysis
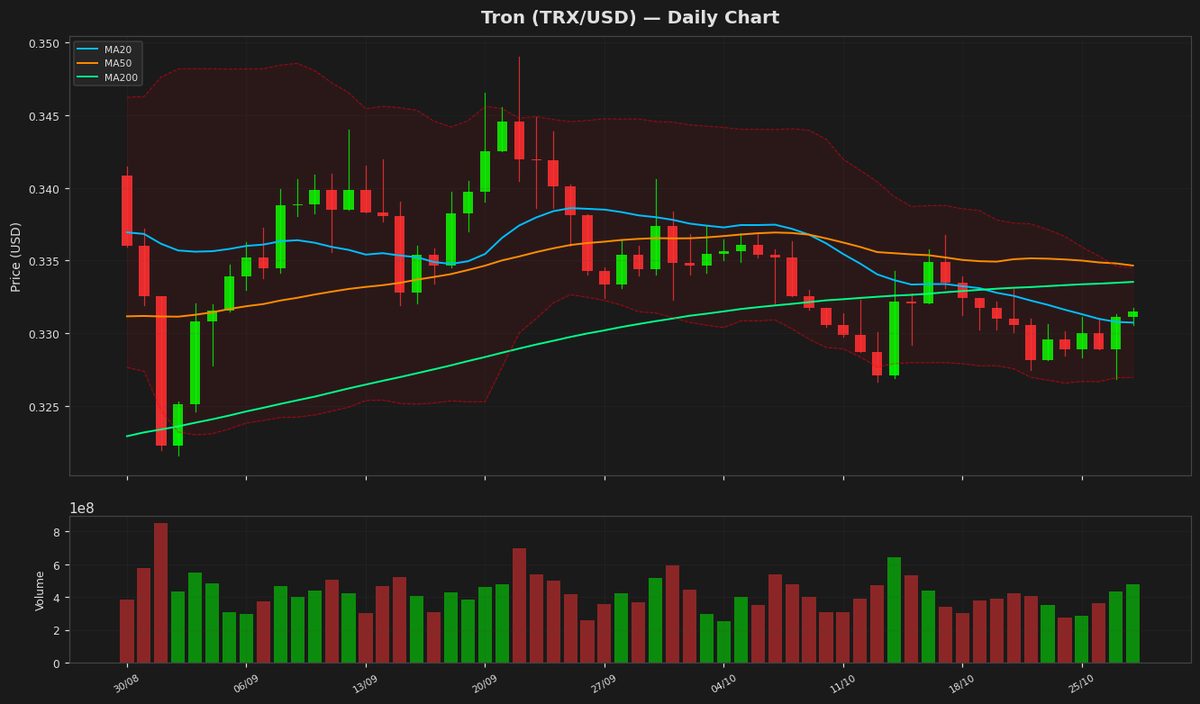
Tron (TRX) is currently trading at $0.327237, showing a minor daily decline of 0.51%. The price is hovering near the middle Bollinger Band, with the upper band at $0.334743 and the lower band at $0.326436, indicating a period of consolidation. The Moving Averages present a mixed signal: the 20-day MA at $0.330589 and the 50-day MA at $0.334726 suggest short-term resistance, while the 200-day MA at $0.33345 reinforces this zone as a critical level to watch. The RSI at 50.32 reflects a neutral momentum, neither overbought nor oversold, suggesting a potential for either direction. The MACD histogram shows a slight bearish crossover, with the MACD line at -0.001615 below the signal line at -0.00142, though the divergence is minimal. Key support levels are found at the yearly low of $0.26813799 and the recent lower Bollinger Band at $0.326436. Resistance is marked by the 52-week high of $0.37633201 and the upper Bollinger Band. The ATR of 0.003078 indicates low volatility, reinforcing the consolidation phase. A break above the 20-day MA could signal bullish momentum, while a drop below the lower Bollinger Band may test the $0.31 support. Traders should monitor these levels closely for confirmation of the next directional move.
Technical Metrics
| Metric | Value |
|---|---|
| Current Price | $0.3272 |
| Daily Change | -0.51% |
| MA 20 | $0.3306 |
| % from MA20 | -1.01% |
| MA 50 | $0.3347 |
| % from MA50 | -2.24% |
| MA 200 | $0.3335 |
| % from MA200 | -1.86% |
| BB Upper | $0.3347 |
| % from BB Upper | -2.24% |
| BB Lower | $0.3264 |
| % from BB Lower | +0.25% |
| RSI (14) | 50.32 |
| MACD | -0.001615 |
| MACD Signal | -0.001420 |
| ATR (14) | 0.003078 |
| 3-Day High | $0.3311 |
| 3-Day Low | $0.3269 |
| 52-Week High | $0.3763 |
| % from 52W High | -13.05% |
| 52-Week Low | $0.2783 |
| % from 52W Low | +17.59% |
| YTD High | $0.3763 |
| % from YTD High | -13.05% |
| YTD Low | $0.2681 |
| % from YTD Low | +22.04% |
📊 Market Commentary
Tron (TRX) is currently trading at $0.3272, down 0.51% today, as the broader cryptocurrency market shows mixed signals. The Relative Strength Index (RSI) at 50.3 indicates a neutral momentum, neither overbought nor oversold, suggesting a balanced tug-of-war between buyers and sellers. TRX remains within its 52-week range of $0.2783 to $0.3763, reflecting a stable but consolidative phase.
Market sentiment around TRX appears cautiously optimistic, supported by steady network activity and adoption in decentralized applications (dApps) and stablecoin transactions. However, the lack of strong bullish momentum suggests traders remain hesitant amid broader macroeconomic uncertainties. Key resistance levels to watch include the upper 52-week high of $0.3763, while support lies near the yearly low of $0.2783. A sustained break above or below these levels could dictate the next directional move.
Traders are closely monitoring TRX’s on-chain metrics, including transaction volume and active addresses, for signs of renewed demand. Additionally, developments in Tron’s ecosystem, such as partnerships or protocol upgrades, could influence sentiment. For now, TRX appears to be in a consolidation phase, with the RSI neutrality suggesting a wait-and-see approach among market participants. The price action near the mid-range indicates potential for volatility if either support or resistance is tested decisively.
Disclaimer
The content on MarketsFN.com is provided for educational and informational purposes only. It does not constitute financial advice or investment recommendations. All investments involve risk. Cryptocurrency markets are highly volatile. Past performance does not guarantee future results.