Crypto Market Slumps: Dogecoin, BNB, and Ripple Lead Today's Losses
QuoteReporter
•5 min read
Crypto Market Slumps: Dogecoin, BNB, and Ripple Lead Today's Losses
Crypto Market Report | September 16, 2026
📊 Crypto Market Overview
The cryptocurrency market is currently experiencing a relatively stable trading session, with most major assets exhibiting minor price fluctuations. Bitcoin, the largest cryptocurrency by market capitalization, is trading at $75,375.15, down 0.31% on the day, while Ethereum is at $2,387.42, a decrease of 0.49%. Other prominent cryptocurrencies such as Ripple, Solana, and BNB are also seeing slight declines, with losses ranging from 0.36% to 1.08%. Conversely, Tron is bucking the trend with a 0.64% gain.
From a technical perspective, the Relative Strength Index (RSI) values for the major cryptocurrencies are generally hovering in the neutral to slightly oversold territory, with Bitcoin and Ripple both at 43.7, and Ethereum at 49.7. The Moving Average Convergence Divergence (MACD) indicators are mostly positive, suggesting that the longer-term trends remain intact.
The macroeconomic context is influencing the crypto market, with the recent failure of the CLARITY Act to advance in the Senate contributing to a decline in crypto stocks. Additionally, Bitcoin ETFs experienced their largest outflow since June, shedding $450 million. The industry is also turning its attention to US regulators following this setback. Other news includes the US charging former Robinhood engineers over alleged pre-listing crypto trades and a Bank for International Settlements (BIS) paper highlighting a significant gap in Bitcoin on-chain transfer estimates. Overall, market sentiment remains cautious, with traders and investors closely monitoring regulatory developments and macroeconomic trends. The technical signals suggest a continuation of the current consolidation phase, with no clear indication of a significant trend reversal in the immediate future.
From a technical perspective, the Relative Strength Index (RSI) values for the major cryptocurrencies are generally hovering in the neutral to slightly oversold territory, with Bitcoin and Ripple both at 43.7, and Ethereum at 49.7. The Moving Average Convergence Divergence (MACD) indicators are mostly positive, suggesting that the longer-term trends remain intact.
The macroeconomic context is influencing the crypto market, with the recent failure of the CLARITY Act to advance in the Senate contributing to a decline in crypto stocks. Additionally, Bitcoin ETFs experienced their largest outflow since June, shedding $450 million. The industry is also turning its attention to US regulators following this setback. Other news includes the US charging former Robinhood engineers over alleged pre-listing crypto trades and a Bank for International Settlements (BIS) paper highlighting a significant gap in Bitcoin on-chain transfer estimates. Overall, market sentiment remains cautious, with traders and investors closely monitoring regulatory developments and macroeconomic trends. The technical signals suggest a continuation of the current consolidation phase, with no clear indication of a significant trend reversal in the immediate future.
📰 Crypto News
- AI has been a ‘net negative’ for crypto: Phemex CEO
- Here’s what happened in crypto today
- US charges ex-Robinhood engineers over alleged pre-listing crypto trades
- Bitcoin ETFs shed $450M in biggest outflow since June
- Crypto industry turns to US regulators after CLARITY setback
- BIS paper finds major gap in Bitcoin onchain transfer estimates
- Crypto stocks slide after CLARITY Act fails to advance in Senate
- Ethereum, Base give up on common wallet standard after months of talks
- Fed meeting is shaping up to be a nightmare for Warsh. Bitcoin might still shine
- Zcash holders overwhelmingly back faster transactions and bitcoin-style halvings
- Crypto longs worth $570 million wiped out as Clarity Act fails
- XRP sinks 10% as the Clarity Act fails and bitcoin slides toward $76,000
- Inside the last-minute political breakdown that doomed the Clarity Act vote
- Crypto Exchange CoinEx Is Shutting Down After Nine Years, Giving Users Until December to Cash Out
- Wall Street Bets on Fed Rate Hike: Here's What It Means for Bitcoin, Bonds and Trump
🔍 Technical Analysis
Bitcoin (BTC) — -0.31%
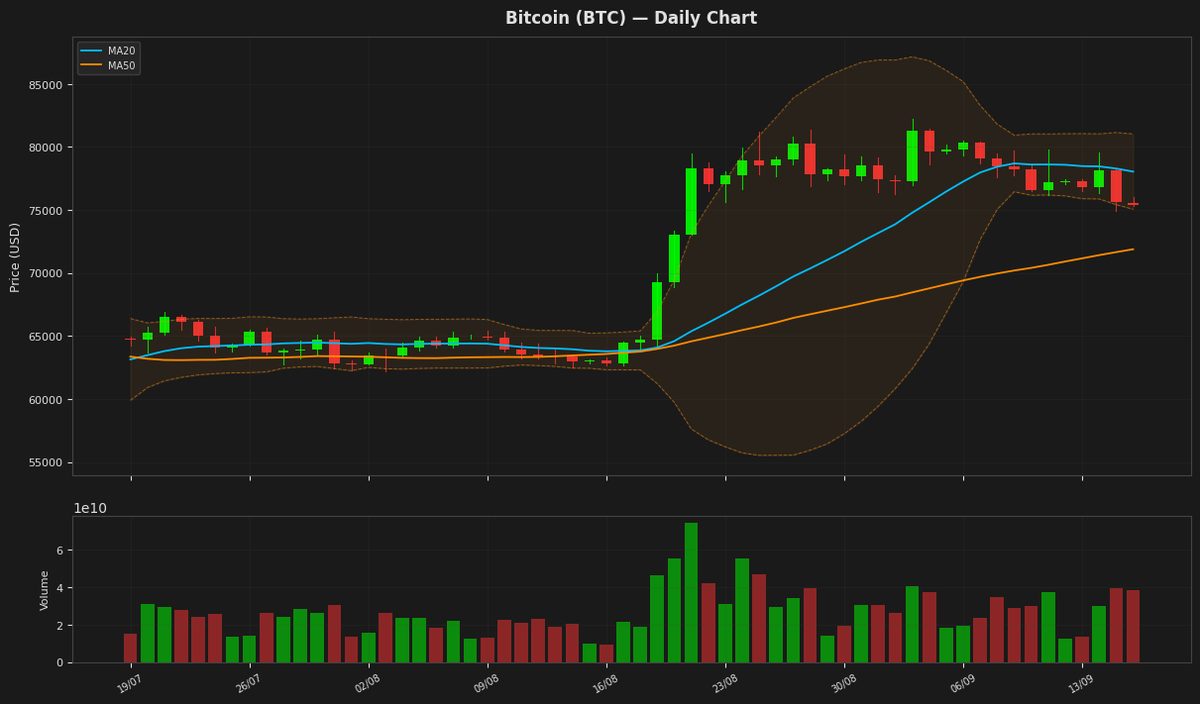
$75,375.15 52W: $57,747.77 — $97,860.60
Bitcoin's price is currently at $75,375, showing a minor decline of 0.31% and hovering near the lower Bollinger Band at $75,059, indicating potential support. The RSI is at 43.7, suggesting a neutral to slightly oversold condition. The MACD is below its signal line, indicating a bearish signal. The price is also below the MA20, further indicating a short-term downtrend.
Ethereum (ETH) — -0.49%
$2,387.42 52W: $1,506.51 — $3,397.90
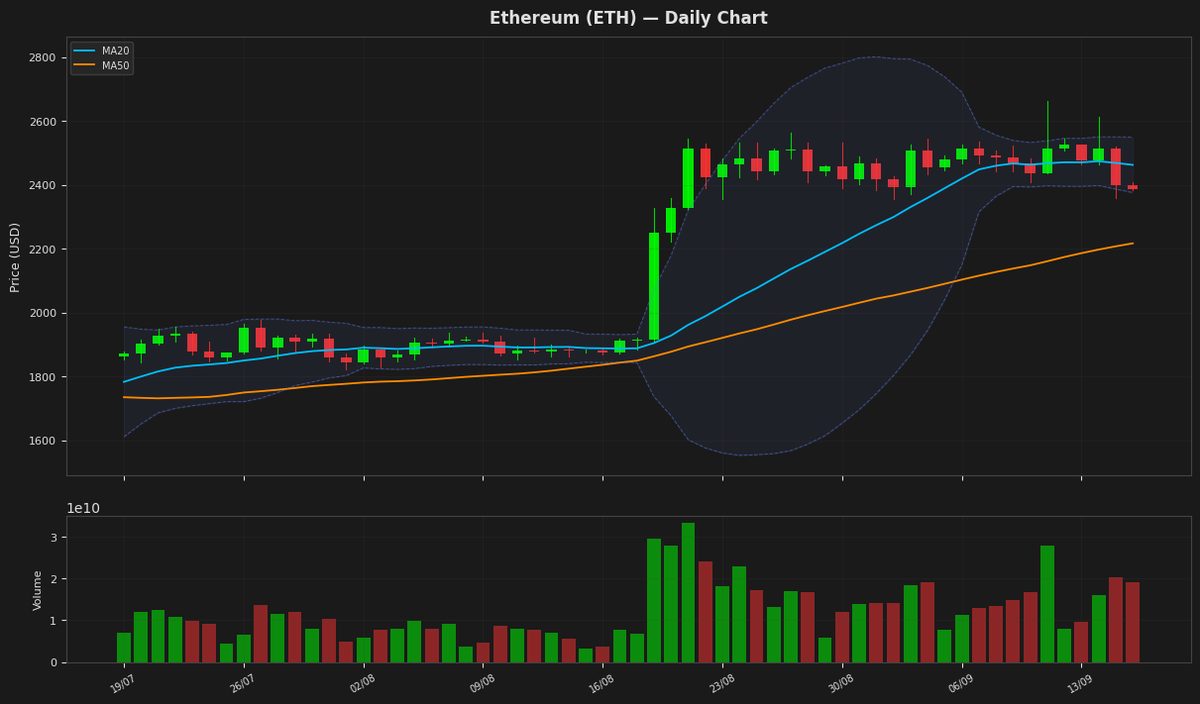
Ethereum's price is currently at $2,387.42, showing a minor decline of 0.49% and hovering near the middle of the Bollinger Bands, indicating a lack of clear direction. The RSI is at 49.66, suggesting a neutral stance, while the MACD is below its signal line, indicating a potential bearish trend. The price is between the MA20 and MA50, indicating a possible consolidation phase. The ATR suggests moderate volatility.
Ripple (XRP) — -0.65%
$1.2763 52W: $0.988422 — $2.1864
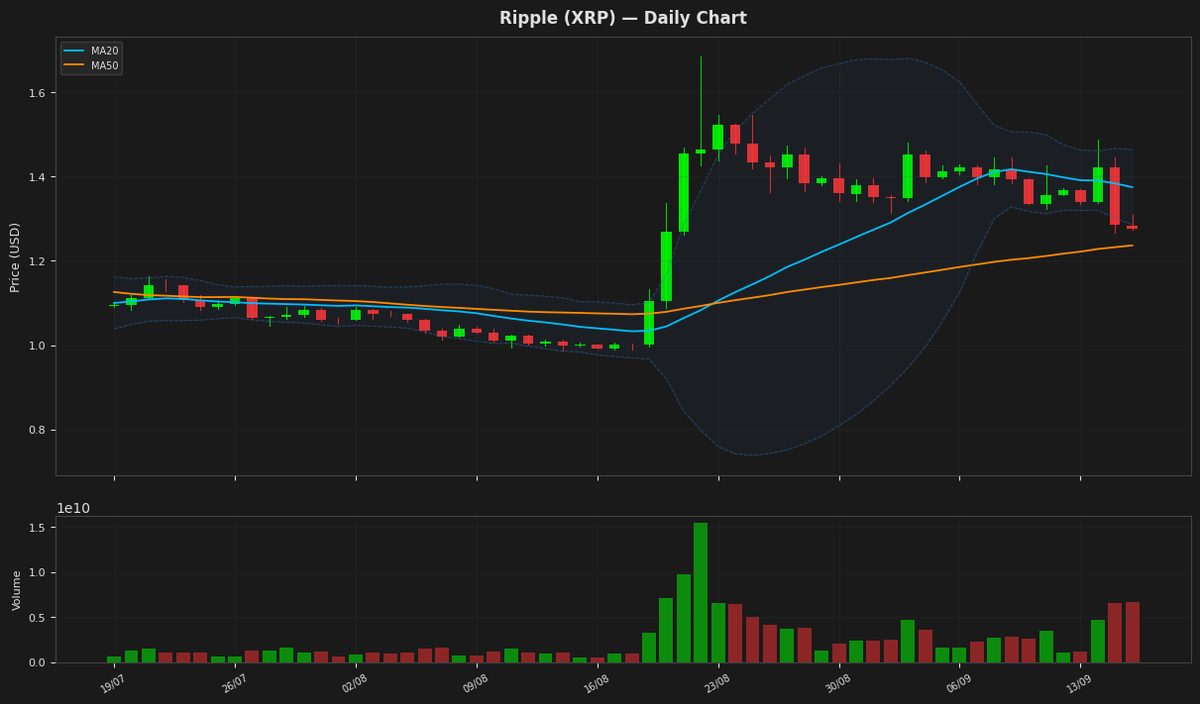
Ripple's price is currently at $1.276300, showing a decline of 0.65% for the day, and is positioned near the lower Bollinger Band at 1.285454, indicating potential support. The RSI at 43.711665 suggests that the asset is nearing oversold territory, while the MACD below its signal line indicates a bearish trend. The Average True Range of 0.072614 implies moderate volatility.
Solana (SOL) — -0.36%
$96.5400 52W: $60.4147 — $148.2160
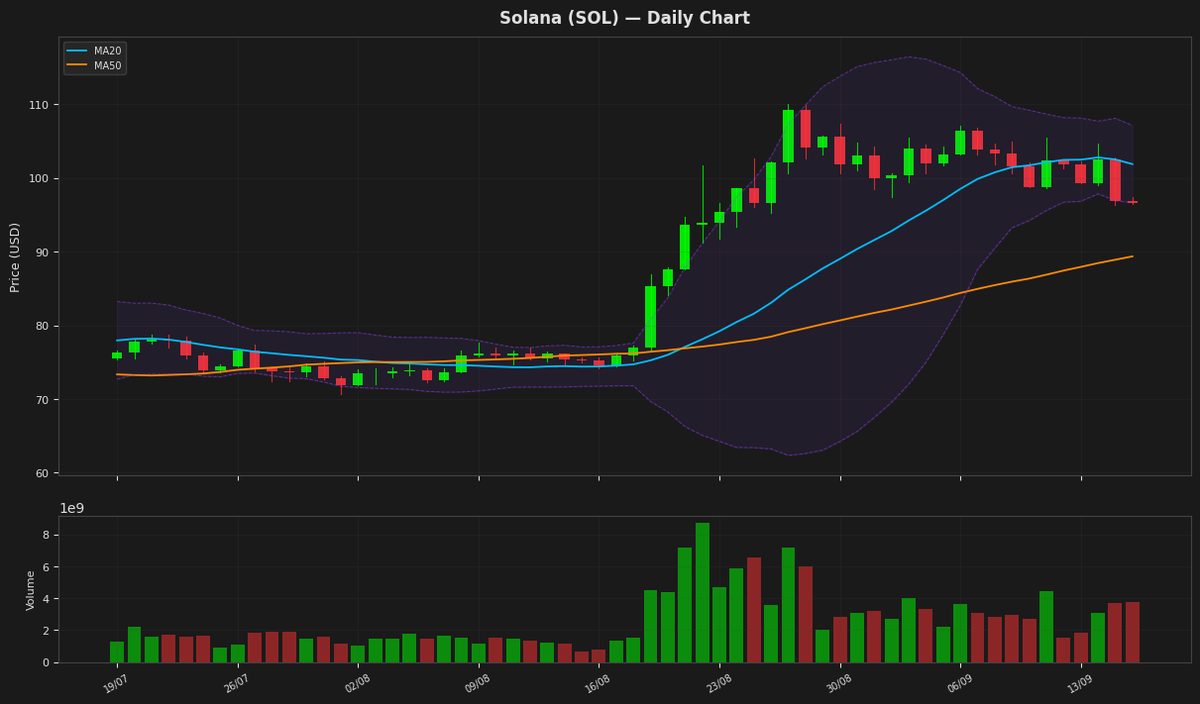
Solana's price is currently at $96.54, near the lower Bollinger Band at $96.63, indicating potential support. The RSI at 44.33 suggests a neutral to slightly oversold condition, while the MACD being below its signal line indicates a bearish signal. The price is also below the MA20, further indicating a short-term downtrend.
BNB (BNB) — -1.08%
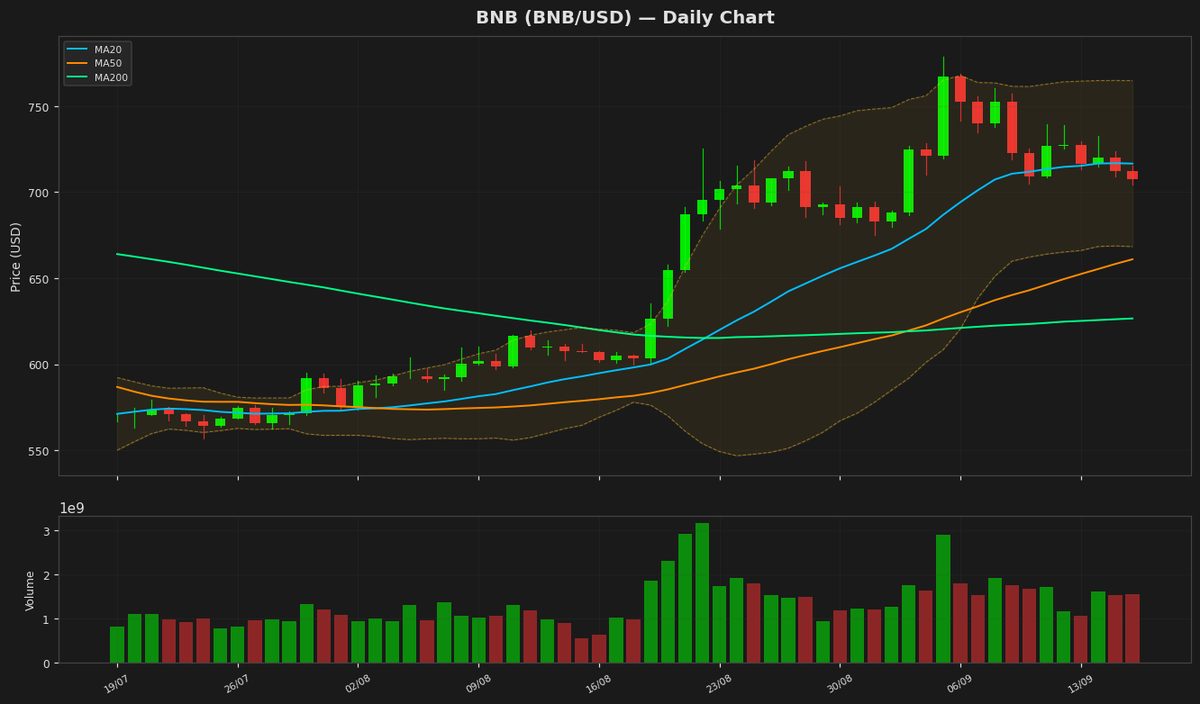
$704.4600 52W: $538.5992 — $954.8583
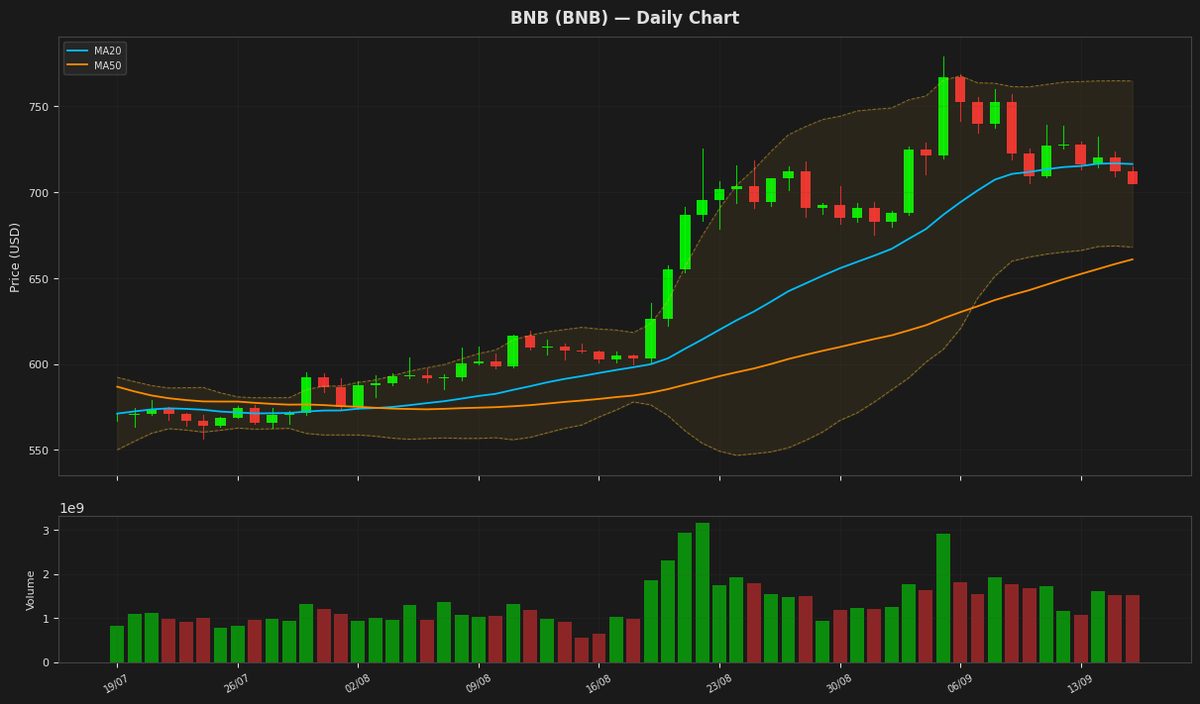
BNB is currently trading at $704.46, slightly below its 20-day moving average of $716.39, indicating a potential lack of upward momentum. The Relative Strength Index (RSI) at 53.78 suggests a neutral market sentiment, while the MACD line being below the signal line indicates a bearish signal. The price is also within the Bollinger Bands, with the upper and lower bands at $764.73 and $668.05 respectively, indicating a relatively stable price range.
Tron (TRX) — +0.64%
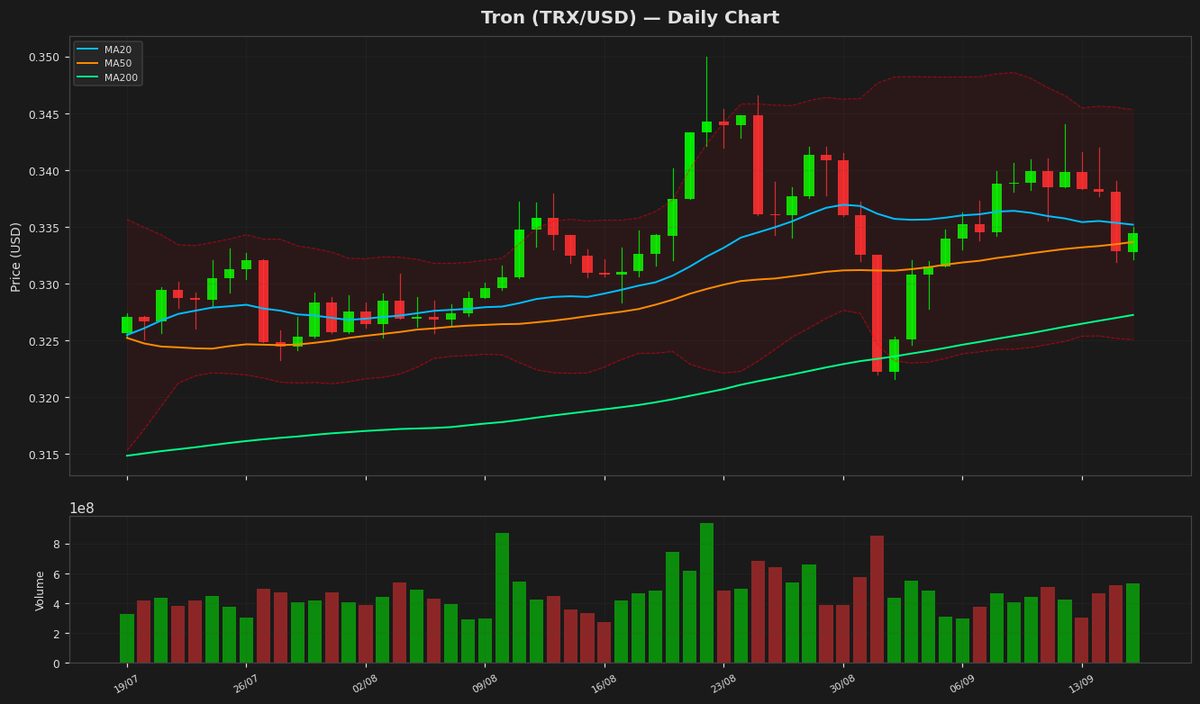
$0.334940 52W: $0.268138 — $0.376332
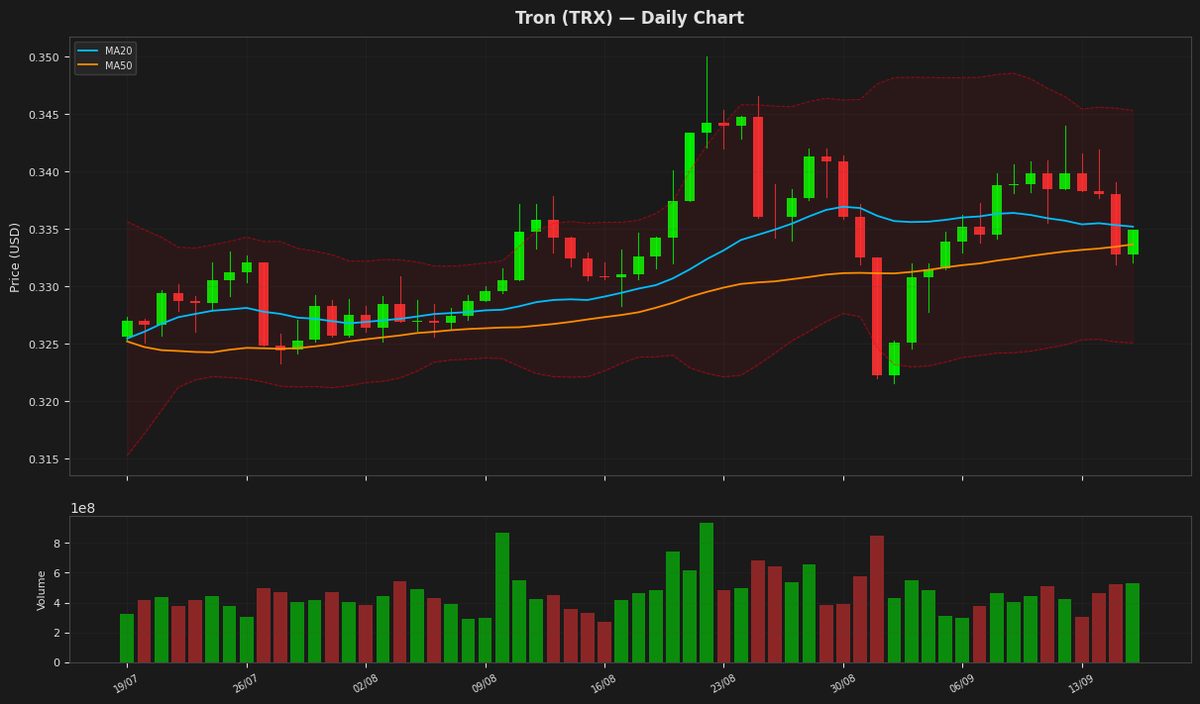
Tron's price is currently at $0.334940, showing a slight increase of 0.64% and is trading near its 20-day moving average of 0.335209. The Relative Strength Index (RSI) at 67.458781 indicates that TRX is approaching overbought territory. The MACD is below its signal line, suggesting a potential bearish crossover. The price is also near the upper Bollinger Band at 0.345325, indicating potential resistance.
Dogecoin (DOGE) — -1.17%
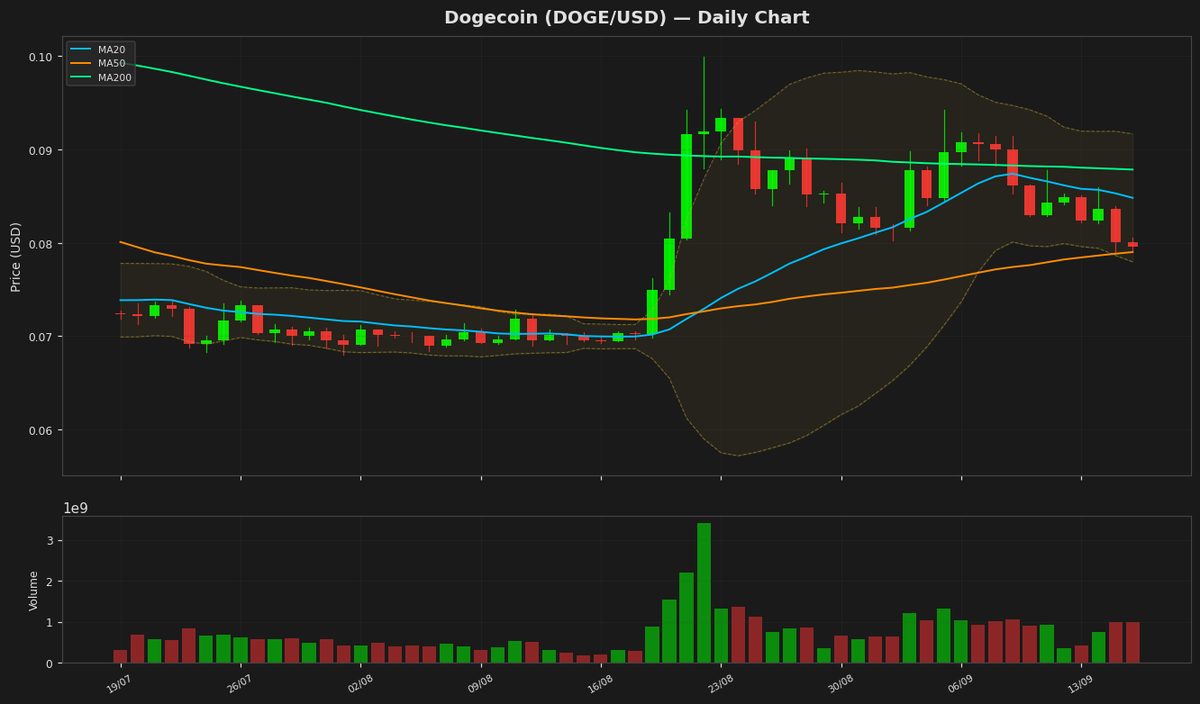
$0.079140 52W: $0.067973 — $0.151069
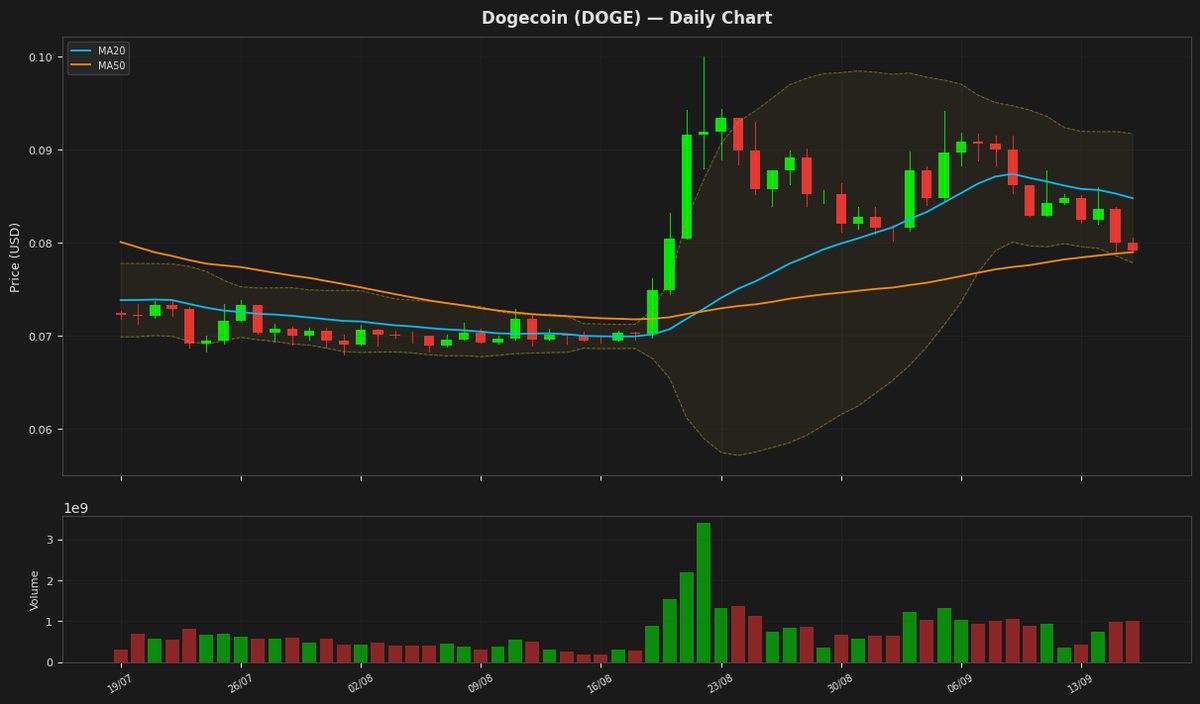
Dogecoin's price is currently at $0.079140, showing a decline of 1.17% for the day, and is positioned near the lower Bollinger Band at 0.077858, indicating potential support. The RSI is at 46.228928, suggesting a neutral stance with a slight bias towards oversold conditions. The MACD is below its signal line, indicating a bearish signal, while the ATR suggests moderate volatility.
Disclaimer
The content on MarketsFN.com is provided for educational and informational purposes only. It does not constitute financial advice or investment recommendations. All investments involve risk. Past performance does not guarantee future results.