Bitcoin Holds Steady at $75.7K as RSI Nears Oversold Territory
QuoteReporter
•2 min read
Bitcoin Holds Steady at $75.7K as RSI Nears Oversold Territory
Bitcoin (BTC/USD) | September 16, 2026 $75,667.9297 +0.07%
🔍 Technical Analysis
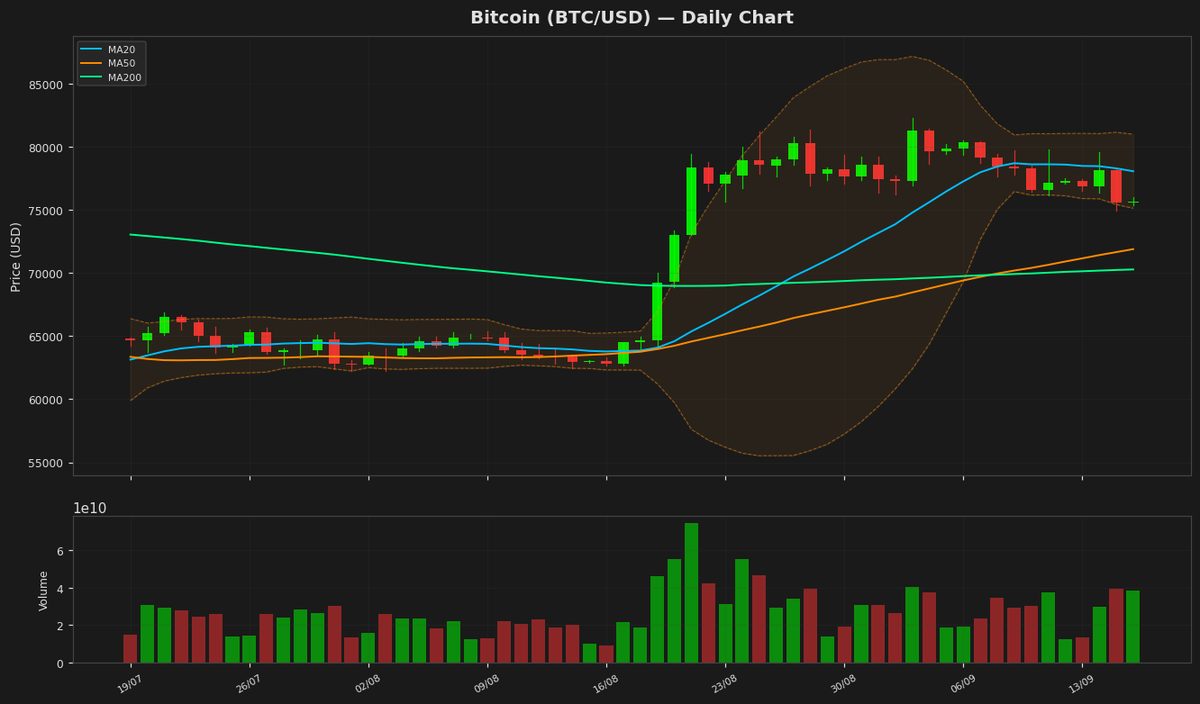
Bitcoin is currently trading at $75,667, showing minimal daily movement with a slight gain of 0.07%. The price is below the 20-day moving average (MA20) at $78,061, indicating short-term bearish pressure, but remains above the 50-day (MA50 at $71,890) and 200-day (MA200 at $70,281) moving averages, suggesting the broader trend remains bullish. The Bollinger Bands show the upper band at $80,996 and the lower band at $75,127, with the price hovering near the lower band, signaling potential oversold conditions. The RSI at 44.59 is neutral, neither overbought nor oversold, but leaning toward weakening momentum. The MACD at 985.15 is below the signal line at 1,800.49, indicating bearish divergence in the short term. Key support levels to watch are $75,127 (Bollinger Lower Band) and $71,890 (MA50), while resistance lies at $78,061 (MA20) and $80,996 (Bollinger Upper Band). The ATR of 2,129 suggests moderate volatility. Bitcoin remains well above its 52-week low of $57,747 but has retreated from its yearly high of $97,860, reflecting a consolidation phase. Traders should monitor these levels for potential breakout or breakdown signals.
Technical Metrics
| Metric | Value |
|---|---|
| Current Price | $75,667.9297 |
| Daily Change | +0.07% |
| MA 20 | $78,061.1176 |
| % from MA20 | -3.07% |
| MA 50 | $71,889.6191 |
| % from MA50 | +5.26% |
| MA 200 | $70,281.0862 |
| % from MA200 | +7.66% |
| BB Upper | $80,995.6731 |
| % from BB Upper | -6.58% |
| BB Lower | $75,126.5620 |
| % from BB Lower | +0.72% |
| RSI (14) | 44.59 |
| MACD | 985.147322 |
| MACD Signal | 1800.489781 |
| ATR (14) | 2129.033482 |
| 3-Day High | $79,568.9531 |
| 3-Day Low | $74,944.5938 |
| 52-Week High | $97,860.6016 |
| % from 52W High | -22.68% |
| 52-Week Low | $57,747.7656 |
| % from 52W Low | +31.03% |
| YTD High | $97,860.6016 |
| % from YTD High | -22.68% |
| YTD Low | $57,747.7656 |
| % from YTD Low | +31.03% |
📊 Market Commentary
Bitcoin (BTC) is currently trading at $75,667.9297, showing minimal movement with a slight gain of 0.07% today. The Relative Strength Index (RSI) sits at 44.6, indicating a neutral position, neither overbought nor oversold, suggesting a balanced market sentiment. Over the past 52 weeks, Bitcoin has fluctuated between $57,747.7656 and $97,860.6016, reflecting significant volatility but maintaining a strong baseline above $57K.
Market sentiment appears cautious as traders assess macroeconomic factors, including potential Federal Reserve policy shifts and broader risk asset performance. The lack of strong directional momentum in BTC’s price suggests consolidation, with participants waiting for clearer signals. Key resistance levels to watch include the psychological $80K mark, followed by the yearly high near $97.8K. On the downside, support is seen around $70K, with stronger buying interest likely near the $65K–$60K zone, aligning with the lower end of the 52-week range.
Traders are closely monitoring trading volume and institutional flows, particularly from ETFs, which have been a significant driver of liquidity this year. Additionally, Bitcoin’s correlation with traditional markets, especially tech stocks, remains a point of focus. While the RSI suggests room for upward movement, the absence of strong bullish catalysts keeps the market in a wait-and-see mode. For now, BTC’s price action remains range-bound, with breakout potential dependent on broader market catalysts.
Market sentiment appears cautious as traders assess macroeconomic factors, including potential Federal Reserve policy shifts and broader risk asset performance. The lack of strong directional momentum in BTC’s price suggests consolidation, with participants waiting for clearer signals. Key resistance levels to watch include the psychological $80K mark, followed by the yearly high near $97.8K. On the downside, support is seen around $70K, with stronger buying interest likely near the $65K–$60K zone, aligning with the lower end of the 52-week range.
Traders are closely monitoring trading volume and institutional flows, particularly from ETFs, which have been a significant driver of liquidity this year. Additionally, Bitcoin’s correlation with traditional markets, especially tech stocks, remains a point of focus. While the RSI suggests room for upward movement, the absence of strong bullish catalysts keeps the market in a wait-and-see mode. For now, BTC’s price action remains range-bound, with breakout potential dependent on broader market catalysts.
Disclaimer
The content on MarketsFN.com is provided for educational and informational purposes only. It does not constitute financial advice or investment recommendations. All investments involve risk. Cryptocurrency markets are highly volatile. Past performance does not guarantee future results.