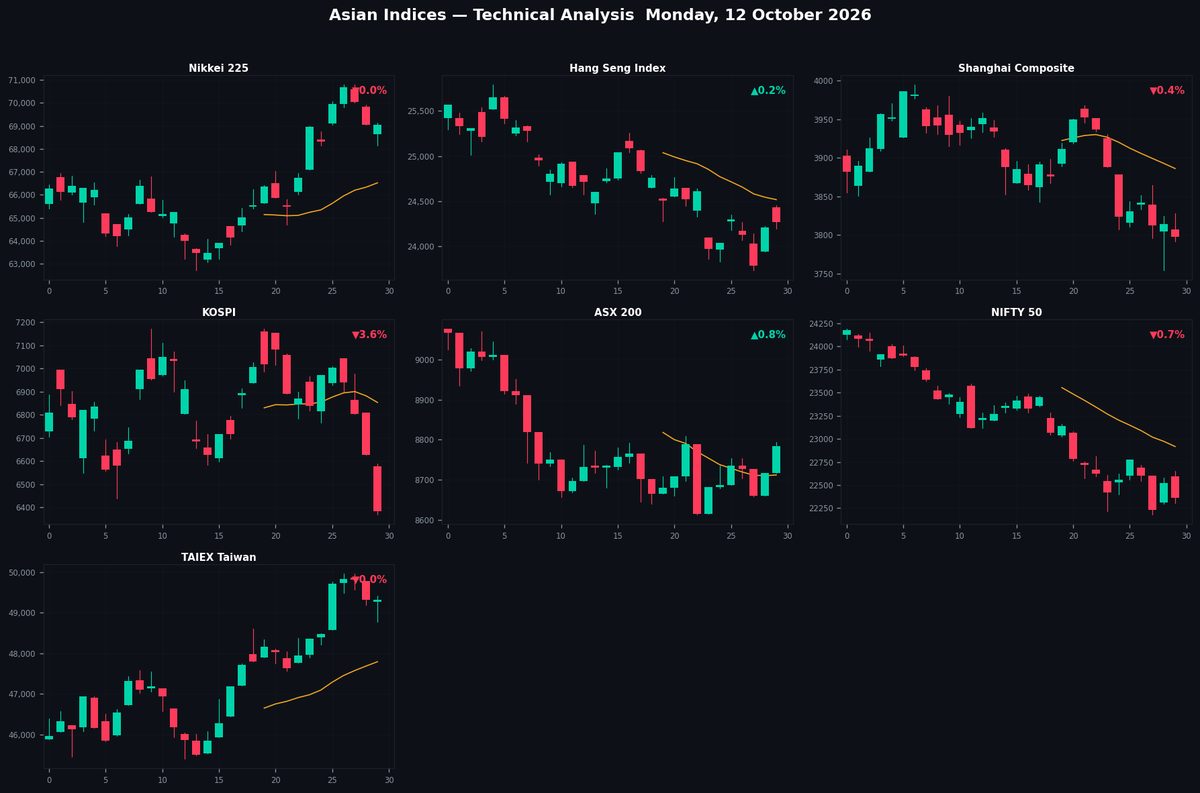
Technical analysis update for the seven major Asian equity indices on Monday, 12 October 2026.
Charts cover 65 sessions (daily bars) with SMA-20, SMA-50, Bollinger Bands (20,2),
dynamic support/resistance trendlines (20-day and 50-day), and pivot-cluster S/R levels.
Covering Nikkei 225, Hang Seng Index, Shanghai Composite, KOSPI, ASX 200,
NIFTY 50, and TAIEX Taiwan.
| Code |
Index |
Last |
Chg% |
RSI |
52W H |
52W L |
| NIKKEI | Nikkei 225 | 69,031 | ▼0.02% | 66.1 | 72,832 | 44,358 |
| HSI | Hang Seng Index | 24,271 | ▲0.25% | 36.7 | 28,056 | 22,518 |
| SHANGHAI | Shanghai Composite | 3,797.24 | ▼0.43% | 36.9 | 4,258.86 | 3,741.11 |
| KOSPI | KOSPI | 6,384.24 | ▼3.65% | 45.0 | 9,385.59 | 3,365.73 |
| ASX200 | ASX 200 | 8,783.20 | ▲0.76% | 37.3 | 9,296.70 | 8,262.40 |
| NIFTY50 | NIFTY 50 | 22,363.35 | ▼0.70% | 44.4 | 26,373.20 | 22,179.90 |
| TAIEX | TAIEX Taiwan | 49,302 | ▼0.02% | 68.3 | 49,969 | 25,469 |
NIKKEI
Nikkei 225
69,031
▼0.02%
RSI 66

Double Top — Bearish 50%Double Bottom — Bullish 52%Flag — Bullish 67%
20d: Sup ascending 66,955 (-3.0%) Res ascending 71,778 (+4.0%)
50d: Sup ascending 63,897 (-7.4%) Res ascending 70,904 (+2.7%)
S/R Levels
| R1 | 69,608 | +0.8% | ★★★★★ |
| R2 | 72,832 | +5.5% | ★★★★☆ |
|
69,031
52W 44,358–72,832
|
| S1 | 62,589 | -9.3% | ★★★★★ |
| S2 | 50,482 | -26.9% | ★★★★☆ |
| S3 | 48,651 | -29.5% | ★★★☆☆ |
Moving Averages
| SMA 20 | 66,524 | above +3.8% |
| SMA 50 | 65,990 | above +4.6% |
| SMA 200 | 60,791 | above +13.6% |
Price above SMA20 & SMA50 — bullish structure
Price above SMA200 (+13.6%) — long-term uptrend
Analysis
The Nikkei 225 trades flat at 69,031 (-0.02%), hovering near resistance at R1 (69,608) as the RSI-14 at 66 suggests mild overbought conditions. The index remains above key SMAs (20d: 66,524; 50d: 65,990; 200d: 60,791), confirming a broader uptrend, though three unconfirmed double top patterns (50% confidence) signal potential bearish reversal risks. Immediate ascending trendline support sits at 66,955 (20d), while resistance trends upward at 71,778. A break below SMA20 could test S1 (62,589), but sustained momentum above 69,608 may target R2 (72,832). The mixed technical signals warrant caution despite the prevailing bullish structure.
HSI
Hang Seng Index
24,271
▲0.25%
RSI 37

Double Top — Bearish 88%Double Bottom — Bullish 50%Flag — Bullish 82%
20d: Sup descending 23,575 (-2.9%) Res descending 24,456 (+0.8%)
50d: Sup descending 23,656 (-2.5%) Res descending 24,828 (+2.3%)
S/R Levels
| R1 | 26,003 | +7.1% | ★★★★★ |
| R2 | 26,758 | +10.2% | ★★★★☆ |
| R3 | 27,294 | +12.5% | ★★★☆☆ |
|
24,271
52W 22,518–28,056
|
| S1 | 24,102 | -0.7% | ★★★★★ |
| S2 | 22,518 | -7.2% | ★★★★☆ |
Moving Averages
| SMA 20 | 24,518 | below -1.0% |
| SMA 50 | 25,114 | below -3.4% |
| SMA 200 | 25,502 | below -4.8% |
Price below SMA20 & SMA50 — bearish structure
Price below SMA200 (-4.8%) — long-term downtrend
Analysis
The Hang Seng Index trades at 24,271, up 0.25%, but remains below key SMAs (20d: 24,518; 50d: 25,114; 200d: 25,502), signaling bearish pressure. The RSI-14 at 37 suggests mild oversold conditions but lacks strong reversal momentum. Three bearish Double Top patterns (50-88% confidence) reinforce downside risks, with immediate resistance at 24,456 (20d descending trendline) and support at 24,102. The index faces layered resistance up to 26,758, while a break below 24,102 could test 23,575 (20d descending support). The broader downtrend persists, with sustained moves above SMA20 needed to shift near-term sentiment. Caution prevails given the confluence of technical bearish signals.
SHANGHAI
Shanghai Composite
3,797.24
▼0.43%
RSI 37

Double Top — Bearish 92%Double Bottom — Bullish 50%
20d: Sup descending 3,747.24 (-1.3%) Res descending 3,947.42 (+4.0%)
50d: Sup flat 3,753.84 (-1.1%) Res flat 3,997.55 (+5.3%)
S/R Levels
| R1 | 3,923.93 | +3.3% | ★★★★★ |
| R2 | 4,012.29 | +5.7% | ★★★★☆ |
| R3 | 4,156.42 | +9.5% | ★★★☆☆ |
|
3,797.24
52W 3,741.11–4,258.86
|
| S1 | 3,762.01 | -0.9% | ★★★★★ |
| S2 | 3,547.16 | -6.6% | ★★★★☆ |
| S3 | 3,483.38 | -8.3% | ★★★☆☆ |
Moving Averages
| SMA 20 | 3,886.10 | below -2.3% |
| SMA 50 | 3,899.20 | below -2.6% |
| SMA 200 | 4,007.92 | below -5.3% |
Price below SMA20 & SMA50 — bearish structure
Price below SMA200 (-5.3%) — long-term downtrend
Analysis
The Shanghai Composite declines 0.43% to 3,797, remaining below all key SMAs (20d: 3,886; 50d: 3,899; 200d: 4,008), signaling sustained bearish pressure. The RSI-14 at 37 confirms oversold conditions but lacks reversal momentum. A cluster of Double Top patterns (71-92% confidence) reinforces the downtrend, with immediate resistance at 3,924 (R1) and support at 3,762 (S1). Descending trendlines (20d: 3,747-3,947; 50d: 3,754-3,998) highlight narrowing price action. The index faces structural headwinds unless it reclaims the 20-day SMA, while a break below S1 could accelerate losses toward S2 (3,547). The bearish bias persists absent a decisive close above 3,900.
KOSPI
KOSPI
6,384.24
▼3.65%
RSI 45

Double Top — Bearish 87%Double Bottom — Bullish 50%
20d: Sup descending 6,368.49 (-0.2%) Res descending 7,107.09 (+11.3%)
50d: Sup ascending 6,368.48 (-0.2%) Res descending 7,153.46 (+12.0%)
S/R Levels
| R1 | 6,674.66 | +4.5% | ★★★★★ |
| R2 | 6,996.12 | +9.6% | ★★★★☆ |
| R3 | 7,186.53 | +12.6% | ★★★☆☆ |
|
6,384.24
52W 3,365.73–9,385.59
|
| S1 | 5,051.22 | -20.9% | ★★★★★ |
| S2 | 3,850.58 | -39.7% | ★★★★☆ |
| S3 | 3,115.46 | -51.2% | ★★★☆☆ |
Moving Averages
| SMA 20 | 6,853.52 | below -6.8% |
| SMA 50 | 6,684.45 | below -4.5% |
| SMA 200 | 6,376.09 | above +0.1% |
Price below SMA20 & SMA50 — bearish structure
Price above SMA200 (+0.1%) — long-term uptrend
Analysis
The KOSPI is trading at 6,384, down 3.65%, with the RSI-14 at 45 indicating neutral momentum. The index remains below key SMAs (20d: 6,854; 50d: 6,684), reinforcing bearish near-term sentiment, though the 200d SMA (6,376) provides tentative support. Resistance levels are noted at 6,675 (R1), 6,996 (R2), and 7,187 (R3), while support lies at 5,051 (S1). Multiple bearish double-top patterns (87% and two 50% confidence instances) suggest potential downside. Trendlines show descending resistance near 7,107 (20d) and 7,153 (50d), with support at 6,368 holding critical. The broader trend remains weak, with a break below 6,368 likely accelerating selling pressure.
ASX200
ASX 200
8,783.20
▲0.76%
RSI 37

Double Top — Bearish 95%Double Bottom — Bullish 61%Flag — Bullish 87%
20d: Sup descending 8,587.65 (-2.2%) Res ascending 8,825.05 (+0.5%)
50d: Sup descending 8,435.37 (-4.0%) Res descending 8,793.90 (+0.1%)
S/R Levels
| R1 | 8,872.92 | +1.0% | ★★★★★ |
| R2 | 9,064.52 | +3.2% | ★★★★☆ |
| R3 | 9,240.07 | +5.2% | ★★★☆☆ |
|
8,783.20
52W 8,262.40–9,296.70
|
| S1 | 8,746.00 | -0.4% | ★★★★★ |
| S2 | 8,588.22 | -2.2% | ★★★★☆ |
| S3 | 8,322.80 | -5.2% | ★★★☆☆ |
Moving Averages
| SMA 20 | 8,712.00 | above +0.8% |
| SMA 50 | 8,926.23 | below -1.6% |
| SMA 200 | 8,826.78 | below -0.5% |
Price between SMA20 and SMA50 — mixed signal
Price below SMA200 (-0.5%) — long-term downtrend
Analysis
The ASX 200 trades at 8,783, up 0.76%, with the RSI-14 at 37 indicating potential oversold conditions. The index remains below key SMAs (20d=8,712, 50d=8,926, 200d=8,827), reinforcing a bearish bias. Resistance levels are noted at 8,873 (R1), 9,065 (R2), and 9,240 (R3), while supports sit at 8,746 (S1), 8,588 (S2), and 8,323 (S3). Three double-top patterns (95%, 85%, 50% confidence) suggest downward pressure. Short-term trendlines show descending support near 8,588 and resistance at 8,825 (20d), with the 50d trendline support at 8,435 and resistance at 8,794. The technical setup leans bearish, though oversold RSI may temper near-term declines. A break below S1 could accelerate downside momentum.
NIFTY50
NIFTY 50
22,363.35
▼0.70%
RSI 44

Double Top — Bearish 63%Double Bottom — Bullish 50%
20d: Sup descending 21,779.81 (-2.6%) Res descending 22,650.89 (+1.3%)
50d: Sup descending 21,941.26 (-1.9%) Res descending 22,908.84 (+2.4%)
S/R Levels
| R1 | 24,307.06 | +8.7% | ★★★★★ |
| R2 | 25,282.95 | +13.1% | ★★★★☆ |
| R3 | 26,190.27 | +17.1% | ★★★☆☆ |
|
22,363.35
52W 22,179.90–26,373.20
|
| S1 | 22,182.55 | -0.8% | ★★★★★ |
Moving Averages
| SMA 20 | 22,916.72 | below -2.4% |
| SMA 50 | 23,687.39 | below -5.6% |
| SMA 200 | 24,253.97 | below -7.8% |
Price below SMA20 & SMA50 — bearish structure
Price below SMA200 (-7.8%) — long-term downtrend
Analysis
The NIFTY 50 is currently trading at 22,363, down 0.70%, showing bearish momentum as it remains below key SMAs (20, 50, and 200-day). The RSI-14 at 44 indicates weakening but not oversold conditions. Multiple bearish double-top patterns (63%, 50%, and 50% confidence) reinforce downside risks. Immediate support lies at 22,183 (S1), with resistance at descending trendlines (20d: 22,651; 50d: 22,909). The index faces strong overhead resistance at 24,307 (R1), while the descending support trendline at 21,780 (20d) could act as a near-term floor. The broader downtrend is confirmed by the price trading below all major SMAs, suggesting continued bearish pressure unless a decisive breakout occurs above 22,909.
TAIEX
TAIEX Taiwan
49,302
▼0.02%
RSI 68

Double Top — Bearish 92%Double Bottom — Bullish 50%
20d: Sup ascending 48,769 (-1.1%) Res ascending 50,698 (+2.8%)
50d: Sup ascending 48,552 (-1.5%) Res ascending 50,287 (+2.0%)
S/R Levels
|
49,302
52W 25,469–49,969
|
| S1 | 44,332 | -10.1% | ★★★★★ |
| S2 | 41,987 | -14.8% | ★★★★☆ |
| S3 | 31,467 | -36.2% | ★★★☆☆ |
Moving Averages
| SMA 20 | 47,794 | above +3.2% |
| SMA 50 | 46,274 | above +6.5% |
| SMA 200 | 39,566 | above +24.6% |
Price above SMA20 & SMA50 — bullish structure
Price above SMA200 (+24.6%) — long-term uptrend
Analysis
The TAIEX trades at 49,302, down slightly by 0.02%, with the RSI-14 at 68 indicating overbought conditions. The index remains above key SMAs (20, 50, 200), confirming a bullish trend, but faces resistance near 50,287–50,698. Multiple double-top patterns (92%, 95%, and 50% confidence) suggest potential bearish reversal risks. Immediate support lies at 48,552–48,769, with stronger levels at 44,332 and 41,987. The ascending trendlines reinforce near-term bullish momentum, but a break below 48,552 could signal a pullback. Caution is warranted given overbought RSI and bearish patterns, though the broader uptrend remains intact unless support zones are breached.
Disclaimer
The content on MarketsFN.com is provided for educational and informational purposes only. It does not constitute financial advice or investment recommendations. All investments involve risks and past performance does not guarantee future results. You are solely responsible for your investment decisions.