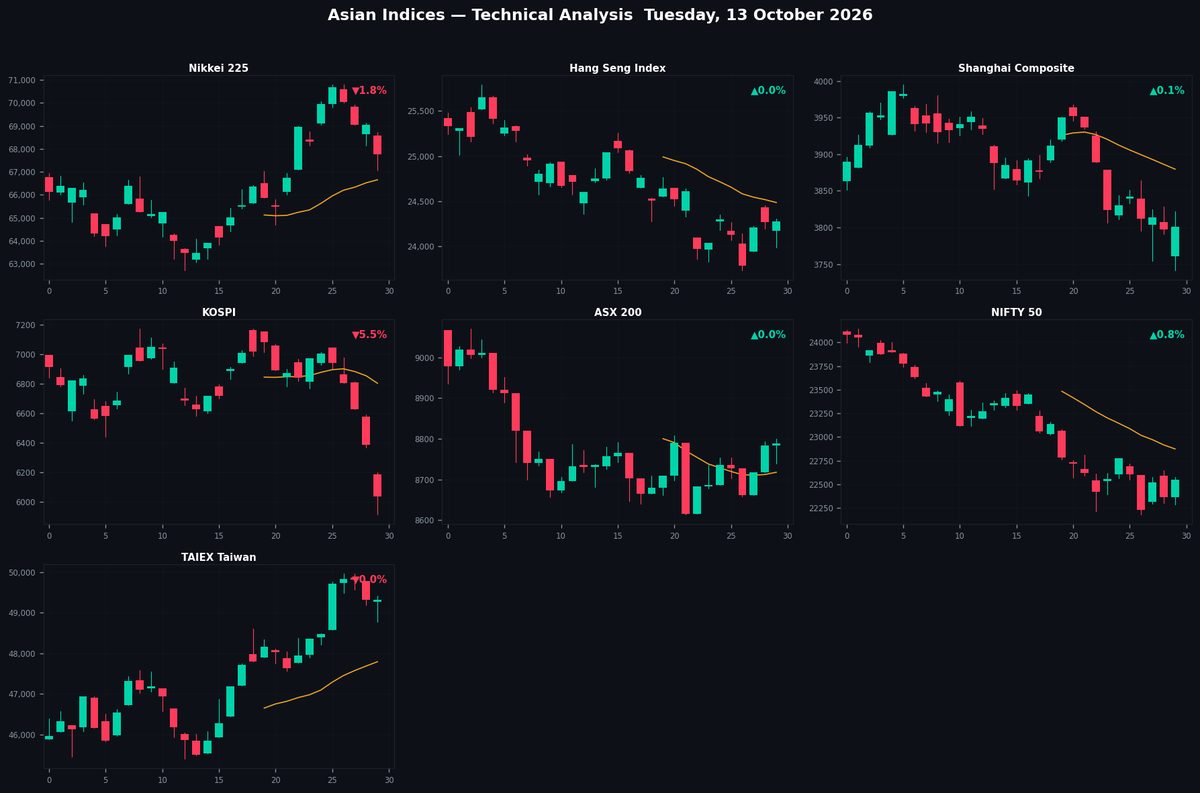
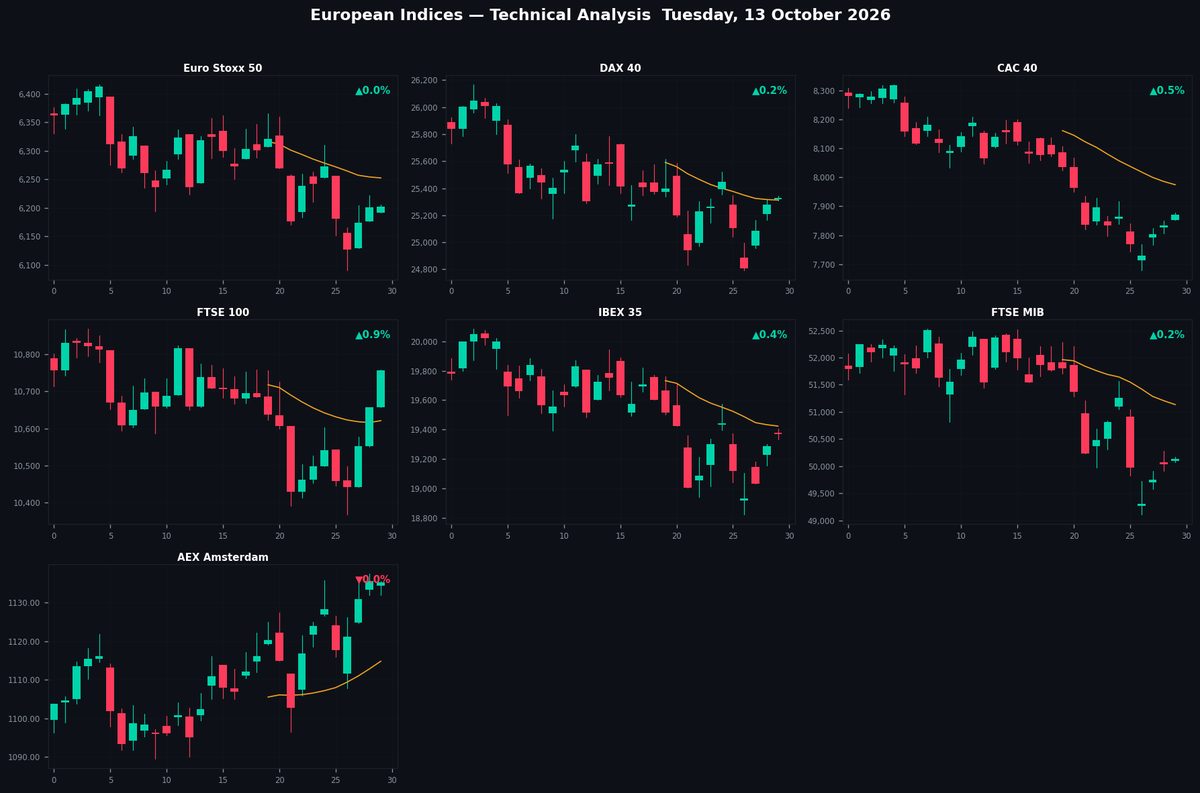
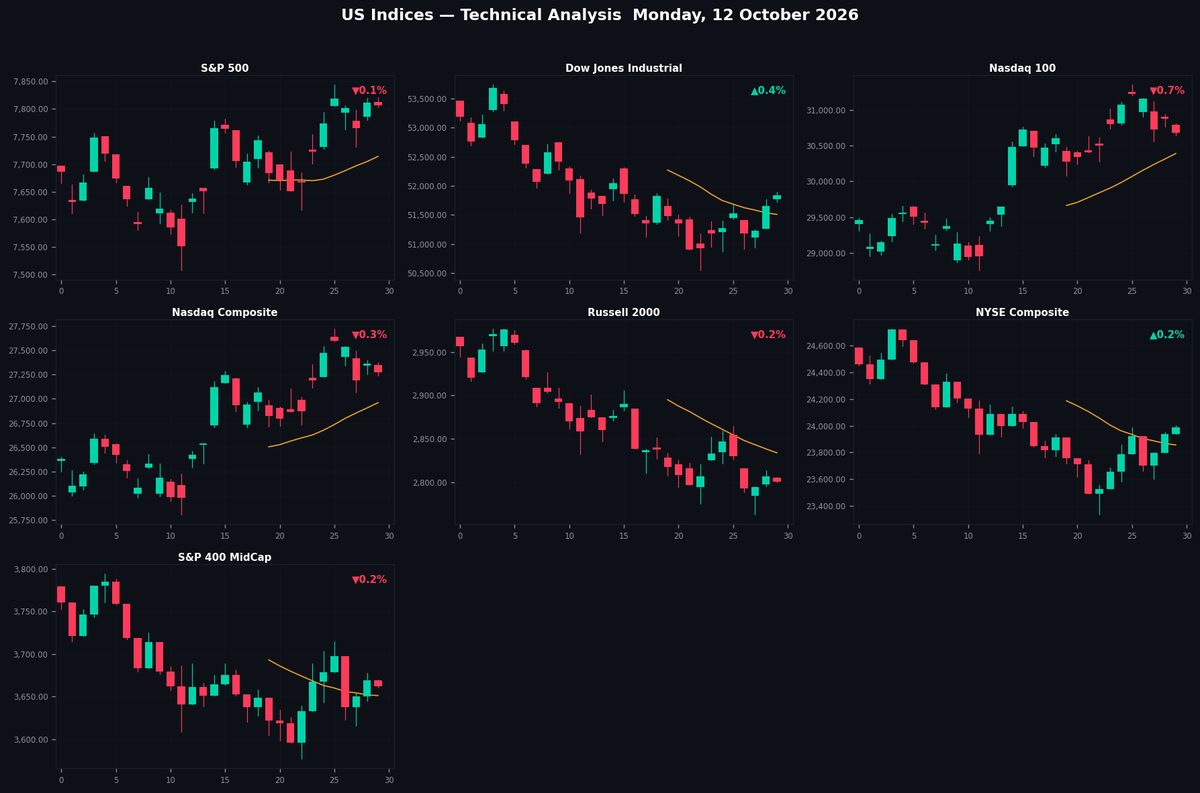
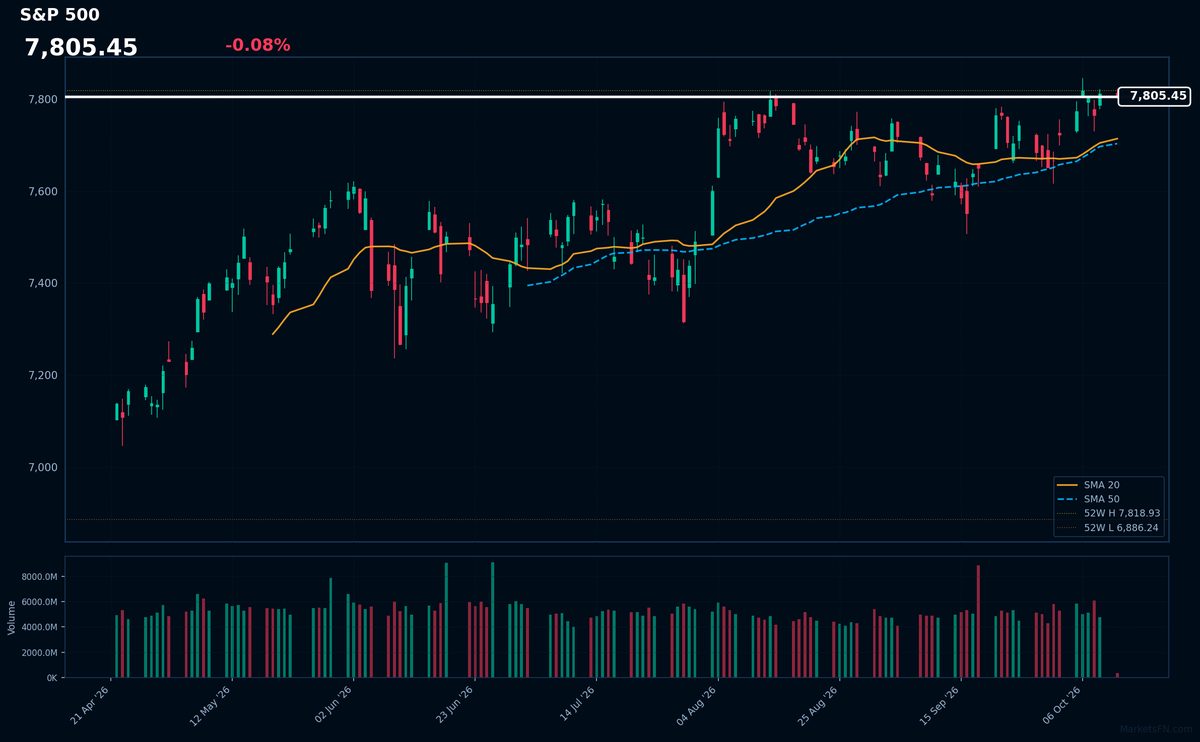
Technical analysis update for the seven major Asian equity indices on Tuesday, 13 October 2026.
Charts cover 65 sessions (daily bars) with SMA-20, SMA-50, Bollinger Bands (20,2),
dynamic support/resistance trendlines (20-day and 50-day), and pivot-cluster S/R levels.
Covering Nikkei 225, Hang Seng Index, Shanghai Composite, KOSPI, ASX 200,
NIFTY 50, and TAIEX Taiwan.
| Code |
Index |
Last |
Chg% |
RSI |
52W H |
52W L |
| NIKKEI | Nikkei 225 | 67,778 | ▼1.82% | 64.5 | 72,832 | 44,358 |
| HSI | Hang Seng Index | 24,276 | ▲0.02% | 35.8 | 28,056 | 22,518 |
| SHANGHAI | Shanghai Composite | 3,800.86 | ▲0.10% | 33.4 | 4,258.86 | 3,741.11 |
| KOSPI | KOSPI | 6,035.35 | ▼5.46% | 36.9 | 9,385.59 | 3,365.73 |
| ASX200 | ASX 200 | 8,783.90 | ▲0.01% | 36.9 | 9,296.70 | 8,262.40 |
| NIFTY50 | NIFTY 50 | 22,549.25 | ▲0.83% | 43.1 | 26,373.20 | 22,179.90 |
| TAIEX | TAIEX Taiwan | 49,302 | ▼0.02% | 68.3 | 49,969 | 25,469 |
NIKKEI
Nikkei 225
67,778
▼1.82%
RSI 65

Double Top — Bearish 50%Double Bottom — Bullish 50%Flag — Bullish 67%
20d: Sup ascending 67,059 (-1.1%) Res ascending 72,350 (+6.7%)
50d: Sup ascending 63,971 (-5.6%) Res ascending 70,940 (+4.7%)
S/R Levels
| R1 | 69,197 | +2.1% | ★★★★★ |
| R2 | 70,799 | +4.5% | ★★★★☆ |
| R3 | 72,832 | +7.5% | ★★★☆☆ |
|
67,778
52W 44,358–72,832
|
| S1 | 62,589 | -7.7% | ★★★★★ |
| S2 | 50,482 | -25.5% | ★★★★☆ |
| S3 | 48,651 | -28.2% | ★★★☆☆ |
Moving Averages
| SMA 20 | 66,656 | above +1.7% |
| SMA 50 | 66,098 | above +2.5% |
| SMA 200 | 60,876 | above +11.3% |
Price above SMA20 & SMA50 — bullish structure
Price above SMA200 (+11.3%) — long-term uptrend
Analysis
The Nikkei 225 declines 1.82% to 67,778, testing near-term support amid weakening momentum. The RSI-14 at 65 remains neutral but leans toward overbought territory, suggesting potential consolidation. Price holds above key SMAs (20d: 66,656; 50d: 66,098; 200d: 60,876), confirming the broader uptrend, but faces resistance at 69,197 (R1). A triple Double Top pattern (50% confidence) signals bearish reversal risks if the index breaches the ascending 20-day support at 67,059. Immediate resistance lies at 72,350 (20d trendline), while sustained weakness may target S1 at 62,589. The convergence of SMAs and trendlines indicates tightening price action, requiring a breakout for directional conviction.
HSI
Hang Seng Index
24,276
▲0.02%
RSI 36

Double Top — Bearish 88%Double Bottom — Bullish 50%Flag — Bullish 82%
20d: Sup descending 23,526 (-3.1%) Res descending 24,395 (+0.5%)
50d: Sup descending 23,621 (-2.7%) Res descending 24,725 (+1.8%)
S/R Levels
| R1 | 26,003 | +7.1% | ★★★★★ |
| R2 | 26,758 | +10.2% | ★★★★☆ |
| R3 | 27,294 | +12.4% | ★★★☆☆ |
|
24,276
52W 22,518–28,056
|
| S1 | 24,102 | -0.7% | ★★★★★ |
| S2 | 22,518 | -7.2% | ★★★★☆ |
Moving Averages
| SMA 20 | 24,486 | below -0.9% |
| SMA 50 | 25,079 | below -3.2% |
| SMA 200 | 25,496 | below -4.8% |
Price below SMA20 & SMA50 — bearish structure
Price below SMA200 (-4.8%) — long-term downtrend
Analysis
The Hang Seng Index trades at 24,276, marginally higher (+0.02%) but remains in a bearish technical setup. The RSI-14 at 36 indicates oversold conditions, though downside momentum persists as price sits below all key SMAs (20d, 50d, 200d). Multiple confirmed Double Top patterns reinforce resistance near 26,000–27,300, while immediate support lies at 24,102 (S1). Descending trendlines across 20d and 50d frames further pressure the index, with resistance at 24,395 (20d) and 24,725 (50d) capping rallies. A break below S1 could accelerate declines toward 22,518 (S2), though oversold RSI may stall near-term selling. The broader trend remains downward unless decisive reclaims above SMA20 (24,486) occur.
SHANGHAI
Shanghai Composite
3,800.86
▲0.10%
RSI 33

Double Top — Bearish 92%Double Bottom — Bullish 50%
20d: Sup descending 3,740.35 (-1.6%) Res descending 3,922.93 (+3.2%)
50d: Sup descending 3,741.53 (-1.6%) Res flat 3,993.34 (+5.1%)
S/R Levels
| R1 | 3,923.93 | +3.2% | ★★★★★ |
| R2 | 4,012.29 | +5.6% | ★★★★☆ |
| R3 | 4,156.42 | +9.4% | ★★★☆☆ |
|
3,800.86
52W 3,741.11–4,258.86
|
| S1 | 3,767.46 | -0.9% | ★★★★★ |
| S2 | 3,547.16 | -6.7% | ★★★★☆ |
Moving Averages
| SMA 20 | 3,879.51 | below -2.0% |
| SMA 50 | 3,898.06 | below -2.5% |
| SMA 200 | 4,007.43 | below -5.2% |
Price below SMA20 & SMA50 — bearish structure
Price below SMA200 (-5.2%) — long-term downtrend
Analysis
The Shanghai Composite trades at 3,801 (+0.10%), showing mild bullish momentum but remaining below key SMAs (SMA20: 3,880, SMA50: 3,898, SMA200: 4,007), signaling bearish pressure. The RSI-14 at 33 indicates oversold conditions but lacks strong reversal confirmation. Resistance levels at 3,924 (R1), 4,012 (R2), and 4,156 (R3) cap upside, while supports at 3,767 (S1) and 3,547 (S2) provide downside buffers. Multiple confirmed Double Top patterns (92%, 89%, 71% confidence) suggest bearish continuation. Descending trendlines reinforce resistance near 3,923 (20d) and 3,993 (50d), with support testing 3,740–3,742. The index remains in a downtrend unless it decisively breaks above SMA20 and key resistances.
KOSPI
KOSPI
6,035.35
▼5.46%
RSI 37

Double Top — Bearish 87%Double Bottom — Bullish 50%
20d: Sup descending 5,911.11 (-2.1%) Res descending 6,972.75 (+15.5%)
50d: Sup ascending 5,911.13 (-2.1%) Res descending 7,151.66 (+18.5%)
S/R Levels
| R1 | 6,674.66 | +10.6% | ★★★★★ |
| R2 | 7,020.40 | +16.3% | ★★★★☆ |
| R3 | 7,186.53 | +19.1% | ★★★☆☆ |
|
6,035.35
52W 3,365.73–9,385.59
|
| S1 | 5,051.22 | -16.3% | ★★★★★ |
| S2 | 3,850.58 | -36.2% | ★★★★☆ |
| S3 | 3,115.46 | -48.4% | ★★★☆☆ |
Moving Averages
| SMA 20 | 6,802.71 | below -11.3% |
| SMA 50 | 6,684.68 | below -9.7% |
| SMA 200 | 6,385.43 | below -5.5% |
Price below SMA20 & SMA50 — bearish structure
Price below SMA200 (-5.5%) — long-term downtrend
Analysis
The KOSPI is currently trading at 6,035, down 5.46%, with bearish momentum indicated by an RSI-14 of 37. Prices remain below all key SMAs (20d: 6,803; 50d: 6,685; 200d: 6,385), reinforcing the downtrend. Multiple Double Top patterns (87% and two 50% confidence levels) suggest further downside potential. Immediate resistance levels are at 6,675 (R1), 7,020 (R2), and 7,187 (R3), while support lies at 5,051 (S1), 3,851 (S2), and 3,115 (S3). Descending trendlines on the 20-day and 50-day charts confirm bearish pressure, with the 20-day resistance at 6,973 and the 50-day resistance at 7,152. The index is testing near-term support at 5,911, with a break potentially accelerating declines.
ASX200
ASX 200
8,783.90
▲0.01%
RSI 37

Double Top — Bearish 95%Double Bottom — Bullish 61%Flag — Bullish 87%
20d: Sup descending 8,589.35 (-2.2%) Res ascending 8,818.63 (+0.4%)
50d: Sup descending 8,341.60 (-5.0%) Res descending 8,800.70 (+0.2%)
S/R Levels
| R1 | 8,872.92 | +1.0% | ★★★★★ |
| R2 | 9,064.52 | +3.2% | ★★★★☆ |
| R3 | 9,240.07 | +5.2% | ★★★☆☆ |
|
8,783.90
52W 8,262.40–9,296.70
|
| S1 | 8,746.00 | -0.4% | ★★★★★ |
| S2 | 8,588.22 | -2.2% | ★★★★☆ |
| S3 | 8,322.80 | -5.2% | ★★★☆☆ |
Moving Averages
| SMA 20 | 8,717.57 | above +0.8% |
| SMA 50 | 8,918.99 | below -1.5% |
| SMA 200 | 8,827.12 | below -0.5% |
Price between SMA20 and SMA50 — mixed signal
Price below SMA200 (-0.5%) — long-term downtrend
Analysis
The ASX 200 trades flat at 8,784, marginally higher by 0.01%, as the index consolidates near short-term support. The RSI-14 at 37 remains in neutral territory but leans toward oversold conditions. Price action hovers above the SMA20 (8,718) but below the SMA50 (8,919) and SMA200 (8,827), indicating mixed near-term momentum. Resistance levels are noted at 8,873 (R1), 9,065 (R2), and 9,240 (R3), while supports sit at 8,746 (S1), 8,588 (S2), and 8,323 (S3). Multiple bearish double-top patterns suggest potential downside pressure, reinforced by descending trendline resistance at 8,819 (20-day) and 8,801 (50-day). A break below 8,746 may accelerate declines toward lower supports. The overall structure remains cautious pending a decisive breakout.
NIFTY50
NIFTY 50
22,549.25
▲0.83%
RSI 43

Double Top — Bearish 63%Double Bottom — Bullish 53%
20d: Sup descending 21,707.74 (-3.7%) Res descending 22,584.24 (+0.2%)
50d: Sup descending 21,860.35 (-3.1%) Res descending 22,862.98 (+1.4%)
S/R Levels
| R1 | 24,307.06 | +7.8% | ★★★★★ |
| R2 | 25,282.95 | +12.1% | ★★★★☆ |
| R3 | 26,190.27 | +16.1% | ★★★☆☆ |
|
22,549.25
52W 22,179.90–26,373.20
|
| S1 | 22,182.55 | -1.6% | ★★★★★ |
Moving Averages
| SMA 20 | 22,874.27 | below -1.4% |
| SMA 50 | 23,650.71 | below -4.7% |
| SMA 200 | 24,237.63 | below -7.0% |
Price below SMA20 & SMA50 — bearish structure
Price below SMA200 (-7.0%) — long-term downtrend
Analysis
The NIFTY 50 trades at 22,549 (+0.83%) but remains below key SMAs (20D: 22,874; 50D: 23,651; 200D: 24,238), indicating persistent bearish pressure. The RSI-14 at 43 shows mild bearish momentum, though not oversold. Multiple Double Top patterns (63%, 50%, 50% confidence) reinforce resistance near 22,584–22,863, aligning with descending trendlines. Immediate support is at S1 (22,183), with stronger resistance at R1 (24,307). The index must breach the 20D SMA to invalidate the downtrend, but the convergence of bearish patterns and moving averages suggests further downside risk unless buying volume accelerates. A break below S1 could trigger a test of 21,708–21,860 support zones.
TAIEX
TAIEX Taiwan
49,302
▼0.02%
RSI 68

Double Top — Bearish 92%Double Bottom — Bullish 50%
20d: Sup ascending 48,769 (-1.1%) Res ascending 50,698 (+2.8%)
50d: Sup ascending 48,552 (-1.5%) Res ascending 50,287 (+2.0%)
S/R Levels
|
49,302
52W 25,469–49,969
|
| S1 | 44,332 | -10.1% | ★★★★★ |
| S2 | 41,987 | -14.8% | ★★★★☆ |
| S3 | 31,467 | -36.2% | ★★★☆☆ |
Moving Averages
| SMA 20 | 47,794 | above +3.2% |
| SMA 50 | 46,274 | above +6.5% |
| SMA 200 | 39,566 | above +24.6% |
Price above SMA20 & SMA50 — bullish structure
Price above SMA200 (+24.6%) — long-term uptrend
Analysis
The TAIEX trades at 49,302, down slightly by 0.02%, as bullish momentum shows signs of fatigue with the RSI-14 at 68, nearing overbought territory. The index remains above key SMAs (20d: 47,794; 50d: 46,274; 200d: 39,566), reinforcing the broader uptrend. However, three bearish Double Top patterns (92%, 95%, and 50% confidence) suggest potential near-term resistance. Immediate support lies at 48,769 (20d ascending trendline), with stronger levels at 44,332 (S1) and 41,987 (S2). Resistance is noted at 50,698 (20d ascending trendline). A break below 48,769 could trigger a pullback, while surpassing 50,698 may extend gains. Caution is warranted given overbought conditions and bearish patterns.
Disclaimer
The content on MarketsFN.com is provided for educational and informational purposes only. It does not constitute financial advice or investment recommendations. All investments involve risks and past performance does not guarantee future results. You are solely responsible for your investment decisions.