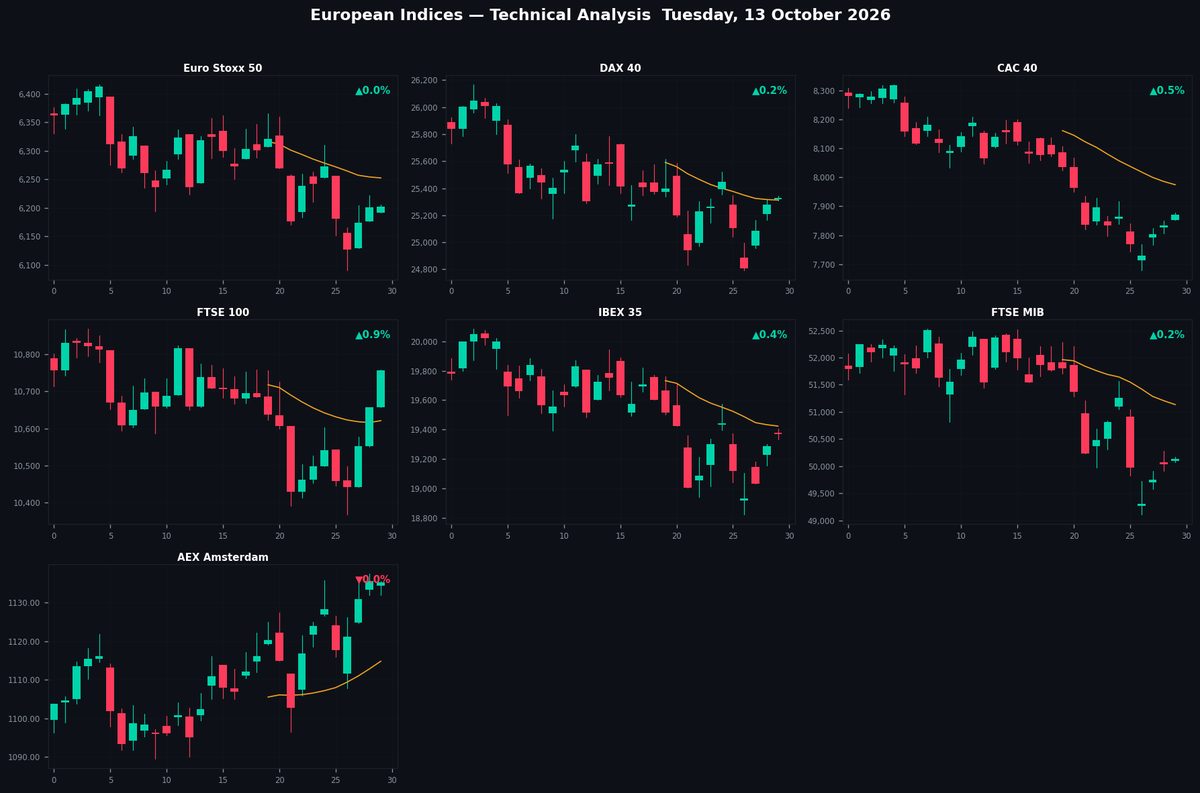
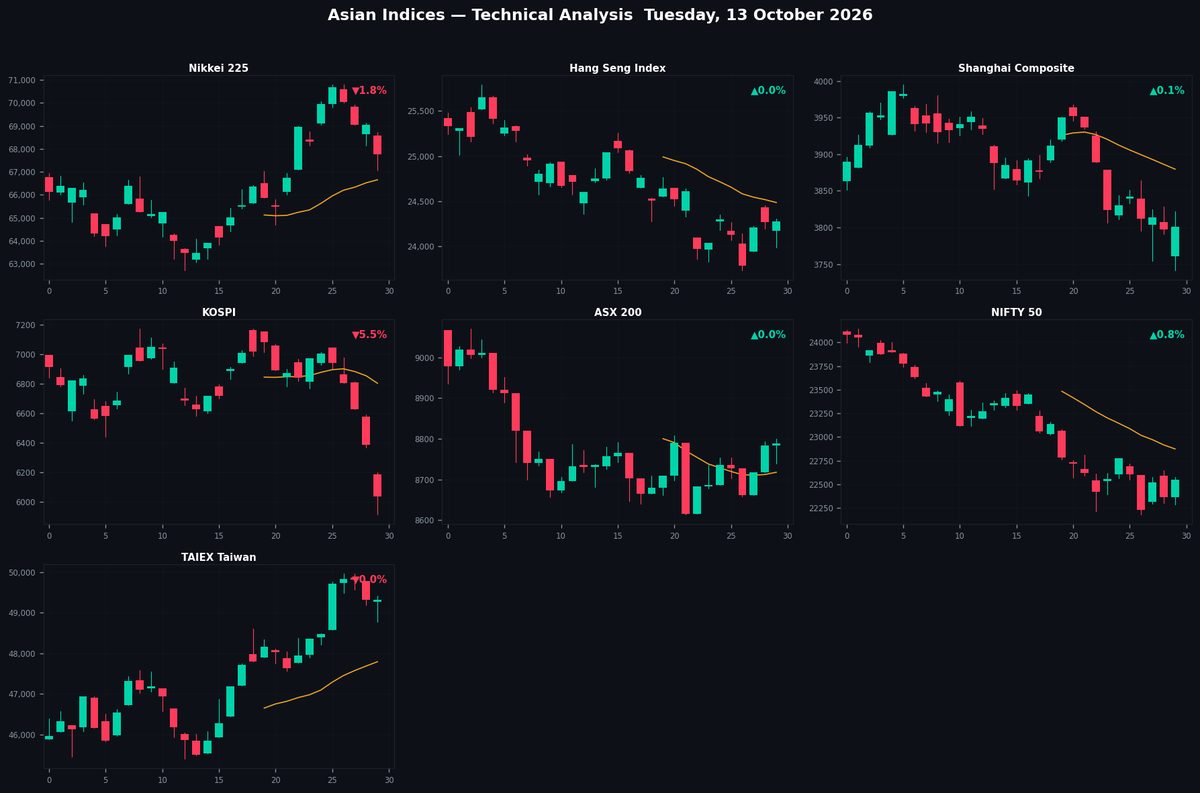
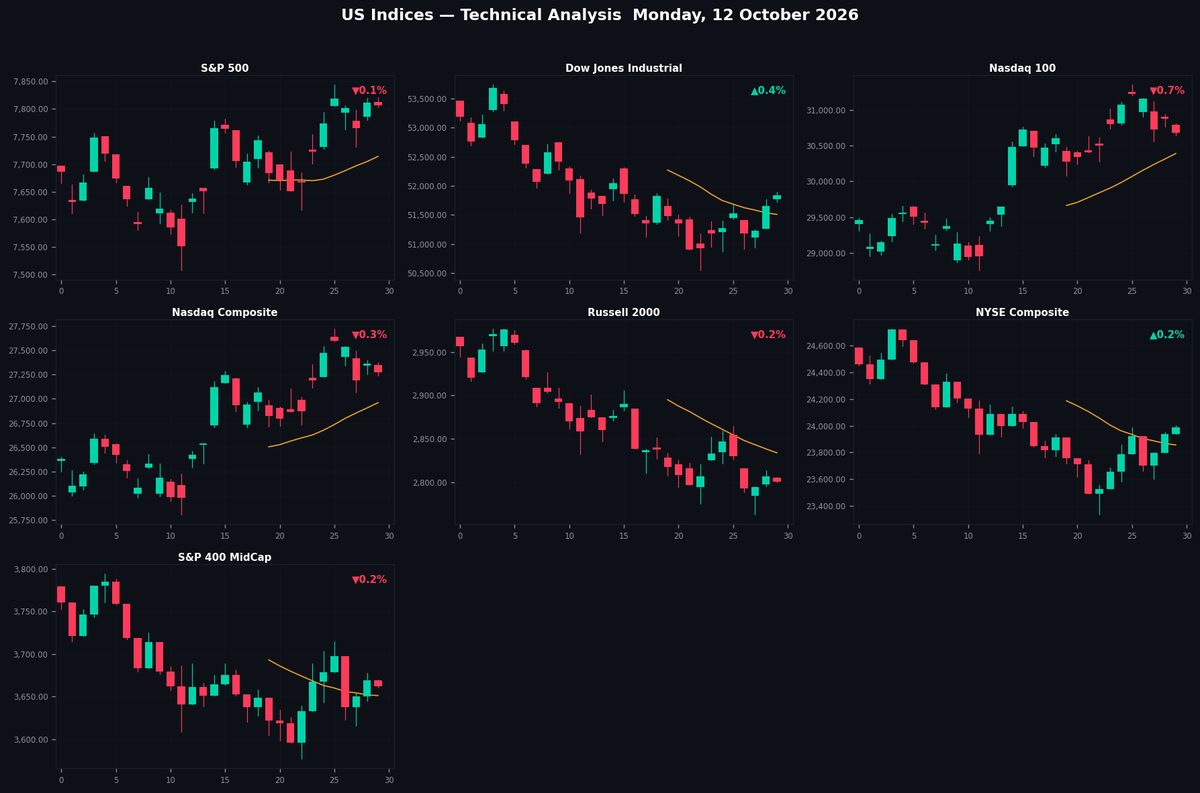
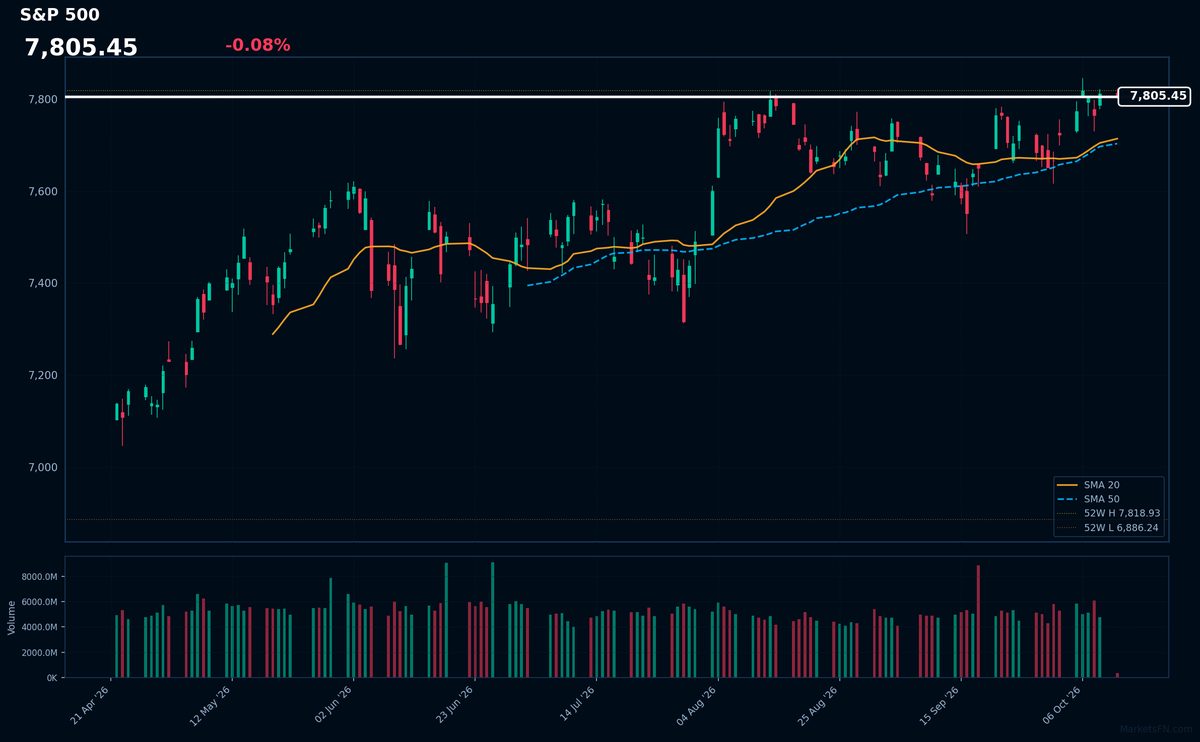
Technical analysis update for the seven major European equity indices on Tuesday, 13 October 2026.
Charts cover 65 sessions (daily bars) with SMA-20, SMA-50, Bollinger Bands (20,2),
dynamic support/resistance trendlines (20-day and 50-day), and pivot-cluster S/R levels.
| Code |
Index |
Last |
Chg% |
RSI |
52W H |
52W L |
| STOXX50 | Euro Stoxx 50 | 6,202 | ▲0.01% | 34.2 | 6,577 | 5,377 |
| DAX | DAX 40 | 25,317 | ▲0.16% | 41.0 | 26,619 | 21,864 |
| CAC40 | CAC 40 | 7,870 | ▲0.48% | 39.1 | 8,755 | 7,505 |
| FTSE100 | FTSE 100 | 10,757 | ▲0.94% | 53.1 | 10,990 | 9,277 |
| IBEX35 | IBEX 35 | 19,367 | ▲0.42% | 44.2 | 20,356 | 15,409 |
| FTSEMIB | FTSE MIB | 50,139 | ▲0.21% | 29.1 | 54,042 | 41,360 |
| AEX | AEX Amsterdam | 1,135.29 | ▼0.02% | 51.7 | 1,137.57 | 916.79 |
STOXX50
Euro Stoxx 50
6,202
▲0.01%
RSI 34

Double Top — Bearish 72%Double Bottom — Bullish 87%Flag — Bullish 69%
20d: Sup descending 6,063 (-2.2%) Res descending 6,302 (+1.6%)
50d: Sup descending 6,007 (-3.1%) Res descending 6,302 (+1.6%)
S/R Levels
| R1 | 6,369 | +2.7% | ★★★★★ |
| R2 | 6,538 | +5.4% | ★★★★☆ |
|
6,202
52W 5,377–6,577
|
| S1 | 6,188 | -0.2% | ★★★★★ |
| S2 | 5,975 | -3.7% | ★★★★☆ |
| S3 | 5,438 | -12.3% | ★★★☆☆ |
Moving Averages
| SMA 20 | 6,252 | below -0.8% |
| SMA 50 | 6,360 | below -2.5% |
| SMA 200 | 6,094 | above +1.8% |
Price below SMA20 & SMA50 — bearish structure
Price above SMA200 (+1.8%) — long-term uptrend
Analysis
The Euro Stoxx 50 trades at 6,202, up marginally by 0.01%, as the index remains under pressure with an RSI-14 of 34 indicating oversold conditions. The price sits below key SMAs (20d at 6,252, 50d at 6,360), reinforcing bearish near-term momentum, though the 200d SMA at 6,094 offers underlying support. Resistance levels at 6,369 (R1) and 6,538 (R2) cap upside, while supports at 6,188 (S1) and 5,975 (S2) may stabilize declines. Multiple double-top patterns (72%, 57%, 50% confidence) suggest bearish reversal risks. Descending trendlines confirm the downtrend, with 20d resistance at 6,302. A break below S1 could accelerate selling toward S2.
DAX
DAX 40
25,317
▲0.16%
RSI 41

Double Top — Bearish 92%Double Bottom — Bullish 93%
20d: Sup descending 24,538 (-3.1%) Res descending 25,392 (+0.3%)
50d: Sup descending 24,607 (-2.8%) Res descending 25,342 (+0.1%)
S/R Levels
| R1 | 25,497 | +0.7% | ★★★★★ |
| R2 | 25,900 | +2.3% | ★★★★☆ |
| R3 | 26,596 | +5.1% | ★★★☆☆ |
|
25,317
52W 21,864–26,619
|
| S1 | 24,719 | -2.4% | ★★★★★ |
| S2 | 24,130 | -4.7% | ★★★★☆ |
| S3 | 23,523 | -7.1% | ★★★☆☆ |
Moving Averages
| SMA 20 | 25,312 | above +0.0% |
| SMA 50 | 25,767 | below -1.7% |
| SMA 200 | 24,867 | above +1.8% |
Price between SMA20 and SMA50 — mixed signal
Price above SMA200 (+1.8%) — long-term uptrend
Analysis
The DAX 40 trades at 25,317 (+0.16%), hovering near the SMA20 (25,312) but below the SMA50 (25,767), suggesting near-term consolidation within a broader downtrend. The RSI-14 at 41 reflects neutral-to-weak momentum. Multiple bearish double-top patterns (92%, 83%, 58% confidence) indicate potential downside pressure, reinforced by descending trendline resistance at 25,392 (20d) and 25,342 (50d). Immediate resistance is at R1 (25,497), while support lies at S1 (24,719). A break below the SMA20 could accelerate a retest of S1, whereas reclaiming the SMA50 may shift sentiment. The index remains range-bound between descending trendlines and key moving averages, with bearish patterns warranting caution.
CAC40
CAC 40
7,870
▲0.48%
RSI 39

Double Top — Bearish 50%Double Bottom — Bullish 95%Flag — Bullish 68%
20d: Sup descending 7,605 (-3.4%) Res descending 7,878 (+0.1%)
50d: Sup descending 7,620 (-3.2%) Res descending 7,963 (+1.2%)
S/R Levels
| R1 | 7,984 | +1.4% | ★★★★★ |
| R2 | 8,266 | +5.0% | ★★★★☆ |
| R3 | 8,464 | +7.5% | ★★★☆☆ |
|
7,870
52W 7,505–8,755
|
| S1 | 7,854 | -0.2% | ★★★★★ |
| S2 | 7,732 | -1.8% | ★★★★☆ |
| S3 | 7,514 | -4.5% | ★★★☆☆ |
Moving Averages
| SMA 20 | 7,974 | below -1.3% |
| SMA 50 | 8,247 | below -4.6% |
| SMA 200 | 8,227 | below -4.3% |
Price below SMA20 & SMA50 — bearish structure
Price below SMA200 (-4.3%) — long-term downtrend
Analysis
The CAC 40 trades at 7,870, up 0.48%, but remains below key moving averages (SMA20 at 7,974, SMA50 at 8,247, SMA200 at 8,227), reflecting persistent bearish pressure. The RSI-14 at 39 suggests mild oversold conditions but lacks strong bullish momentum. Resistance levels at 7,984 (R1) and 8,266 (R2) cap upside, while supports at 7,854 (S1) and 7,732 (S2) offer near-term floors. The index shows multiple bearish double-top patterns, with the highest confidence (95%) signaling potential downside. Descending trendlines reinforce the downtrend, with 20-day resistance at 7,878 and 50-day resistance at 7,963. A break below S1 could accelerate declines toward S2, while reclaiming SMA20 is needed to shift sentiment.
FTSE100
FTSE 100
10,757
▲0.94%
RSI 53

Double Top — Bearish 93%Double Bottom — Bullish 62%
20d: Sup descending 10,233 (-4.9%) Res descending 10,758 (+0.0%)
50d: Sup descending 10,312 (-4.1%) Res descending 10,758 (+0.0%)
S/R Levels
| R1 | 10,916 | +1.5% | ★★★★★ |
|
10,757
52W 9,277–10,990
|
| S1 | 10,653 | -1.0% | ★★★★★ |
| S2 | 10,374 | -3.6% | ★★★★☆ |
| S3 | 10,115 | -6.0% | ★★★☆☆ |
Moving Averages
| SMA 20 | 10,621 | above +1.3% |
| SMA 50 | 10,723 | above +0.3% |
| SMA 200 | 10,480 | above +2.6% |
Price above SMA20 & SMA50 — bullish structure
Price above SMA200 (+2.6%) — long-term uptrend
Analysis
The FTSE 100 trades at 10,757, up 0.94%, with the RSI-14 at 53 indicating neutral momentum. The index remains above all key SMAs (20d: 10,621; 50d: 10,723; 200d: 10,480), suggesting underlying support. However, multiple bearish Double Top patterns (93%, 82%, 56% confidence) signal potential downside risk. Immediate resistance lies at R1 10,916, while supports are at S1 10,653, S2 10,374, and S3 10,115. Descending trendlines on 20d and 50d charts converge near 10,758, reinforcing resistance. A break above 10,758 could invalidate bearish patterns, but failure may trigger a retest of lower supports. The mixed technical picture warrants caution despite the bullish SMA alignment.
IBEX35
IBEX 35
19,367
▲0.42%
RSI 44

Double Top — Bearish 82%Double Bottom — Bullish 50%
20d: Sup descending 18,593 (-4.0%) Res descending 19,404 (+0.2%)
50d: Sup descending 18,745 (-3.2%) Res descending 19,725 (+1.8%)
S/R Levels
| R1 | 19,575 | +1.1% | ★★★★★ |
| R2 | 20,008 | +3.3% | ★★★★☆ |
| R3 | 20,342 | +5.0% | ★★★☆☆ |
|
19,367
52W 15,409–20,356
|
| S1 | 19,157 | -1.1% | ★★★★★ |
| S2 | 18,015 | -7.0% | ★★★★☆ |
| S3 | 17,468 | -9.8% | ★★★☆☆ |
Moving Averages
| SMA 20 | 19,424 | below -0.3% |
| SMA 50 | 19,749 | below -1.9% |
| SMA 200 | 18,588 | above +4.2% |
Price below SMA20 & SMA50 — bearish structure
Price above SMA200 (+4.2%) — long-term uptrend
Analysis
The IBEX 35 trades at 19,367 (+0.42%), showing mild bullish momentum but remaining below key SMAs (20d: 19,424; 50d: 19,749), indicating near-term resistance. The RSI-14 at 44 suggests neutral conditions with slight bearish bias. A cluster of Double Top patterns (50-95% confidence) signals potential downside, reinforced by descending trendline resistance at 19,404 (20d) and 19,725 (50d). Immediate resistance sits at R1 (19,575), while support levels at S1 (19,157) and S2 (18,015) may cushion declines. The index remains above the rising SMA200 (18,588), preserving the broader uptrend, but short-term weakness persists unless it reclaims the 20d SMA. Watch for a break below S1 to confirm bearish patterns.
FTSEMIB
FTSE MIB
50,139
▲0.21%
RSI 29

Double Top — Bearish 94%Double Bottom — Bullish 66%
20d: Sup descending 48,637 (-3.0%) Res descending 51,034 (+1.8%)
50d: Sup descending 48,841 (-2.6%) Res descending 51,708 (+3.1%)
S/R Levels
| R1 | 50,454 | +0.6% | ★★★★★ |
| R2 | 52,925 | +5.6% | ★★★★☆ |
| R3 | 54,042 | +7.8% | ★★★☆☆ |
|
50,139
52W 41,360–54,042
|
| S1 | 45,246 | -9.8% | ★★★★★ |
| S2 | 42,862 | -14.5% | ★★★★☆ |
| S3 | 41,669 | -16.9% | ★★★☆☆ |
Moving Averages
| SMA 20 | 51,135 | below -1.9% |
| SMA 50 | 52,078 | below -3.7% |
| SMA 200 | 49,151 | above +2.0% |
Price below SMA20 & SMA50 — bearish structure
Price above SMA200 (+2.0%) — long-term uptrend
Analysis
The FTSE MIB trades at 50,139, up 0.21%, but remains below key SMAs (20d: 51,135; 50d: 52,078), signaling short-term bearish pressure. The RSI-14 at 29 indicates oversold conditions, though the index faces resistance at 50,454 (R1). A confirmed Double Top pattern (94% confidence) reinforces downside risks, with further support at 45,246 (S1). The 200d SMA at 49,151 provides a critical floor. Descending trendlines highlight weakening momentum, with 20d resistance at 51,034 and 50d resistance at 51,708. A break below 48,637 (20d support) could accelerate declines, while reclaiming 50,454 may ease bearish pressure. The technical setup favors caution unless key resistance levels are breached.
AEX
AEX Amsterdam
1,135.29
▼0.02%
RSI 52

Double Top — Bearish 95%Double Bottom — Bullish 50%
20d: Sup ascending 1,104.06 (-2.8%) Res ascending 1,145.69 (+0.9%)
50d: Sup descending 1,085.58 (-4.4%) Res ascending 1,137.90 (+0.2%)
S/R Levels
|
1,135.29
52W 916.79–1,137.57
|
| S1 | 1,092.00 | -3.8% | ★★★★★ |
| S2 | 988.23 | -13.0% | ★★★★☆ |
| S3 | 944.33 | -16.8% | ★★★☆☆ |
Moving Averages
| SMA 20 | 1,114.78 | above +1.8% |
| SMA 50 | 1,110.70 | above +2.2% |
| SMA 200 | 1,047.49 | above +8.4% |
Price above SMA20 & SMA50 — bullish structure
Price above SMA200 (+8.4%) — long-term uptrend
Analysis
The AEX Amsterdam trades at 1,135, marginally lower (-0.02%), with the RSI-14 at 52 indicating neutral momentum. The index remains above key SMAs (20d:1,115; 50d:1,111; 200d:1,047), reinforcing a bullish medium-term structure. However, three double top patterns—two with 95% confidence and one weaker at 50%—suggest potential bearish pressure near-term. Immediate resistance is seen at the ascending 20-day trendline (1,146), while support holds at 1,092 (S1) and the rising 20-day trendline (1,104). A break below 1,104 could test the descending 50-day support (1,086). The convergence of bearish patterns and mixed trendlines warrants caution despite the broader uptrend.
Disclaimer
The content on MarketsFN.com is provided for educational and informational purposes only. It does not constitute financial advice or investment recommendations. All investments involve risks and past performance does not guarantee future results. You are solely responsible for your investment decisions.