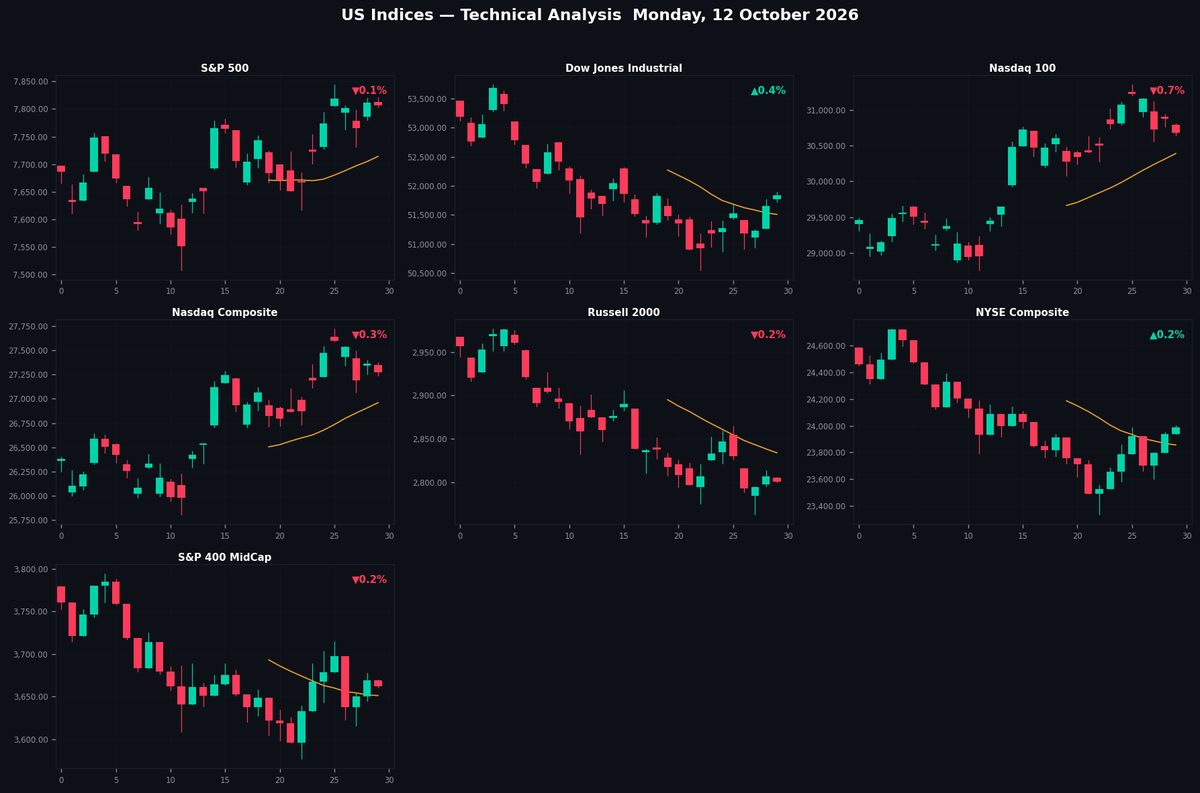
Technical analysis update for 7 major US equity indices on Monday, 12 October 2026.
Charts cover 65 sessions (daily bars) with SMA-20, SMA-50, Bollinger Bands (20,2),
dynamic support/resistance trendlines (20-day and 50-day), and pivot-cluster S/R levels.
Pre-market briefing published ahead of the New York open.
| Code |
Index |
Last |
Chg% |
RSI |
52W H |
52W L |
| SP500 | S&P 500 | 7,806.76 | ▼0.06% | 61.5 | 7,844.52 | 6,316.91 |
| DOW | Dow Jones Industrial | 51,842.57 | ▲0.36% | 42.6 | 54,744.33 | 45,057.28 |
| NDX | Nasdaq 100 | 30,679.62 | ▼0.66% | 34.8 | 31,361.37 | 22,841.42 |
| NASDAQ | Nasdaq Composite | 27,270.45 | ▼0.35% | 43.4 | 27,722.75 | 20,690.25 |
| RUSSELL | Russell 2000 | 2,800.95 | ▼0.21% | 36.2 | 3,069.71 | 2,303.46 |
| NYSE | NYSE Composite | 23,987.97 | ▲0.20% | 41.7 | 24,866.75 | 20,906.44 |
| SP400 | S&P 400 MidCap | 3,662.05 | ▼0.19% | 47.8 | 3,928.98 | 3,107.41 |
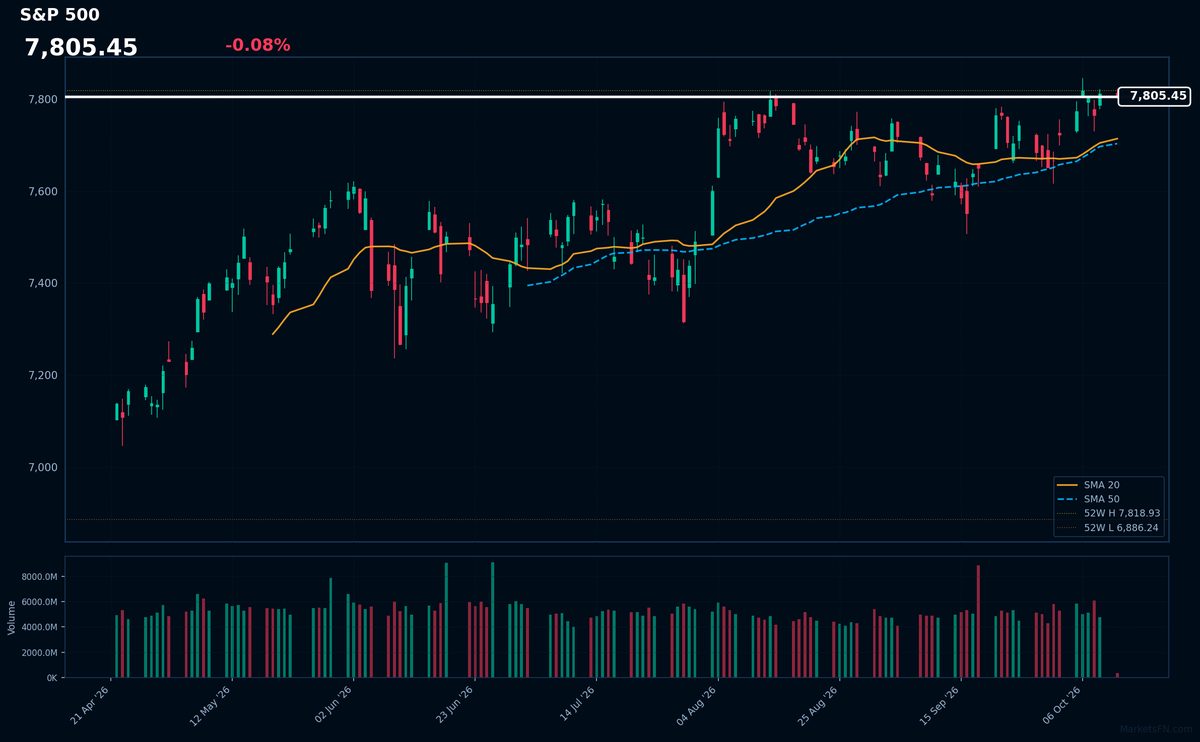
SP500
S&P 500
7,806.76
▼0.06%
RSI 62

Double Top — Bearish 65%Double Bottom — Bullish 65%Triangle — Neutral 65%Trendlines — Neutral 65%
20d: Sup ascending 7,687.09 (-1.5%) Res ascending 7,868.30 (+0.8%)
50d: Sup flat 7,509.47 (-3.8%) Res flat 7,847.54 (+0.5%)
S/R Levels
| R1 | 7,830.61 | +0.3% | ★★★★★ |
|
7,806.76
52W 6,316.91–7,844.52
|
| S1 | 6,528.86 | -16.4% | ★★★★★ |
| S2 | 6,753.48 | -13.5% | ★★★★☆ |
| S3 | 7,294.91 | -6.6% | ★★★☆☆ |
Moving Averages
| SMA 20 | 7,714.11 | above +1.2% |
| SMA 50 | 7,703.26 | above +1.3% |
| SMA 200 | 7,255.11 | above +7.6% |
Price above SMA20 & SMA50 — bullish structure
Price above SMA200 (+7.6%) — long-term uptrend
Analysis
The S&P 500 trades at 7,806.76, down 0.06%, showing mild bearish pressure near the R1 resistance at 7,830.61. The RSI-14 at 62 suggests moderate bullish momentum but approaches overbought territory. Price remains above all key SMAs (20, 50, 200), confirming a broader uptrend, though the repeated Double Top patterns (65% confidence) signal potential near-term reversal risks. Immediate support lies at 7,687.09 (20-day ascending trendline), while a break below 7,509.47 (50-day flat support) could accelerate selling. The convergence of resistance near 7,830–7,868 and bearish patterns warrants caution for bulls. Downside risks remain contained unless key supports at 7,294.91 or lower fail.
DOW
Dow Jones Industrial
51,842.57
▲0.36%
RSI 43

Double Top — Bearish 65%Double Bottom — Bullish 65%Trendlines — Neutral 65%
20d: Sup descending 50,143.05 (-3.3%) Res descending 51,891.20 (+0.1%)
50d: Sup descending 50,187.50 (-3.2%) Res descending 51,891.39 (+0.1%)
S/R Levels
| R1 | 54,744.33 | +5.6% | ★★★★★ |
| R2 | 53,819.65 | +3.8% | ★★★★☆ |
| R3 | 52,703.59 | +1.7% | ★★★☆☆ |
|
51,842.57
52W 45,057.28–54,744.33
|
| S1 | 45,274.29 | -12.7% | ★★★★★ |
| S2 | 48,127.01 | -7.2% | ★★★★☆ |
| S3 | 51,144.26 | -1.3% | ★★★☆☆ |
Moving Averages
| SMA 20 | 51,507.88 | above +0.6% |
| SMA 50 | 52,620.69 | below -1.5% |
| SMA 200 | 50,373.67 | above +2.9% |
Price between SMA20 and SMA50 — mixed signal
Price above SMA200 (+2.9%) — long-term uptrend
Analysis
The Dow Jones Industrial trades at 51,842.57, up 0.36%, while the RSI-14 at 43 suggests neutral momentum. Price remains below the SMA50 (52,620.69) but above the SMA20 (51,507.88) and SMA200 (50,373.67), indicating mixed signals. Immediate resistance is at 52,703.59, with support at 51,144.26. Three consecutive Double Top patterns (65% confidence each) reinforce bearish pressure, though confirmation requires a break below support. Short-term descending trendlines show resistance near 51,891, while support holds around 50,143. The index faces downward pressure from the bearish patterns but could stabilize if it holds above the SMA200. A decisive break below 51,144 may trigger further downside toward 48,127.01.
NDX
Nasdaq 100
30,679.62
▼0.66%
RSI 35

Double Top — Bearish 65%Double Bottom — Bullish 65%Trendlines — Neutral 65%
20d: Sup ascending 30,643.57 (-0.1%) Res ascending 31,600.44 (+3.0%)
50d: Sup ascending 29,081.27 (-5.2%) Res ascending 31,493.19 (+2.7%)
S/R Levels
| R1 | 31,361.37 | +2.2% | ★★★★★ |
| R2 | 30,766.42 | +0.3% | ★★★★☆ |
|
30,679.62
52W 22,841.42–31,361.37
|
| S1 | 22,863.22 | -25.5% | ★★★★★ |
| S2 | 24,234.50 | -21.0% | ★★★★☆ |
| S3 | 28,660.40 | -6.6% | ★★★☆☆ |
Moving Averages
| SMA 20 | 30,391.49 | above +0.9% |
| SMA 50 | 29,822.85 | above +2.9% |
| SMA 200 | 27,651.28 | above +11.0% |
Price above SMA20 & SMA50 — bullish structure
Price above SMA200 (+11.0%) — long-term uptrend
Analysis
The Nasdaq 100 trades at 30,679.62, down 0.66%, with the RSI-14 at 35 indicating nearing oversold conditions. The index remains above key SMAs (20d: 30,391.49, 50d: 29,822.85, 200d: 27,651.28), suggesting underlying support. Immediate resistance lies at R1 31,361.37, while support levels are S1 22,863.22, S2 24,234.50, and S3 28,660.40. Three consecutive double-top patterns at 65% confidence signal bearish pressure, though ascending trendlines provide near-term support at 30,643.57 (20d) and 29,081.27 (50d). The convergence of bearish patterns and weak momentum warrants caution, but holding above SMAs could prevent deeper declines. A break below 30,643.57 may accelerate selling toward 28,660.40.
NASDAQ
Nasdaq Composite
27,270.45
▼0.35%
RSI 43

Double Top — Bearish 65%Double Bottom — Bullish 65%Trendlines — Neutral 65%
20d: Sup ascending 27,229.32 (-0.2%) Res ascending 27,897.92 (+2.3%)
50d: Sup ascending 26,027.65 (-4.6%) Res ascending 27,815.95 (+2.0%)
S/R Levels
| R1 | 27,722.75 | +1.7% | ★★★★★ |
| R2 | 27,288.79 | +0.1% | ★★★★☆ |
|
27,270.45
52W 20,690.25–27,722.75
|
| S1 | 20,718.80 | -24.0% | ★★★★★ |
| S2 | 22,100.72 | -19.0% | ★★★★☆ |
| S3 | 25,787.44 | -5.4% | ★★★☆☆ |
Moving Averages
| SMA 20 | 26,959.93 | above +1.2% |
| SMA 50 | 26,600.91 | above +2.5% |
| SMA 200 | 24,856.27 | above +9.7% |
Price above SMA20 & SMA50 — bullish structure
Price above SMA200 (+9.7%) — long-term uptrend
Analysis
The Nasdaq Composite trades at 27,270.45, down 0.35%, with the RSI-14 at 43 indicating neutral momentum. Price remains above key SMAs (20d: 26,959.93; 50d: 26,600.91; 200d: 24,856.27), suggesting a bullish broader trend. However, three bearish Double Top patterns (65% confidence each) signal potential near-term weakness. Immediate resistance levels are R1 at 27,722.75 and R2 at 27,288.79, while supports sit at S3 (25,787.44), S2 (22,100.72), and S1 (20,718.80). The index tests a rising 20-day support at 27,229.32, with resistance at 27,897.92. A break below the 20-day SMA could confirm bearish pressure, while holding above maintains upside potential toward R1. Caution is warranted given the confluence of bearish patterns.
RUSSELL
Russell 2000
2,800.95
▼0.21%
RSI 36

Double Top — Bearish 65%Double Bottom — Bullish 65%Trendlines — Neutral 65%
20d: Sup descending 2,739.67 (-2.2%) Res descending 2,848.59 (+1.7%)
50d: Sup descending 2,749.57 (-1.8%) Res descending 2,842.09 (+1.5%)
S/R Levels
| R1 | 3,055.05 | +9.1% | ★★★★★ |
| R2 | 2,954.41 | +5.5% | ★★★★☆ |
| R3 | 2,886.44 | +3.1% | ★★★☆☆ |
|
2,800.95
52W 2,303.46–3,069.71
|
| S1 | 2,408.43 | -14.0% | ★★★★★ |
| S2 | 2,477.35 | -11.6% | ★★★★☆ |
| S3 | 2,591.57 | -7.5% | ★★★☆☆ |
Moving Averages
| SMA 20 | 2,833.81 | below -1.2% |
| SMA 50 | 2,928.40 | below -4.4% |
| SMA 200 | 2,790.17 | above +0.4% |
Price below SMA20 & SMA50 — bearish structure
Price above SMA200 (+0.4%) — long-term uptrend
Analysis
The Russell 2000 trades at 2,800.95, down 0.21%, with the RSI-14 at 36 indicating near-oversold conditions. The index remains below key SMAs (20d: 2,833.81; 50d: 2,928.40), reinforcing bearish near-term momentum, though the 200d SMA at 2,790.17 offers tentative support. Resistance levels are marked at R1 (3,055.05), R2 (2,954.41), and R3 (2,886.44), while support sits at S1 (2,408.43), S2 (2,477.35), and S3 (2,591.57). Three double-top patterns (65% confidence each) suggest further downside potential. Descending trendlines on the 20d (support: 2,739.67; resistance: 2,848.59) and 50d (support: 2,749.57; resistance: 2,842.09)
NYSE
NYSE Composite
23,987.97
▲0.20%
RSI 42

Double Top — Bearish 65%Double Bottom — Bullish 65%Flag — Bullish 65%Trendlines — Neutral 65%
20d: Sup descending 23,054.87 (-3.9%) Res descending 24,001.24 (+0.1%)
50d: Sup descending 23,206.98 (-3.3%) Res descending 24,126.42 (+0.6%)
S/R Levels
| R1 | 24,843.02 | +3.6% | ★★★★★ |
| R2 | 24,159.60 | +0.7% | ★★★★☆ |
|
23,987.97
52W 20,906.44–24,866.75
|
| S1 | 21,023.39 | -12.4% | ★★★★★ |
| S2 | 22,607.23 | -5.8% | ★★★★☆ |
| S3 | 23,206.97 | -3.3% | ★★★☆☆ |
Moving Averages
| SMA 20 | 23,855.99 | above +0.6% |
| SMA 50 | 24,282.11 | below -1.2% |
| SMA 200 | 23,351.83 | above +2.7% |
Price between SMA20 and SMA50 — mixed signal
Price above SMA200 (+2.7%) — long-term uptrend
Analysis
The NYSE Composite trades at 23,987.97, up 0.20%, with the RSI-14 at 42 indicating neutral momentum. Price remains below the SMA50 (24,282.11) but above the SMA20 (23,855.99) and SMA200 (23,351.83), reflecting mixed signals. Resistance levels are noted at R1 24,843.02 and R2 24,159.60, while support lies at S1 21,023.39, S2 22,607.23, and S3 23,206.97. A bearish Double Top pattern appears with 65% confidence, suggesting potential downside. Descending trendlines reinforce resistance near 24,001.24 (20-day) and 24,126.42 (50-day), while support trends downward at 23,054.87 (20-day) and 23,206.98 (50-day). The index shows caution amid bearish technical signals.
SP400
S&P 400 MidCap
3,662.05
▼0.19%
RSI 48

Double Top — Bearish 65%Double Bottom — Bullish 65%Triangle — Neutral 65%Flag — Bullish 65%Trendlines — Neutral 65%
20d: Sup descending 3,556.45 (-2.9%) Res ascending 3,723.06 (+1.7%)
50d: Sup descending 3,524.75 (-3.7%) Res descending 3,691.75 (+0.8%)
S/R Levels
| R1 | 3,928.98 | +7.3% | ★★★★★ |
| R2 | 3,829.75 | +4.6% | ★★★★☆ |
| R3 | 3,736.19 | +2.0% | ★★★☆☆ |
|
3,662.05
52W 3,107.41–3,928.98
|
| S1 | 3,093.00 | -15.5% | ★★★★★ |
| S2 | 3,288.34 | -10.2% | ★★★★☆ |
| S3 | 3,546.01 | -3.2% | ★★★☆☆ |
Moving Averages
| SMA 20 | 3,651.30 | above +0.3% |
| SMA 50 | 3,747.77 | below -2.3% |
| SMA 200 | 3,631.76 | above +0.8% |
Price between SMA20 and SMA50 — mixed signal
Price above SMA200 (+0.8%) — long-term uptrend
Analysis
The S&P 400 MidCap trades at 3,662.05, down 0.19%, with the RSI-14 at 48 indicating neutral momentum. The index remains above the SMA20 (3,651.30) but below the SMA50 (3,747.77), while the SMA200 (3,631.76) provides underlying support. Resistance levels are marked at 3,928.98 (R1), 3,829.75 (R2), and 3,736.19 (R3), while support lies at 3,546.01 (S3), 3,288.34 (S2), and 3,093.00 (S1). A bearish Double Top pattern appears with 65% confidence, signaling potential downside risk. Short-term trendlines show descending support at 3,556.45 (20d) and 3,524.75 (50d), with resistance at 3,723.06 (20d) and 3,691.75 (50d). The technical
Disclaimer
The content on MarketsFN.com is provided for educational and informational purposes only. It does not constitute financial advice or investment recommendations. All investments involve risks and past performance does not guarantee future results. You are solely responsible for your investment decisions.