USD/THB: Up 0.24% to 33.6020 — Ascending Channel
MarketsFN Team
USD/THB: Up 0.24% to 33.6020 — Ascending Channel
Published: October 12, 2026 · MarketsFN Team · US Session · Emerging FX
| Pair | Rate | Change | RSI(14) | SMA-20 | SMA-50 | 52W High | 52W Low | Pivot | R1 | S1 |
|---|---|---|---|---|---|---|---|---|---|---|
| USD/THB | 33.6020 | +0.24% | 63.2 | 33.3970 | 33.1369 | 33.7470 | 30.5160 | 33.4963 | 33.7757 | 33.2907 |
S/R Support & Resistance Levels
Dynamic Trendlines
| Level | Type | Direction | Distance |
|---|---|---|---|
| 33.0542 | 20d Support | up (ascending) | -1.63% / 5478.0 pips |
| 33.8701 | 20d Resistance | up (ascending) | +0.80% / 2680.6 pips |
| 32.9000 | 50d Support | up (ascending) | -2.09% / 7020.4 pips |
| 33.7496 | 50d Resistance | flat (flat) | +0.44% / 1475.8 pips |
Static Levels
| Level | Type | Touches | Distance |
|---|---|---|---|
| 32.4945 | Support | 2x | -3.06% / 10255.0 pips |
| 32.4505 | Support | 2x | -3.19% / 10695.0 pips |
| 32.2535 | Support | 2x | -3.78% / 12665.0 pips |
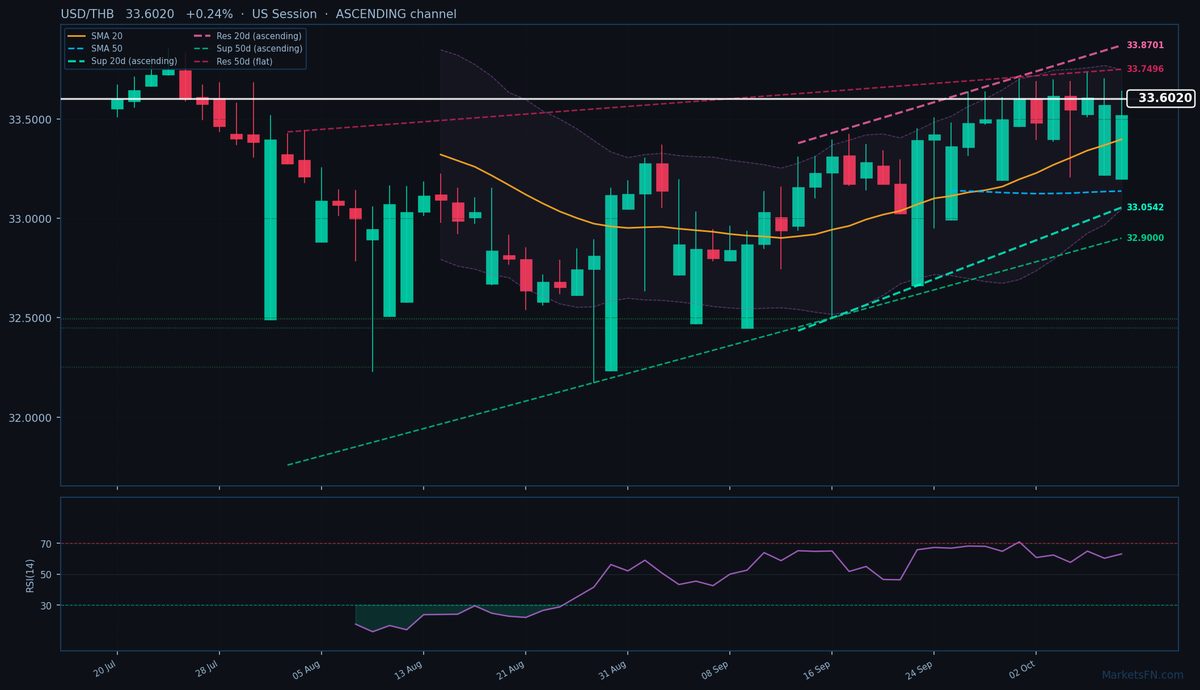
USD/THB is trading at 33.6020 (+0.24%), testing the upper bounds of its ascending channel as bullish momentum builds. The pair remains firmly above both the 20-day (33.3970) and 50-day (33.1369) SMAs, confirming the uptrend's structural integrity. Price action today has pushed to within 1475.8 pips of the 50-day dynamic resistance at 33.7496, while the ascending 20-day resistance looms just 2680.6 pips higher at 33.8701. Downside protection comes from the 20-day dynamic support at 33.0542 (-5478.0 pips), with the 50-day equivalent at 32.9000 (-7020.4 pips) providing a deeper floor.
Static levels show sparse nearby support, with S1 at 33.2907 (-3113.0 pips) as the nearest meaningful floor. The RSI at 63.2 suggests room for further upside before overbought territory, though the ATR of 0.3909 indicates today's range expansion may need consolidation. With the pair now just 144.5 pips shy of the 52-week high (33.7470), a breakout could trigger momentum buying toward the 20-day channel top.
The immediate test is whether European session flows can sustain pressure above the daily pivot (33.4963). A close above 33.6400 (today's high) would confirm bullish continuation, while failure to hold 33.2907 (S1) may signal exhaustion. Watch for a reaction at 33.7470 — a clean break there opens the path to test the 20-day dynamic resistance.
Disclaimer
The content on MarketsFN.com is provided for educational and informational purposes only and does not constitute financial advice. All investments involve risk and past performance does not guarantee future results.