USD/HUF: Down 0.06% to 326.43 — RSI Overbought
MarketsFN Team
USD/HUF: Down 0.06% to 326.43 — RSI Overbought
Published: October 12, 2026 · MarketsFN Team · US Session · Emerging FX
| Pair | Rate | Change | RSI(14) | SMA-20 | SMA-50 | 52W High | 52W Low | Pivot | R1 | S1 |
|---|---|---|---|---|---|---|---|---|---|---|
| USD/HUF | 326.43 | -0.06% | 76.0 | 321.37 | 316.58 | 343.74 | 300.33 | 326.31 | 327.45 | 324.34 |
S/R Support & Resistance Levels
Dynamic Trendlines
| Level | Type | Direction | Distance |
|---|---|---|---|
| 324.56 | 20d Support | up (ascending) | -0.57% / 187.6 pips |
| 334.08 | 20d Resistance | up (ascending) | +2.34% / 764.2 pips |
| 317.32 | 50d Support | up (ascending) | -2.79% / 911.3 pips |
| 331.44 | 50d Resistance | up (ascending) | +1.53% / 500.7 pips |
Static Levels
| Level | Type | Touches | Distance |
|---|---|---|---|
| 344.84 | Resistance | 2x | +5.57% / 1820.0 pips |
| 332.94 | Resistance | 2x | +1.93% / 630.5 pips |
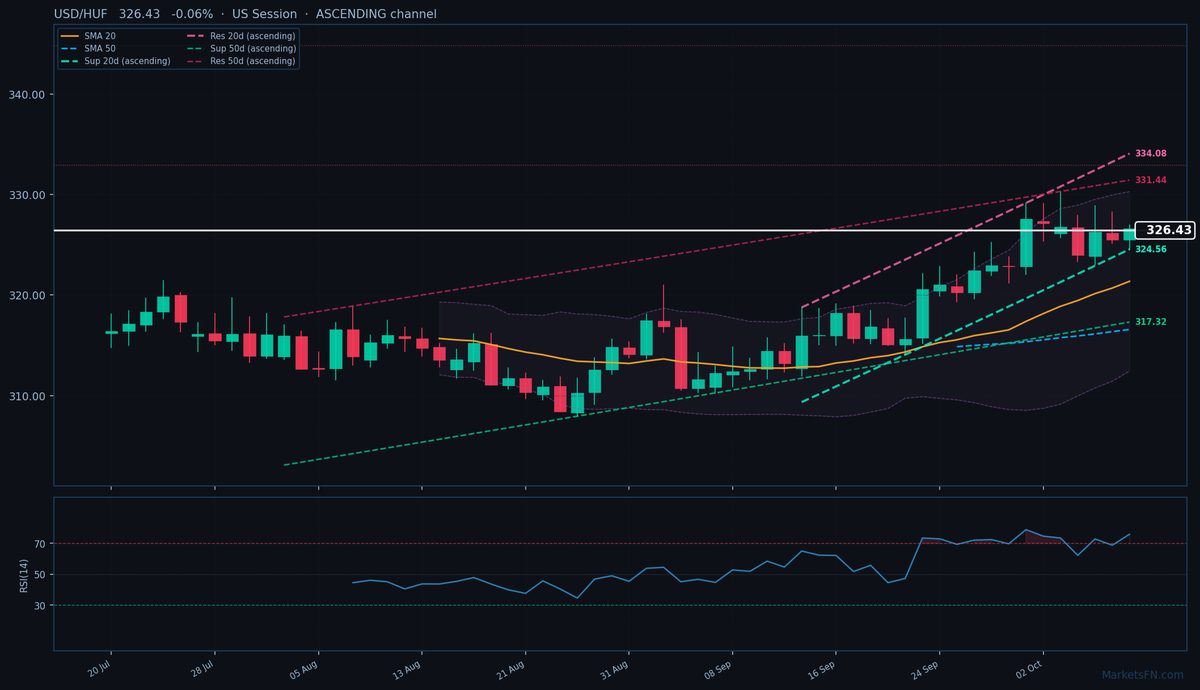
USD/HUF is trading at 326.43 (-0.06%), consolidating near the upper bounds of its bullish structure despite slight daily weakness. The pair remains firmly in an uptrend, trading above both the 20-day (321.37) and 50-day (316.58) SMAs, with the ascending dynamic channels reinforcing the bullish bias. The nearest dynamic support sits at 324.56 (-187.6 pips), while resistance looms at 334.08 (+764.2 pips) in the 20-day channel — both trendlines sloping upward. Static levels show immediate support at S1 (324.34, -209.0 pips) and resistance at R1 (327.45, +102.0 pips), with the pivot at 326.31 nearly coinciding with current trading.
The RSI at 76.0 flags overbought conditions, suggesting near-term exhaustion risks, but the sustained position above key moving averages and ascending channels indicates underlying strength. Today’s tight range (324.56–326.94) reflects hesitation after recent gains, though the 20-day ATR of 4.14 suggests volatility remains elevated.
Short-term, the pair may test dynamic resistance at 334.08 if bullish momentum resumes, but a pullback toward 324.56 (dynamic support) or 324.34 (static S1) could materialize if profit-taking accelerates. Confirmation of a reversal would require a break below the 20-day SMA (321.37), while a close above 327.45 (R1) would signal renewed upside. Watch for a potential RSI divergence or a break of the 20-day dynamic support trendline as early signs of fatigue. The European session’s price action will be critical to gauge near-term direction.
Disclaimer
The content on MarketsFN.com is provided for educational and informational purposes only and does not constitute financial advice. All investments involve risk and past performance does not guarantee future results.