USD/SGD: Down 0.06% to 1.2803 — Ascending Channel
MarketsFN Team
USD/SGD: Down 0.06% to 1.2803 — Ascending Channel
Published: October 12, 2026 · MarketsFN Team · US Session · Emerging FX
| Pair | Rate | Change | RSI(14) | SMA-20 | SMA-50 | 52W High | 52W Low | Pivot | R1 | S1 |
|---|---|---|---|---|---|---|---|---|---|---|
| USD/SGD | 1.2803 | -0.06% | 64.5 | 1.2769 | 1.2746 | 1.3075 | 1.2595 | 1.2804 | 1.2824 | 1.2782 |
S/R Support & Resistance Levels
Dynamic Trendlines
| Level | Type | Direction | Distance |
|---|---|---|---|
| 1.2775 | 20d Support | up (ascending) | -0.22% / 28.3 pips |
| 1.2834 | 20d Resistance | flat (flat) | +0.24% / 31.0 pips |
| 1.2600 | 50d Support | flat (flat) | -1.58% / 202.3 pips |
| 1.2825 | 50d Resistance | flat (flat) | +0.17% / 22.3 pips |
Static Levels
| Level | Type | Touches | Distance |
|---|---|---|---|
| 1.2936 | Resistance | 2x | +0.98% / 125.2 pips |
| 1.2899 | Resistance | 2x | +0.69% / 88.4 pips |
| 1.2840 | Resistance | 2x | +0.23% / 29.7 pips |
| 1.2805 | Support | 3x | -0.05% / 6.1 pips |
| 1.2788 | Support | 2x | -0.18% / 23.0 pips |
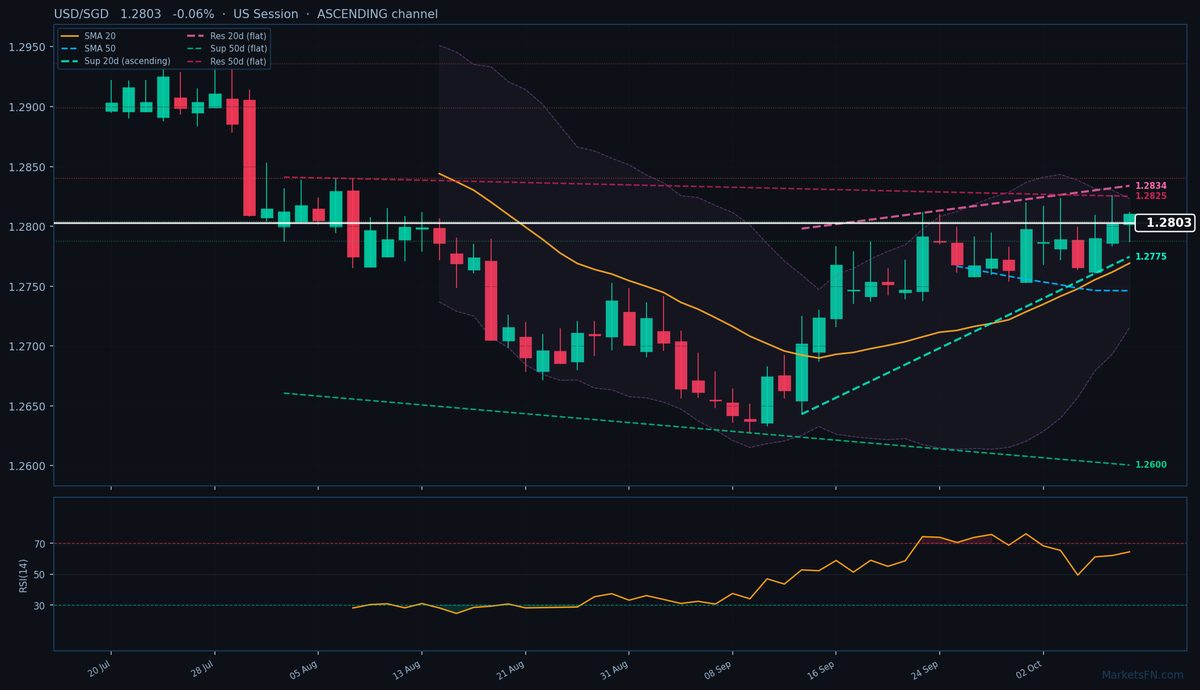
USD/SGD is trading at 1.2803 (-0.06%), hovering just below the pivot at 1.2804 as the pair consolidates within a bullish technical structure. The rate remains firmly above both the 20-day (1.2769) and 50-day (1.2746) SMAs, confirming the uptrend's integrity. However, today's narrow 24-pip range (1.2787-1.2811) suggests hesitation near static resistance at 1.2805 (just 6.1 pips above), which has rejected price three times previously.
The 20-day dynamic channel is ascending, with immediate support at 1.2775 (-28.3 pips) and resistance at 1.2834 (+31.0 pips). This upward-sloping channel aligns with the 50-day dynamic resistance at 1.2825 (+22.3 pips), creating a confluence zone that could cap near-term gains. RSI at 64.5 shows neutral momentum — neither overbought nor oversold — leaving room for continuation if buyers breach the 1.2825-1.2834 resistance cluster.
Key static levels to watch are S1 at 1.2788 (-23.0 pips) and R1 at 1.2840 (+29.7 pips). A break above 1.2834 would target the 1.2899 resistance (-88.4 pips), while failure to hold 1.2775 risks a test of the 20-day SMA at 1.2769. The short-term bias remains cautiously bullish given the ascending channel, but traders should watch for rejection at the 1.2825-1.2834 resistance band. Confirmation would come with a daily close above 1.2834, while a break below 1.2775 could signal exhaustion.
Disclaimer
The content on MarketsFN.com is provided for educational and informational purposes only and does not constitute financial advice. All investments involve risk and past performance does not guarantee future results.