USD/SGD: Down 0.06% to 1.2708 — RSI Oversold
MarketsFN Team
USD/SGD: Down 0.06% to 1.2708 — RSI Oversold
Published: August 27, 2026 · MarketsFN Team · US Session · Emerging FX
| Pair | Rate | Change | RSI(14) | SMA-20 | SMA-50 | 52W High | 52W Low | Pivot | R1 | S1 |
|---|---|---|---|---|---|---|---|---|---|---|
| USD/SGD | 1.2708 | -0.06% | 29.8 | 1.2769 | 1.2858 | 1.3075 | 1.2595 | 1.2695 | 1.2705 | 1.2676 |
S/R Support & Resistance Levels
Dynamic Trendlines
| Level | Type | Direction | Distance |
|---|---|---|---|
| 1.2657 | 20d Support | down (descending) | -0.40% / 51.2 pips |
| 1.2745 | 20d Resistance | down (descending) | +0.29% / 36.4 pips |
| 1.2664 | 50d Support | down (descending) | -0.35% / 44.6 pips |
| 1.2855 | 50d Resistance | down (descending) | +1.15% / 146.7 pips |
Static Levels
| Level | Type | Touches | Distance |
|---|---|---|---|
| 1.2936 | Resistance | 2x | +1.73% / 220.5 pips |
| 1.2899 | Resistance | 2x | +1.44% / 183.7 pips |
| 1.2840 | Resistance | 2x | +0.98% / 125.0 pips |
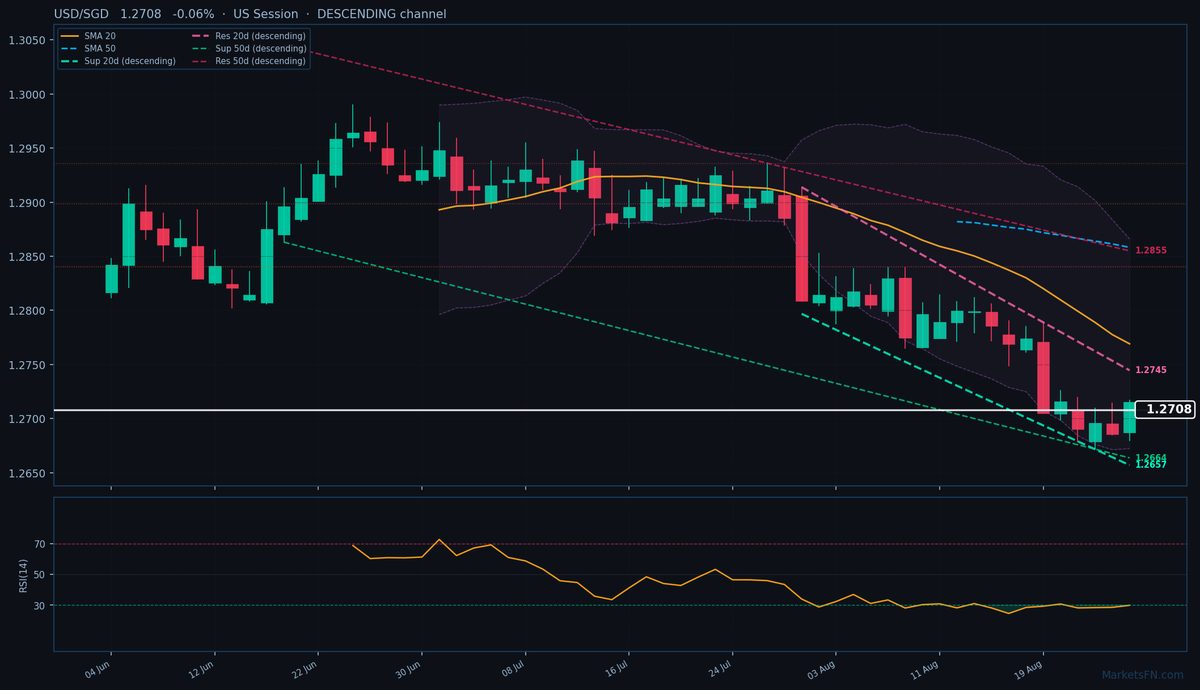
USD/SGD is trading at 1.2708 (-0.06%), pressing against the lower bounds of a well-defined descending channel as bearish momentum accelerates. The pair remains firmly below both the 20-day SMA (1.2769, 61.1 pips above) and 50-day SMA (1.2858, 150.0 pips above), confirming the downtrend's structural integrity. Price action is currently testing the 20-day dynamic support trendline at 1.2657 (51.2 pips below), while the descending 20-day dynamic resistance looms at 1.2745 (36.4 pips above) — a break above this level would challenge the bearish bias. Static support S1 at 1.2676 (32.0 pips below) aligns closely with the dynamic trendline, creating a confluence zone that could trigger a technical bounce if tested.
The RSI at 29.8 signals oversold conditions, but with the descending channel intact and no bullish divergence present, this reading alone isn't sufficient to call a reversal. Intraday traders should watch for rejection at S1 (1.2676) or the dynamic support (1.2657) for potential short-covering, while sustained breaks below would expose the 52-week low at 1.2595 (113.0 pips lower). The immediate upside is capped by R1 at 1.2705 (just 3.0 pips above current), though meaningful bullish momentum would require a close above the 20-day dynamic resistance at 1.2745.
Near-term direction hinges on whether the oversold RSI can catalyze a technical rebound within the descending channel, or if bearish momentum will force a breakdown of the 1.2657-1.2676 support cluster. A close above 1.2745 would signal short-term exhaustion, while failure at 1.2657 opens the path to 1.2595.
Disclaimer
The content on MarketsFN.com is provided for educational and informational purposes only and does not constitute financial advice. All investments involve risk and past performance does not guarantee future results.