USD/CHF: Down 0.12% to 0.8306 — Ascending Channel
MarketsFN Team
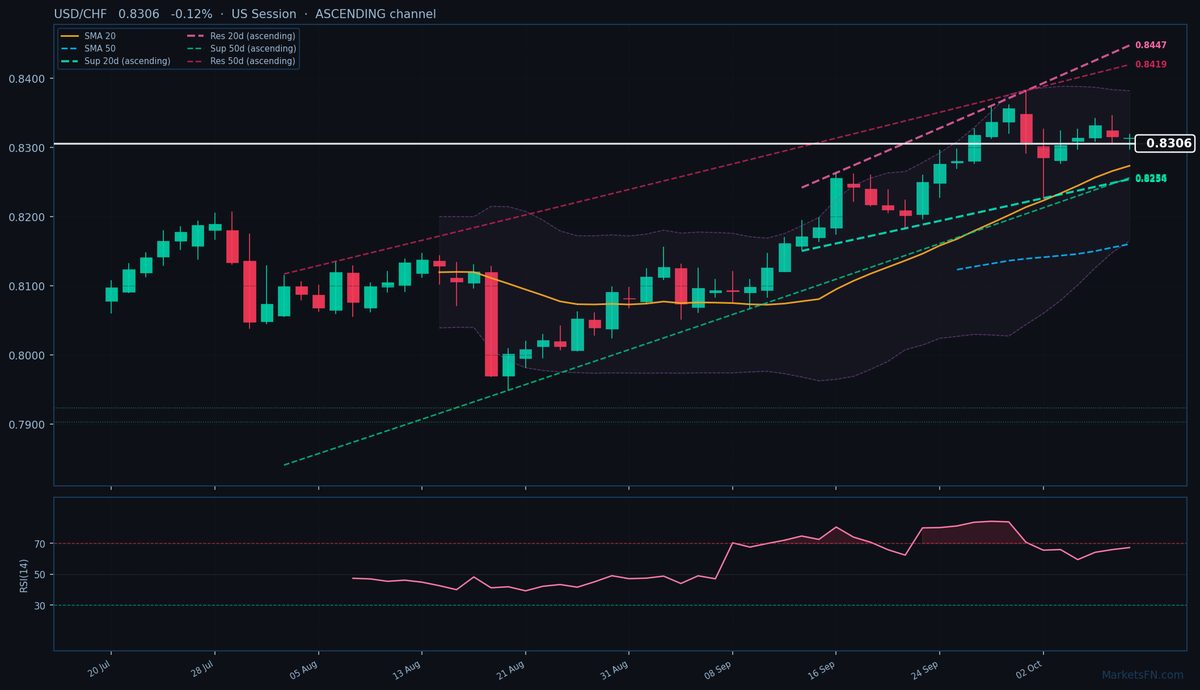
USD/CHF: Down 0.12% to 0.8306 — Ascending Channel
Published: October 09, 2026 · MarketsFN Team · US Session
| Pair | Rate | Change | RSI(14) | SMA-20 | SMA-50 | 52W High | 52W Low | Pivot | R1 | S1 |
|---|---|---|---|---|---|---|---|---|---|---|
| USD/CHF | 0.8306 | -0.12% | 67.3 | 0.8273 | 0.8160 | 0.8356 | 0.7609 | 0.8322 | 0.8339 | 0.8299 |
📊 Support & Resistance Levels
Dynamic Trendlines
| Level | Type | Direction | Distance |
|---|---|---|---|
| 0.8254 | 20d Support | ↗ ascending | -0.62% / 51.6 pips |
| 0.8447 | 20d Resistance | ↗ ascending | +1.71% / 141.8 pips |
| 0.8256 | 50d Support | ↗ ascending | -0.60% / 49.6 pips |
| 0.8419 | 50d Resistance | ↗ ascending | +1.37% / 113.9 pips |
Static Levels
| Level | Type | Touches | Distance |
|---|---|---|---|
| 0.7924 | Support | 2× | -4.68% / 389.3 pips |
| 0.7904 | Support | 2× | -4.93% / 409.9 pips |
USD/CHF is trading at 0.8306, down 0.12% on the day, as it consolidates near the upper end of its recent range. The currency pair remains in an uptrend, with the rate positioned above both the 20-day and 50-day simple moving averages at 0.8273 and 0.8160, respectively. The dynamic trendlines indicate an ascending 20-day and 50-day channel, with the rate currently situated between the 20-day dynamic support trendline at 0.8254, 51.6 pips away, and the 20-day dynamic resistance trendline at 0.8447, 141.8 pips away. The nearest static support level is S1 at 0.8299, just 7.3 pips below the current rate, while the closest static resistance is R1 at 0.8339, 33.3 pips above. The RSI(14) is at 67.3, indicating neutral territory and suggesting that the uptrend is not yet overextended. In the short term, the USD/CHF is likely to continue to trade within its established ascending channel, with a potential test of the 20-day dynamic resistance trendline at 0.8447, a move that would be +1.61% from the current rate. A break above this level could signal further upside, while a drop below the 20-day dynamic support trendline at 0.8254 would be a bearish signal. The next catalyst for the pair will be a test of the 0.8339 R1 level, a move that would confirm or invalidate the current uptrend.
Disclaimer
The content on MarketsFN.com is provided for educational and informational purposes only and does not constitute financial advice. All investments involve risk and past performance does not guarantee future results.