FX Evening Briefing — Fri 09 Oct 2026: AUD/JPY Closes Higher 0.58% — Asian Session Preview
MarketsFN FX Desk

Evening wrap-up for Friday 09 October 2026: as European markets close and the US session enters its final hours, G10 and emerging FX markets are closing with 15 pairs higher and 4 lower on the day. The standout movers are AUD/JPY (+0.58%), USD/TRY (+0.54%), USD/PLN (+0.51%). End-of-day flows — institutional rebalancing, month-end positioning and any late US data surprises — are the main drivers for tonight's Asian handoff.
This evening briefing includes the full day's economic calendar with all released actuals, final intraday pivot levels, and updated candlestick charts for all 19 pairs. Pivot levels will reset at tomorrow's EU open based on today's completed daily bars.
All pivot levels (R1 R2 R3 / S1 S2 S3) are computed from yesterday's full-session OHLC. Asian session key levels and carry trade dynamics are highlighted in each pair's analysis below.
Today's Economic Calendar — Full Day Results
| Time (UTC) | Event | CCY | Previous | Forecast | Actual |
|---|---|---|---|---|---|
| 07:00 | ● SECO Consumer Climate (Sep) | CHF | -33 | -32 | -36 |
| 12:00 | ● CPI (YoY) (Sep) | BRL | 4.22% | 4.50% | 4.58% |
| 12:30 | ● Employment Change (Sep) | CAD | -41.7K | 6.1K | -68.3K |
| 12:30 | ● Unemployment Rate (Sep) | CAD | 6.4% | 6.5% | 6.5% |
| 13:30 | ● ECB's Schnabel Speaks | EUR | — | — | — |
| 14:00 | ● Michigan 1-Year Inflation Expectations (Oct) | USD | 4.6% | 4.8% | 4.7% |
| 14:00 | ● Michigan 5-Year Inflation Expectations (Oct) | USD | 3.4% | 3.5% | 3.5% |
| 14:00 | ● Michigan Consumer Expectations (Oct) | USD | 46.3 | 45.9 | 47.3 |
| 14:00 | ● Michigan Consumer Sentiment (Oct) | USD | 48.1 | 47.5 | 46.3 |
| 16:00 | ● WASDE Report | USD | — | — | — |
| 16:00 | ● CPI (MoM) (Sep) | RUB | -0.1% | — | 0.3% |
| 16:00 | ● CPI (YoY) (Sep) | RUB | 6.3% | — | 6.3% |
| 17:00 | ● U.S. Baker Hughes Oil Rig Count | USD | 456 | — | 462 |
| 17:00 | ● U.S. Baker Hughes Total Rig Count | USD | 598 | — | 603 |
| 19:30 | ● CFTC GBP speculative net positions | GBP | -91.1K | — | — |
| 19:30 | ● CFTC Crude Oil speculative net positions | USD | 109.5K | — | — |
| 19:30 | ● CFTC Gold speculative net positions | USD | 218.6K | — | — |
| 19:30 | ● CFTC Nasdaq 100 speculative net positions | USD | 51.2K | — | — |
| 19:30 | ● CFTC S&P 500 speculative net positions | USD | -142.5K | — | — |
| 19:30 | ● CFTC AUD speculative net positions | AUD | -63.2K | — | — |
| 19:30 | ● CFTC BRL speculative net positions | BRL | 60.5K | — | — |
| 19:30 | ● CFTC JPY speculative net positions | JPY | 55.4K | — | — |
| 19:30 | ● CFTC EUR speculative net positions | EUR | -63.3K | — | — |
Major Pairs
EUR/USD
1.1198 ▼0.10% Day H 1.1242 / L 1.1187 52W 1.1161–1.2082
| R3 | R2 | R1 | S1 | S2 | S3 |
|---|---|---|---|---|---|
| 1.1288 | 1.1257 | 1.1233 | 1.1178 | 1.1147 | 1.1123 |
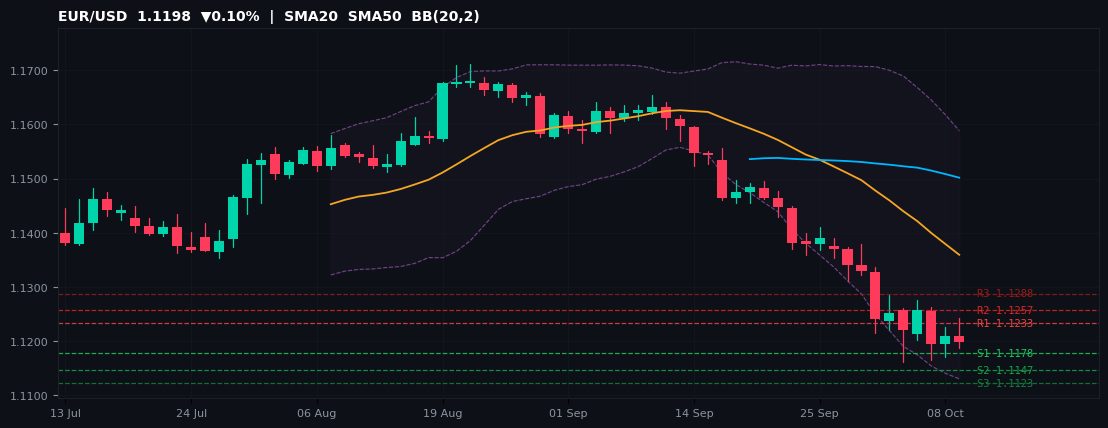
End-of-day snapshot for EUR/USD: closing at 1.1198 (-0.10% on the day), just 0.33% above its 52-week floor at 1.1161. Today's full-session range of 1.1187–1.1242 (0.0055 points). The daily close below the pivot (1.1202) signals bearish momentum into tomorrow's Asian open.
For tomorrow's Asian open, the key pivot reference levels remain: R1 1.1233 / R2 1.1257 / R3 1.1288 on the upside and S1 1.1178 / S2 1.1147 / S3 1.1123 on the downside. Asian session liquidity is typically thinner, so gaps through pivot levels should be monitored carefully.
EUR/USD finishes the day the annual support is under watch — a close below would reset the technical outlook bearish. The 52-week range of 1.1161–1.2082 places the pair at the 4th percentile. Key overnight risk: Asian economic data and any after-hours US developments that could reprice the USD complex before London re-opens.
EUR/USDRangeboundNear 52W Low
GBP/USD
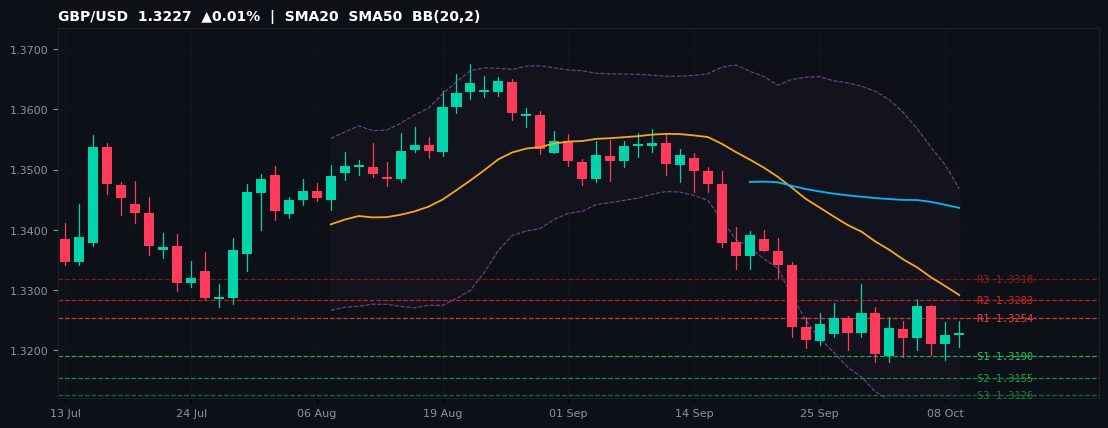
1.3227 ▲0.01% Day H 1.3249 / L 1.3205 52W 1.3009–1.3868
| R3 | R2 | R1 | S1 | S2 | S3 |
|---|---|---|---|---|---|
| 1.3318 | 1.3283 | 1.3254 | 1.3190 | 1.3155 | 1.3126 |
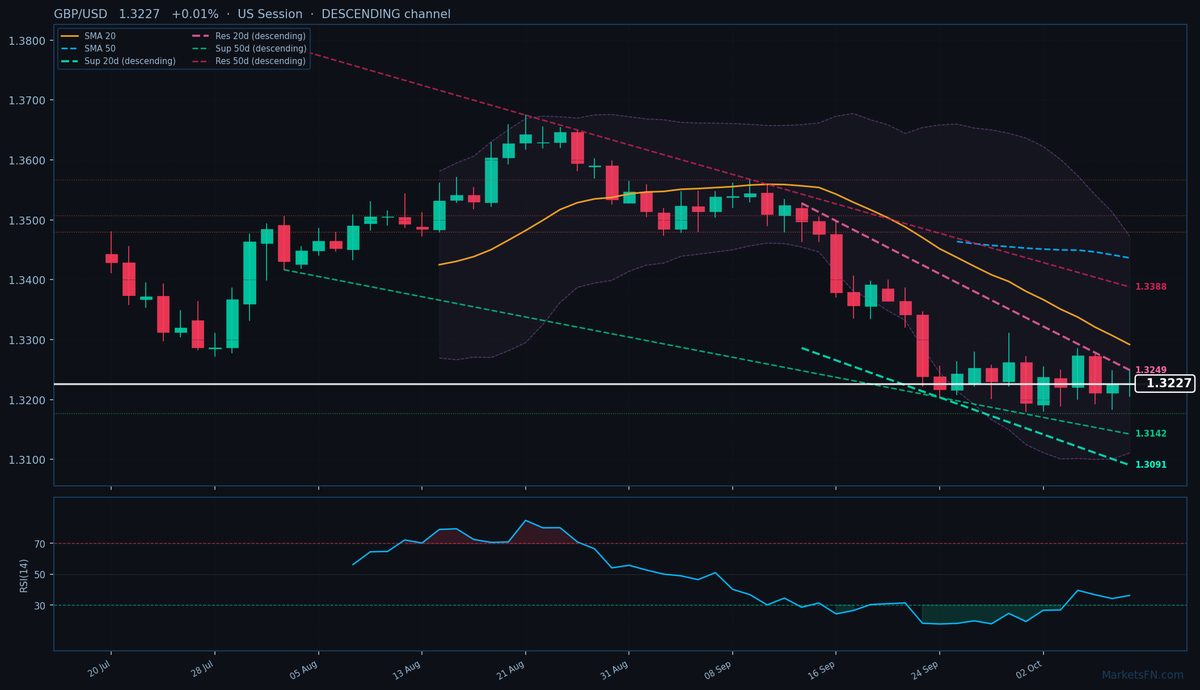
End-of-day snapshot for GBP/USD: closing at 1.3227 (+0.01% on the day), at the 25th percentile of its 1.3009–1.3868 52-week range. Today's full-session range of 1.3205–1.3249 (0.0045 points). The daily close above the pivot (1.3219) signals bullish continuation into tomorrow's Asian open.
For tomorrow's Asian open, the key pivot reference levels remain: R1 1.3254 / R2 1.3283 / R3 1.3318 on the upside and S1 1.3190 / S2 1.3155 / S3 1.3126 on the downside. Asian session liquidity is typically thinner, so gaps through pivot levels should be monitored carefully.
GBP/USD finishes the day the pair is ending the day in the lower half of its annual range, keeping bears in control. The 52-week range of 1.3009–1.3868 places the pair at the 25th percentile. Key overnight risk: Asian economic data and any after-hours US developments that could reprice the USD complex before London re-opens.
GBP/USDRangebound
USD/JPY
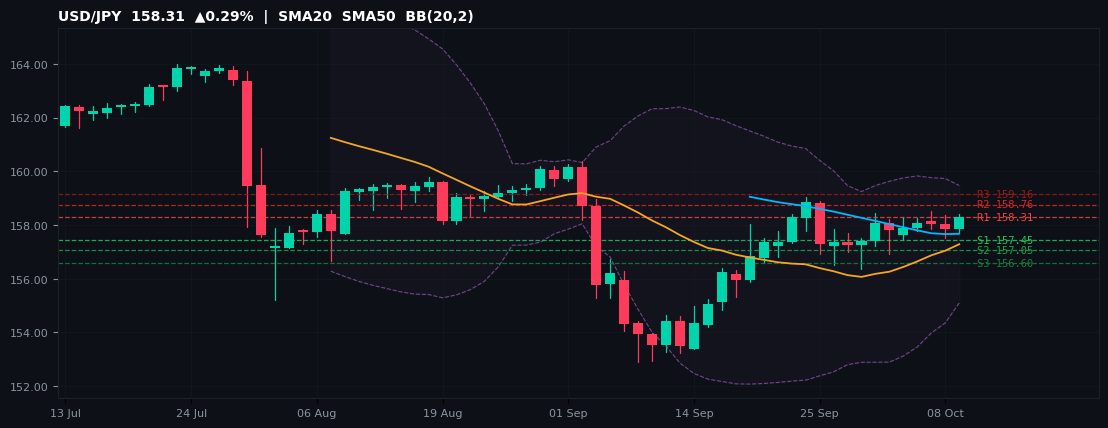
158.31 ▲0.29% Day H 158.43 / L 157.75 52W 150.47–163.98
| R3 | R2 | R1 | S1 | S2 | S3 |
|---|---|---|---|---|---|
| 159.16 | 158.76 | 158.31 | 157.45 | 157.05 | 156.60 |
End-of-day snapshot for USD/JPY: closing at 158.31 (+0.29% on the day), at the 58th percentile of its 150.47–163.98 52-week range. Today's full-session range of 157.75–158.43 (0.67 points). The daily close above the pivot (157.91) signals bullish continuation into tomorrow's Asian open.
For tomorrow's Asian open, the key pivot reference levels remain: R1 158.31 / R2 158.76 / R3 159.16 on the upside and S1 157.45 / S2 157.05 / S3 156.60 on the downside. Asian session liquidity is typically thinner, so gaps through pivot levels should be monitored carefully.
USD/JPY finishes the day the pair is closing in the upper half of its annual range, a constructive sign for bulls. The 52-week range of 150.47–163.98 places the pair at the 58th percentile. Key overnight risk: Asian economic data and any after-hours US developments that could reprice the USD complex before London re-opens.
USD/JPYRangeboundAbove R1
USD/CHF
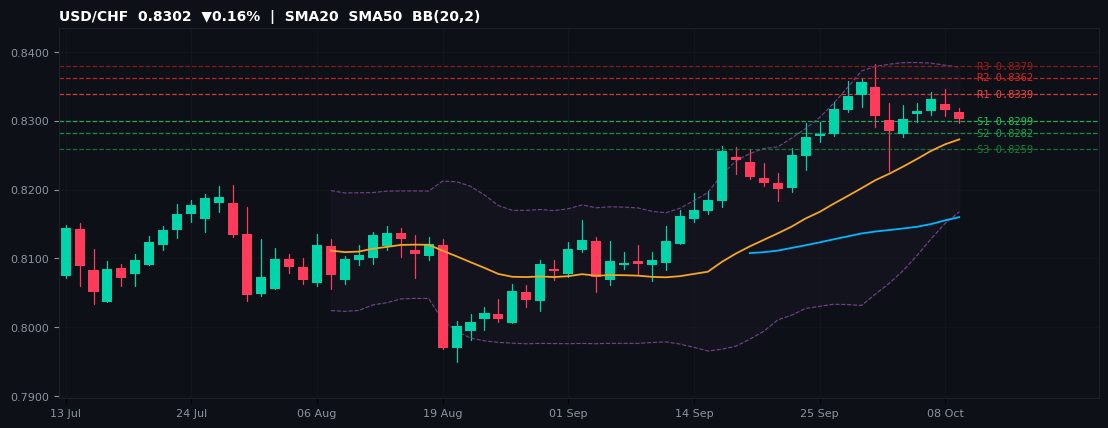
0.8302 ▼0.16% Day H 0.8318 / L 0.8297 52W 0.7602–0.8382
| R3 | R2 | R1 | S1 | S2 | S3 |
|---|---|---|---|---|---|
| 0.8379 | 0.8362 | 0.8339 | 0.8299 | 0.8282 | 0.8259 |
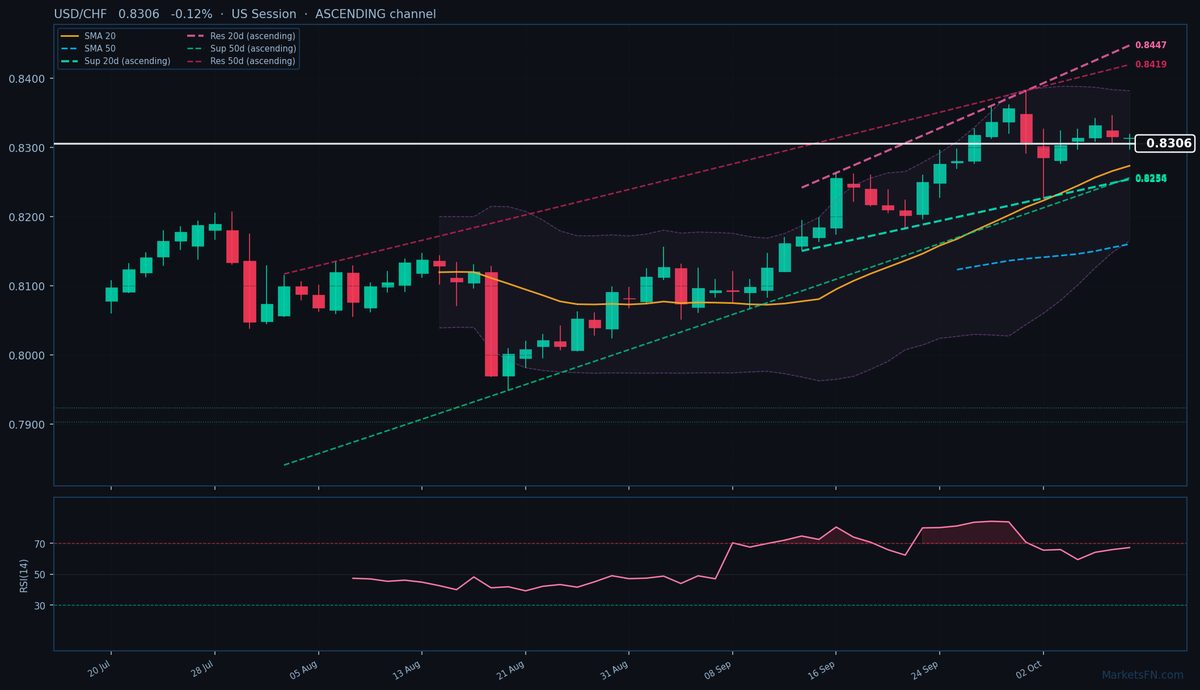
End-of-day snapshot for USD/CHF: closing at 0.8302 (-0.16% on the day), just 0.96% below its 52-week high of 0.8382. Today's full-session range of 0.8297–0.8318 (0.0021 points). The daily close below the pivot (0.8322) signals bearish momentum into tomorrow's Asian open.
For tomorrow's Asian open, the key pivot reference levels remain: R1 0.8339 / R2 0.8362 / R3 0.8379 on the upside and S1 0.8299 / S2 0.8282 / S3 0.8259 on the downside. Asian session liquidity is typically thinner, so gaps through pivot levels should be monitored carefully.
USD/CHF finishes the day the trend is intact; bulls will target a break above the annual high on the next catalyst. The 52-week range of 0.7602–0.8382 places the pair at the 90th percentile. Key overnight risk: Asian economic data and any after-hours US developments that could reprice the USD complex before London re-opens.
USD/CHFRangeboundNear 52W High
AUD/USD
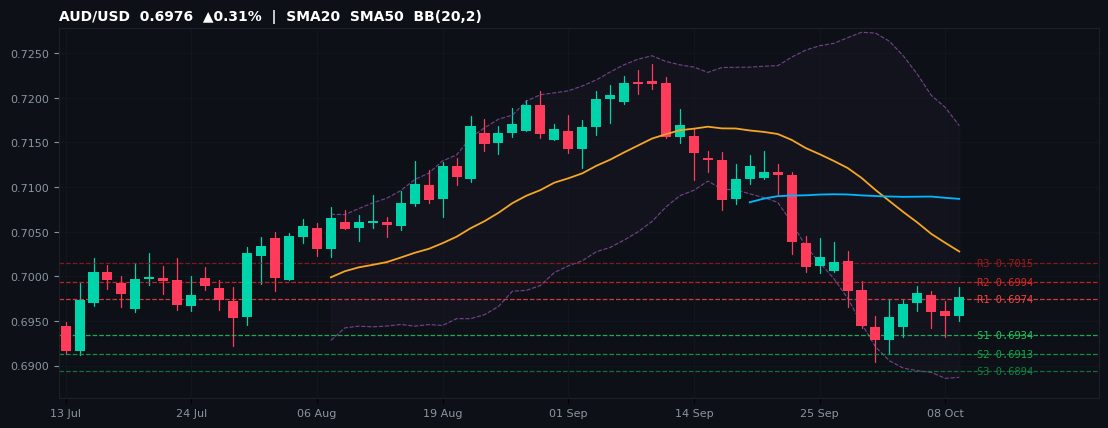
0.6976 ▲0.31% Day H 0.6988 / L 0.6950 52W 0.6421–0.7277
| R3 | R2 | R1 | S1 | S2 | S3 |
|---|---|---|---|---|---|
| 0.7015 | 0.6994 | 0.6974 | 0.6934 | 0.6913 | 0.6894 |
End-of-day snapshot for AUD/USD: closing at 0.6976 (+0.31% on the day), at the 65th percentile of its 0.6421–0.7277 52-week range. Today's full-session range of 0.6950–0.6988 (0.0038 points). The daily close above the pivot (0.6953) signals bullish continuation into tomorrow's Asian open.
For tomorrow's Asian open, the key pivot reference levels remain: R1 0.6974 / R2 0.6994 / R3 0.7015 on the upside and S1 0.6934 / S2 0.6913 / S3 0.6894 on the downside. Asian session liquidity is typically thinner, so gaps through pivot levels should be monitored carefully.
AUD/USD finishes the day the pair is closing in the upper half of its annual range, a constructive sign for bulls. The 52-week range of 0.6421–0.7277 places the pair at the 65th percentile. Key overnight risk: Asian economic data and any after-hours US developments that could reprice the USD complex before London re-opens.
AUD/USDBullishAbove R1
NZD/USD
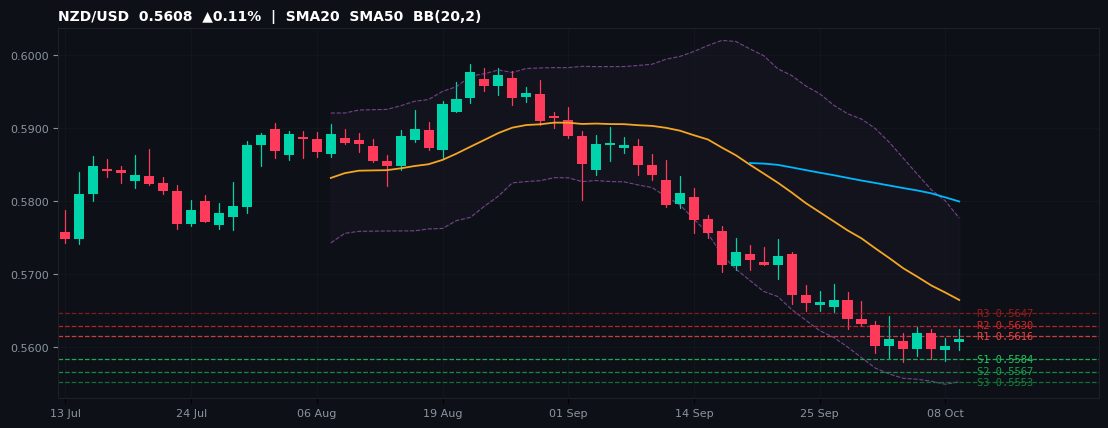
0.5608 ▲0.11% Day H 0.5626 / L 0.5597 52W 0.5576–0.6092
| R3 | R2 | R1 | S1 | S2 | S3 |
|---|---|---|---|---|---|
| 0.5647 | 0.5630 | 0.5616 | 0.5584 | 0.5567 | 0.5553 |
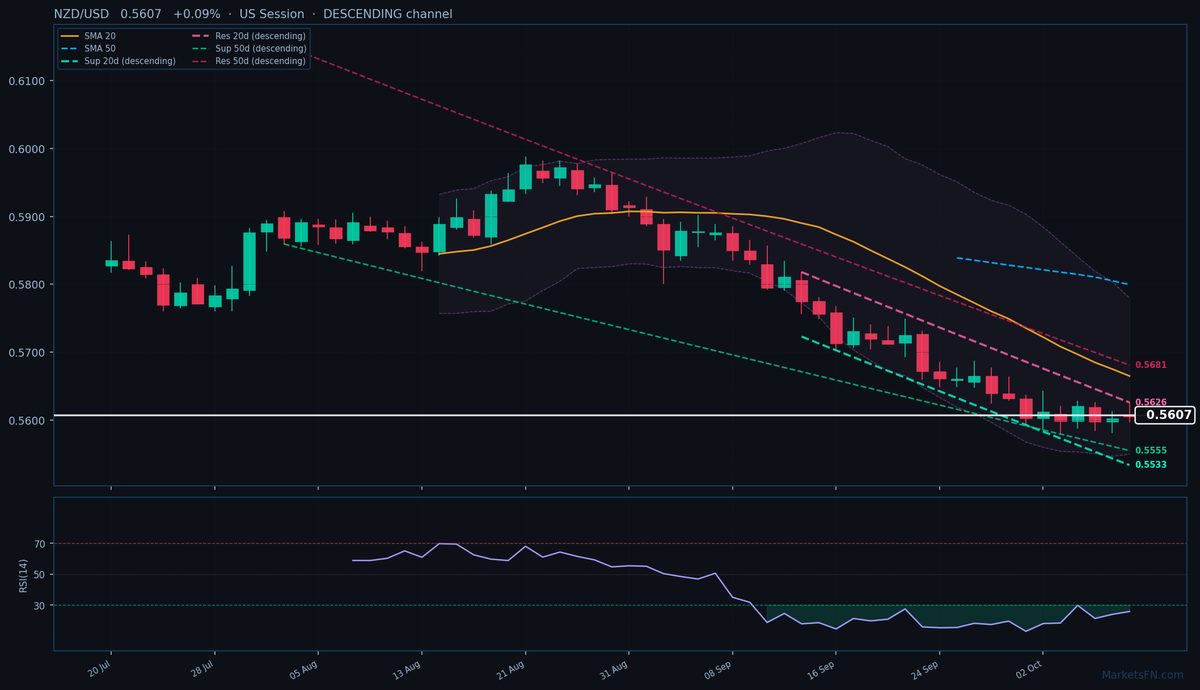
End-of-day snapshot for NZD/USD: closing at 0.5608 (+0.11% on the day), just 0.57% above its 52-week floor at 0.5576. Today's full-session range of 0.5597–0.5626 (0.0029 points). The daily close above the pivot (0.5598) signals bullish continuation into tomorrow's Asian open.
For tomorrow's Asian open, the key pivot reference levels remain: R1 0.5616 / R2 0.5630 / R3 0.5647 on the upside and S1 0.5584 / S2 0.5567 / S3 0.5553 on the downside. Asian session liquidity is typically thinner, so gaps through pivot levels should be monitored carefully.
NZD/USD finishes the day the annual support is under watch — a close below would reset the technical outlook bearish. The 52-week range of 0.5576–0.6092 places the pair at the 6th percentile. Key overnight risk: Asian economic data and any after-hours US developments that could reprice the USD complex before London re-opens.
NZD/USDRangeboundNear 52W Low
USD/CAD
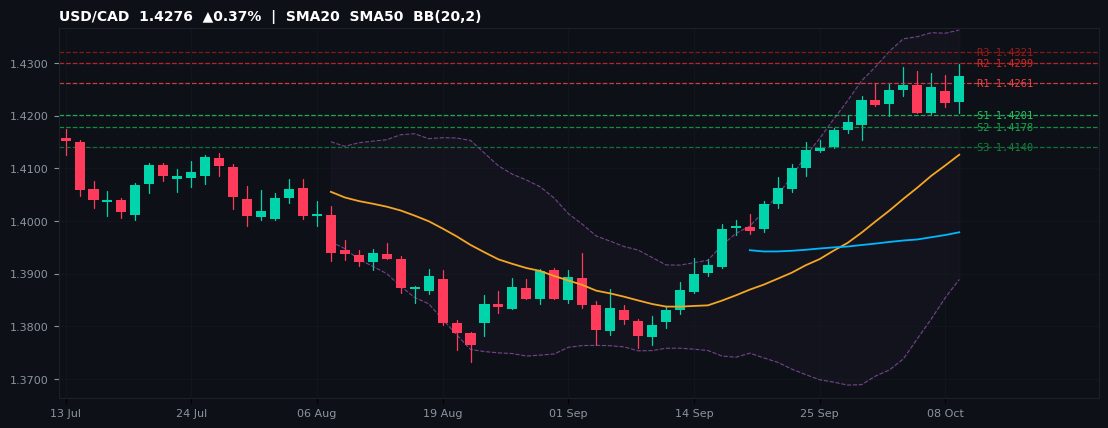
1.4276 ▲0.37% Day H 1.4297 / L 1.4206 52W 1.3480–1.4297
| R3 | R2 | R1 | S1 | S2 | S3 |
|---|---|---|---|---|---|
| 1.4321 | 1.4299 | 1.4261 | 1.4201 | 1.4178 | 1.4140 |
End-of-day snapshot for USD/CAD: closing at 1.4276 (+0.37% on the day), just 0.15% below its 52-week high of 1.4297. Today's full-session range of 1.4206–1.4297 (0.0092 points). The daily close above the pivot (1.4239) signals bullish continuation into tomorrow's Asian open.
For tomorrow's Asian open, the key pivot reference levels remain: R1 1.4261 / R2 1.4299 / R3 1.4321 on the upside and S1 1.4201 / S2 1.4178 / S3 1.4140 on the downside. Asian session liquidity is typically thinner, so gaps through pivot levels should be monitored carefully.
USD/CAD finishes the day the trend is intact; bulls will target a break above the annual high on the next catalyst. The 52-week range of 1.3480–1.4297 places the pair at the 97th percentile. Key overnight risk: Asian economic data and any after-hours US developments that could reprice the USD complex before London re-opens.
USD/CADBullishAbove R1Near 52W High
📚 Book Insights
If You Believe Markets Are Efficient, Do Not Read This
A practitioner's guide to structural market inefficiencies — how central bank policy divergence, carry dynamics, and cross-asset flows create durable FX trading edges that efficient-market theorists systematically underestimate.
Read the analysis →Cross Pairs
EUR/GBP
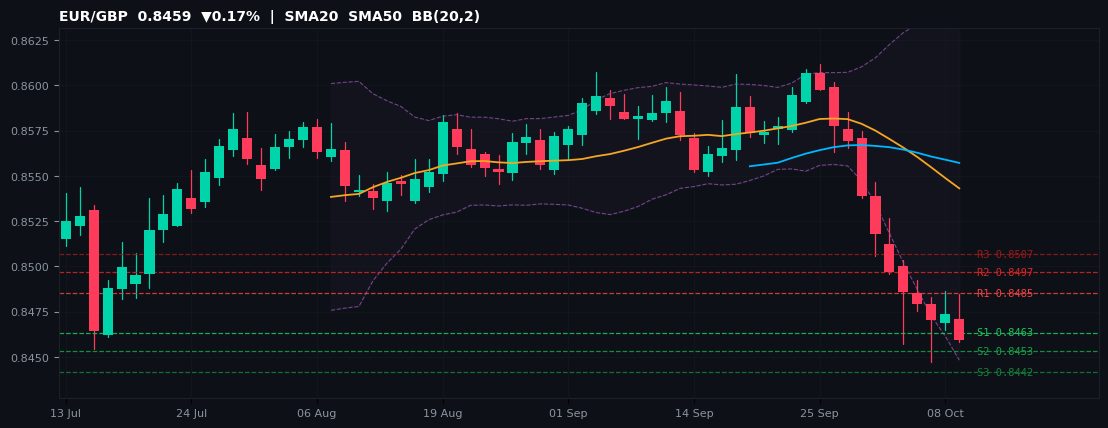
0.8459 ▼0.17% Day H 0.8485 / L 0.8458 52W 0.8447–0.8865
| R3 | R2 | R1 | S1 | S2 | S3 |
|---|---|---|---|---|---|
| 0.8507 | 0.8497 | 0.8485 | 0.8463 | 0.8453 | 0.8442 |
End-of-day snapshot for EUR/GBP: closing at 0.8459 (-0.17% on the day), just 0.14% above its 52-week floor at 0.8447. Today's full-session range of 0.8458–0.8485 (0.0027 points). The daily close below the pivot (0.8475) signals bearish momentum into tomorrow's Asian open.
For tomorrow's Asian open, the key pivot reference levels remain: R1 0.8485 / R2 0.8497 / R3 0.8507 on the upside and S1 0.8463 / S2 0.8453 / S3 0.8442 on the downside. Asian session liquidity is typically thinner, so gaps through pivot levels should be monitored carefully.
EUR/GBP finishes the day the annual support is under watch — a close below would reset the technical outlook bearish. The 52-week range of 0.8447–0.8865 places the pair at the 3th percentile. Key overnight risk: Asian economic data and any after-hours US developments that could reprice the USD complex before London re-opens.
EUR/GBPRangeboundBelow S1Near 52W Low
EUR/JPY
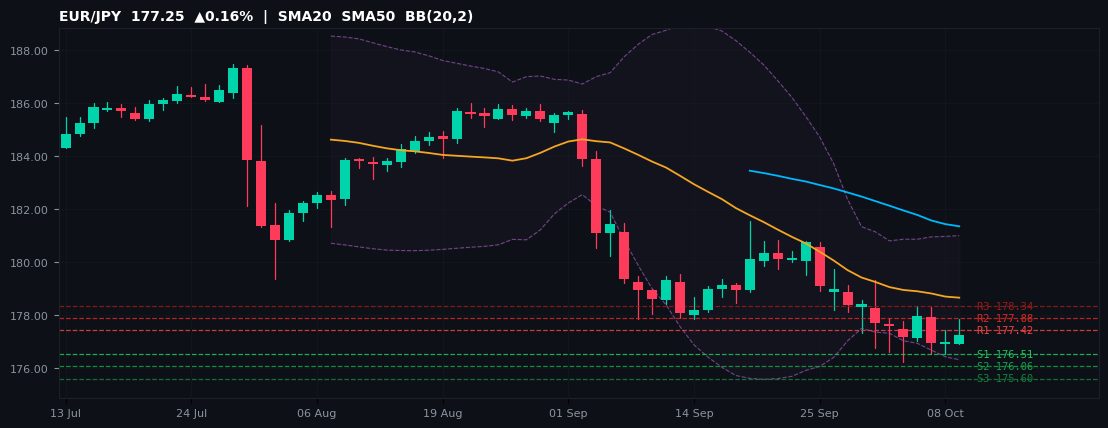
177.25 ▲0.16% Day H 177.86 / L 176.89 52W 175.28–187.94
| R3 | R2 | R1 | S1 | S2 | S3 |
|---|---|---|---|---|---|
| 178.34 | 177.88 | 177.42 | 176.51 | 176.06 | 175.60 |
End-of-day snapshot for EUR/JPY: closing at 177.25 (+0.16% on the day), just 1.12% above its 52-week floor at 175.28. Today's full-session range of 176.89–177.86 (0.97 points). The daily close above the pivot (176.97) signals bullish continuation into tomorrow's Asian open.
For tomorrow's Asian open, the key pivot reference levels remain: R1 177.42 / R2 177.88 / R3 178.34 on the upside and S1 176.51 / S2 176.06 / S3 175.60 on the downside. Asian session liquidity is typically thinner, so gaps through pivot levels should be monitored carefully.
EUR/JPY finishes the day the annual support is under watch — a close below would reset the technical outlook bearish. The 52-week range of 175.28–187.94 places the pair at the 16th percentile. Key overnight risk: Asian economic data and any after-hours US developments that could reprice the USD complex before London re-opens.
EUR/JPYRangeboundNear 52W Low
GBP/JPY
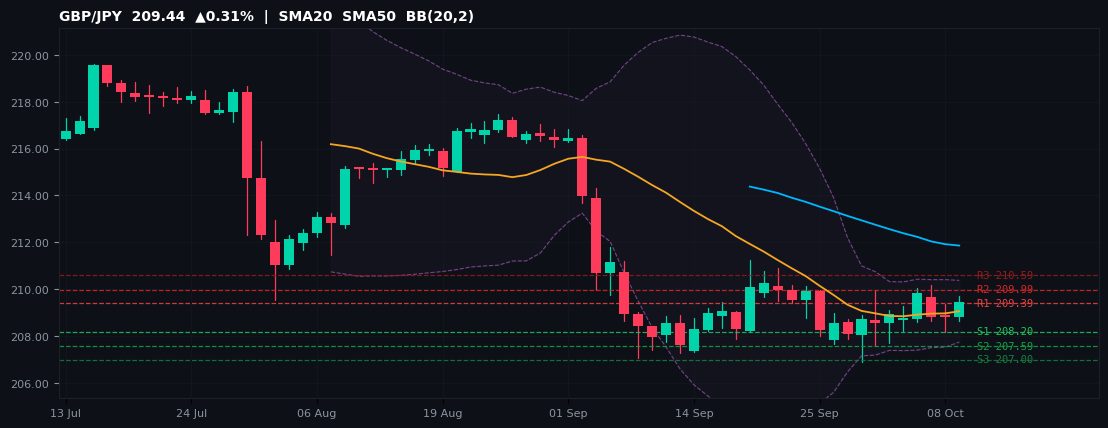
209.44 ▲0.31% Day H 209.73 / L 208.63 52W 199.06–219.60
| R3 | R2 | R1 | S1 | S2 | S3 |
|---|---|---|---|---|---|
| 210.59 | 209.99 | 209.39 | 208.20 | 207.59 | 207.00 |
End-of-day snapshot for GBP/JPY: closing at 209.44 (+0.31% on the day), at the 51th percentile of its 199.06–219.60 52-week range. Today's full-session range of 208.63–209.73 (1.10 points). The daily close above the pivot (208.79) signals bullish continuation into tomorrow's Asian open.
For tomorrow's Asian open, the key pivot reference levels remain: R1 209.39 / R2 209.99 / R3 210.59 on the upside and S1 208.20 / S2 207.59 / S3 207.00 on the downside. Asian session liquidity is typically thinner, so gaps through pivot levels should be monitored carefully.
GBP/JPY finishes the day the pair is closing in the upper half of its annual range, a constructive sign for bulls. The 52-week range of 199.06–219.60 places the pair at the 51th percentile. Key overnight risk: Asian economic data and any after-hours US developments that could reprice the USD complex before London re-opens.
GBP/JPYBullishAbove R1
AUD/JPY
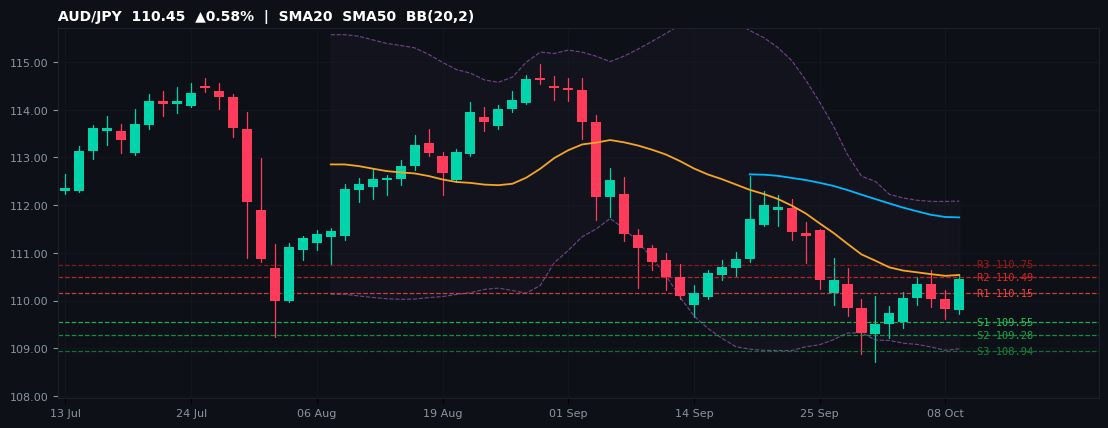
110.45 ▲0.58% Day H 110.55 / L 109.72 52W 97.91–114.95
| R3 | R2 | R1 | S1 | S2 | S3 |
|---|---|---|---|---|---|
| 110.75 | 110.49 | 110.15 | 109.55 | 109.28 | 108.94 |
End-of-day snapshot for AUD/JPY: closing at 110.45 (+0.58% on the day), at the 74th percentile of its 97.91–114.95 52-week range. Today's full-session range of 109.72–110.55 (0.83 points). The daily close above the pivot (109.88) signals bullish continuation into tomorrow's Asian open.
For tomorrow's Asian open, the key pivot reference levels remain: R1 110.15 / R2 110.49 / R3 110.75 on the upside and S1 109.55 / S2 109.28 / S3 108.94 on the downside. Asian session liquidity is typically thinner, so gaps through pivot levels should be monitored carefully.
AUD/JPY finishes the day the pair is closing in the upper half of its annual range, a constructive sign for bulls. The 52-week range of 97.91–114.95 places the pair at the 74th percentile. Key overnight risk: Asian economic data and any after-hours US developments that could reprice the USD complex before London re-opens.
AUD/JPYBullishAbove R1
🏭 Forex Course — Quick Quiz
Test Your Knowledge on Today's Key Themes
Five questions on carry trade dynamics, central bank divergence, commodity-currency correlations and technical extremes. Instant results, mobile-friendly.
Start the Quiz →Nordic Pairs
USD/NOK
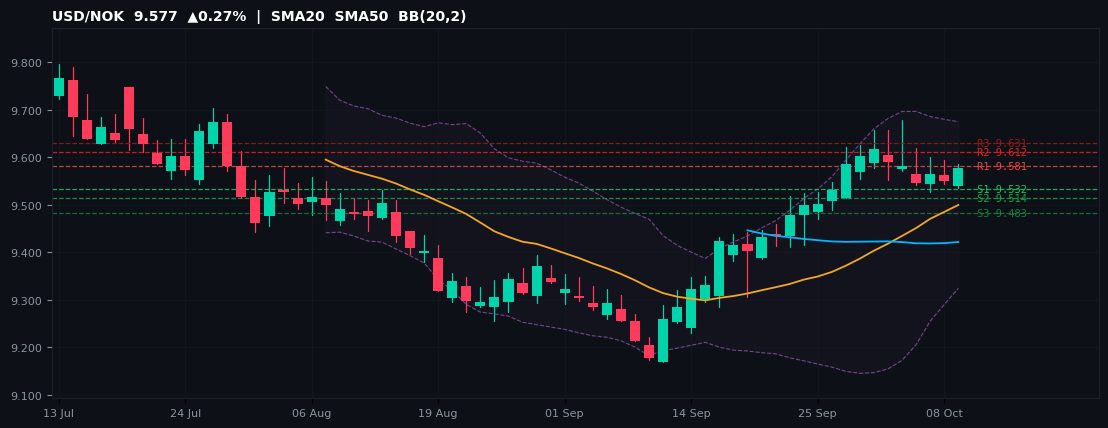
9.577 ▲0.27% Day H 9.587 / L 9.535 52W 9.144–10.297
| R3 | R2 | R1 | S1 | S2 | S3 |
|---|---|---|---|---|---|
| 9.631 | 9.612 | 9.581 | 9.532 | 9.514 | 9.483 |
End-of-day snapshot for USD/NOK: closing at 9.577 (+0.27% on the day), at the 38th percentile of its 9.144–10.297 52-week range. Today's full-session range of 9.535–9.587 (0.052 points). The daily close above the pivot (9.563) signals bullish continuation into tomorrow's Asian open.
For tomorrow's Asian open, the key pivot reference levels remain: R1 9.581 / R2 9.612 / R3 9.631 on the upside and S1 9.532 / S2 9.514 / S3 9.483 on the downside. Asian session liquidity is typically thinner, so gaps through pivot levels should be monitored carefully.
USD/NOK finishes the day the pair is ending the day in the lower half of its annual range, keeping bears in control. The 52-week range of 9.144–10.297 places the pair at the 38th percentile. Key overnight risk: Asian economic data and any after-hours US developments that could reprice the USD complex before London re-opens.
USD/NOKRangebound
USD/SEK
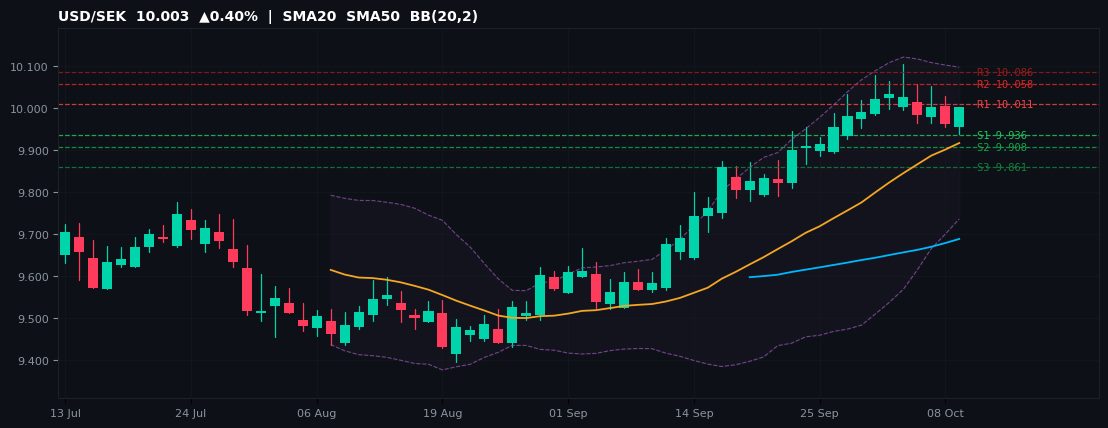
10.003 ▲0.40% Day H 10.003 / L 9.939 52W 8.737–10.105
| R3 | R2 | R1 | S1 | S2 | S3 |
|---|---|---|---|---|---|
| 10.086 | 10.058 | 10.011 | 9.936 | 9.908 | 9.861 |
End-of-day snapshot for USD/SEK: closing at 10.003 (+0.40% on the day), just 1.02% below its 52-week high of 10.105. Today's full-session range of 9.939–10.003 (0.064 points). The daily close above the pivot (9.983) signals bullish continuation into tomorrow's Asian open.
For tomorrow's Asian open, the key pivot reference levels remain: R1 10.011 / R2 10.058 / R3 10.086 on the upside and S1 9.936 / S2 9.908 / S3 9.861 on the downside. Asian session liquidity is typically thinner, so gaps through pivot levels should be monitored carefully.
USD/SEK finishes the day the trend is intact; bulls will target a break above the annual high on the next catalyst. The 52-week range of 8.737–10.105 places the pair at the 93th percentile. Key overnight risk: Asian economic data and any after-hours US developments that could reprice the USD complex before London re-opens.
USD/SEKBullishNear 52W High
EUR/NOK
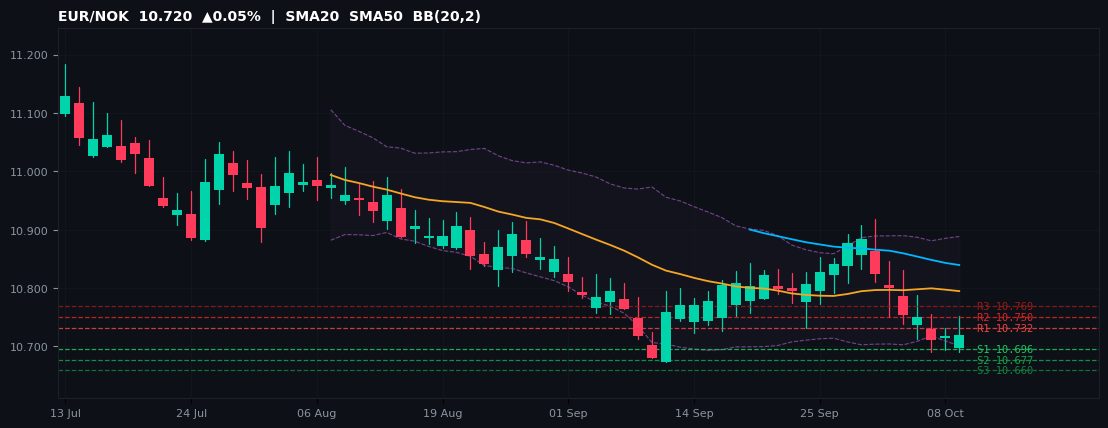
10.720 ▲0.05% Day H 10.752 / L 10.691 52W 10.673–12.012
| R3 | R2 | R1 | S1 | S2 | S3 |
|---|---|---|---|---|---|
| 10.769 | 10.750 | 10.732 | 10.696 | 10.677 | 10.660 |
End-of-day snapshot for EUR/NOK: closing at 10.720 (+0.05% on the day), just 0.45% above its 52-week floor at 10.673. Today's full-session range of 10.691–10.752 (0.061 points). The daily close above the pivot (10.713) signals bullish continuation into tomorrow's Asian open.
For tomorrow's Asian open, the key pivot reference levels remain: R1 10.732 / R2 10.750 / R3 10.769 on the upside and S1 10.696 / S2 10.677 / S3 10.660 on the downside. Asian session liquidity is typically thinner, so gaps through pivot levels should be monitored carefully.
EUR/NOK finishes the day the annual support is under watch — a close below would reset the technical outlook bearish. The 52-week range of 10.673–12.012 places the pair at the 4th percentile. Key overnight risk: Asian economic data and any after-hours US developments that could reprice the USD complex before London re-opens.
EUR/NOKRangeboundNear 52W Low
NOK/SEK
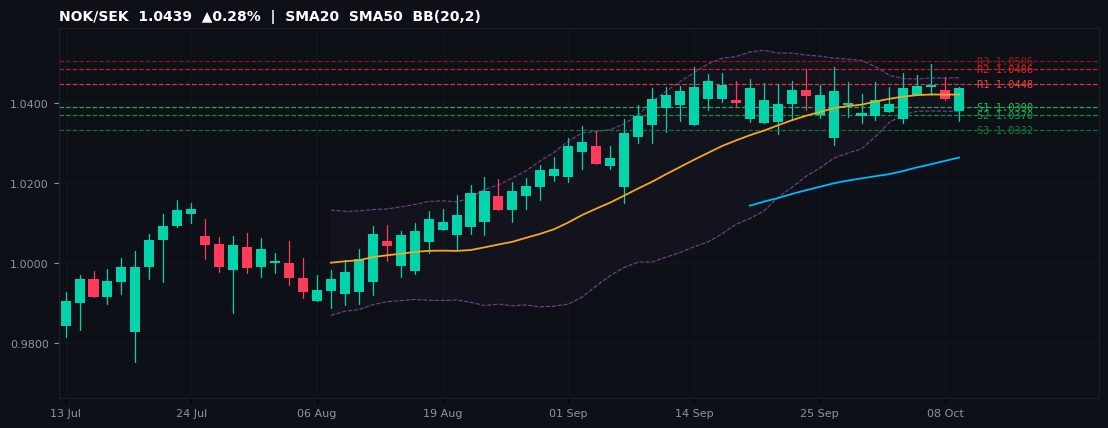
1.0439 ▲0.28% Day H 1.0439 / L 1.0356 52W 0.9064–1.0497
| R3 | R2 | R1 | S1 | S2 | S3 |
|---|---|---|---|---|---|
| 1.0506 | 1.0486 | 1.0448 | 1.0390 | 1.0370 | 1.0332 |
End-of-day snapshot for NOK/SEK: closing at 1.0439 (+0.28% on the day), just 0.56% below its 52-week high of 1.0497. Today's full-session range of 1.0356–1.0439 (0.0084 points). The daily close above the pivot (1.0428) signals bullish continuation into tomorrow's Asian open.
For tomorrow's Asian open, the key pivot reference levels remain: R1 1.0448 / R2 1.0486 / R3 1.0506 on the upside and S1 1.0390 / S2 1.0370 / S3 1.0332 on the downside. Asian session liquidity is typically thinner, so gaps through pivot levels should be monitored carefully.
NOK/SEK finishes the day the trend is intact; bulls will target a break above the annual high on the next catalyst. The 52-week range of 0.9064–1.0497 places the pair at the 96th percentile. Key overnight risk: Asian economic data and any after-hours US developments that could reprice the USD complex before London re-opens.
NOK/SEKRangeboundNear 52W High
Exotic Pairs
USD/TRY
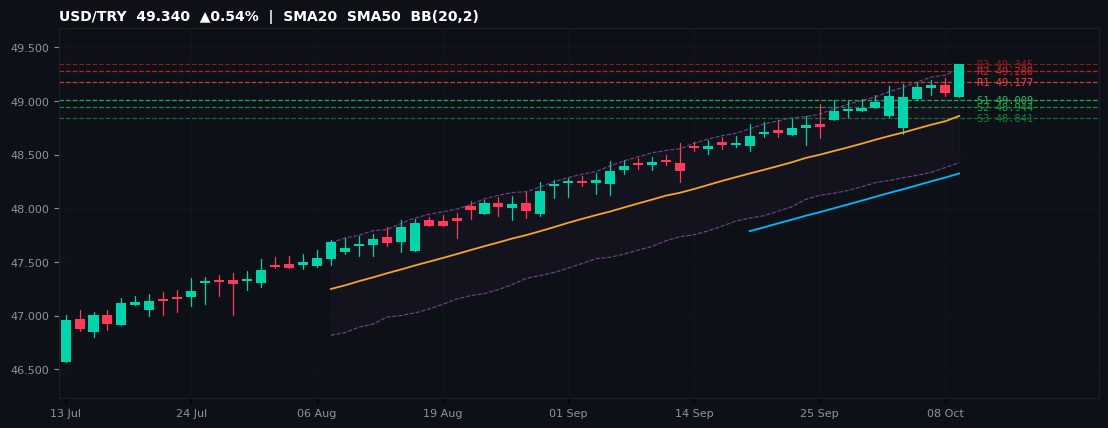
49.340 ▲0.54% Day H 49.342 / L 49.039 52W 41.638–49.342
| R3 | R2 | R1 | S1 | S2 | S3 |
|---|---|---|---|---|---|
| 49.345 | 49.280 | 49.177 | 49.009 | 48.944 | 48.841 |
End-of-day snapshot for USD/TRY: closing at 49.340 (+0.54% on the day), just 0.00% below its 52-week high of 49.342. Today's full-session range of 49.039–49.342 (0.303 points). The daily close above the pivot (49.112) signals bullish continuation into tomorrow's Asian open.
For tomorrow's Asian open, the key pivot reference levels remain: R1 49.177 / R2 49.280 / R3 49.345 on the upside and S1 49.009 / S2 48.944 / S3 48.841 on the downside. Asian session liquidity is typically thinner, so gaps through pivot levels should be monitored carefully.
USD/TRY finishes the day the trend is intact; bulls will target a break above the annual high on the next catalyst. The 52-week range of 41.638–49.342 places the pair at the 100th percentile. Key overnight risk: Asian economic data and any after-hours US developments that could reprice the USD complex before London re-opens.
USD/TRYBullishAbove R1Near 52W High
USD/MXN
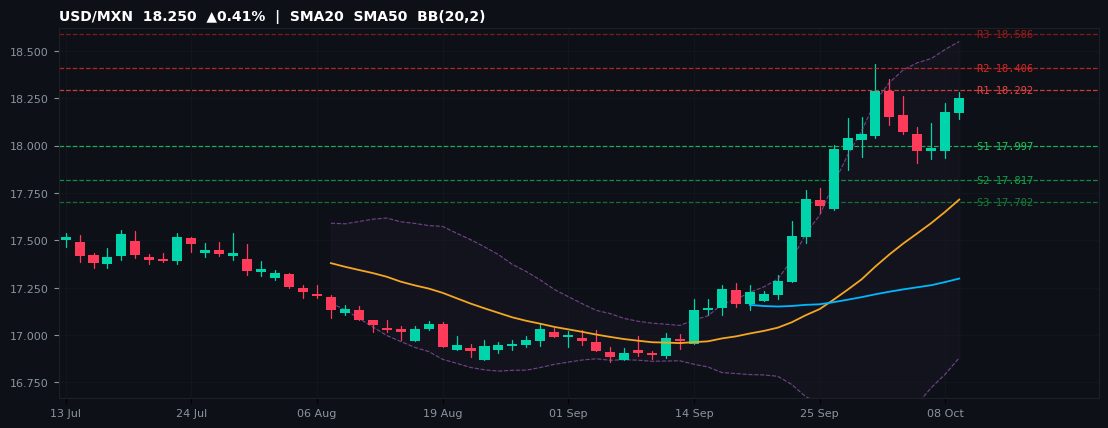
18.250 ▲0.41% Day H 18.280 / L 18.140 52W 16.855–18.768
| R3 | R2 | R1 | S1 | S2 | S3 |
|---|---|---|---|---|---|
| 18.586 | 18.406 | 18.292 | 17.997 | 17.817 | 17.702 |
End-of-day snapshot for USD/MXN: closing at 18.250 (+0.41% on the day), at the 73th percentile of its 16.855–18.768 52-week range. Today's full-session range of 18.140–18.280 (0.140 points). The daily close above the pivot (18.112) signals bullish continuation into tomorrow's Asian open.
For tomorrow's Asian open, the key pivot reference levels remain: R1 18.292 / R2 18.406 / R3 18.586 on the upside and S1 17.997 / S2 17.817 / S3 17.702 on the downside. Asian session liquidity is typically thinner, so gaps through pivot levels should be monitored carefully.
USD/MXN finishes the day the pair is closing in the upper half of its annual range, a constructive sign for bulls. The 52-week range of 16.855–18.768 places the pair at the 73th percentile. Key overnight risk: Asian economic data and any after-hours US developments that could reprice the USD complex before London re-opens.
USD/MXNBullish
USD/ZAR
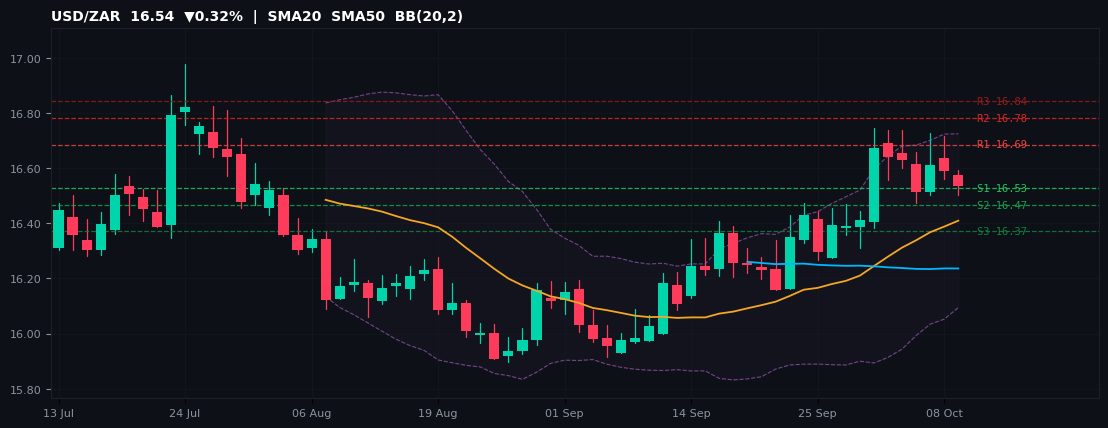
16.54 ▼0.32% Day H 16.59 / L 16.50 52W 15.64–17.57
| R3 | R2 | R1 | S1 | S2 | S3 |
|---|---|---|---|---|---|
| 16.84 | 16.78 | 16.69 | 16.53 | 16.47 | 16.37 |
End-of-day snapshot for USD/ZAR: closing at 16.54 (-0.32% on the day), at the 46th percentile of its 15.64–17.57 52-week range. Today's full-session range of 16.50–16.59 (0.09 points). The daily close below the pivot (16.62) signals bearish momentum into tomorrow's Asian open.
For tomorrow's Asian open, the key pivot reference levels remain: R1 16.69 / R2 16.78 / R3 16.84 on the upside and S1 16.53 / S2 16.47 / S3 16.37 on the downside. Asian session liquidity is typically thinner, so gaps through pivot levels should be monitored carefully.
USD/ZAR finishes the day the pair is ending the day in the lower half of its annual range, keeping bears in control. The 52-week range of 15.64–17.57 places the pair at the 46th percentile. Key overnight risk: Asian economic data and any after-hours US developments that could reprice the USD complex before London re-opens.
USD/ZARBearish
USD/PLN
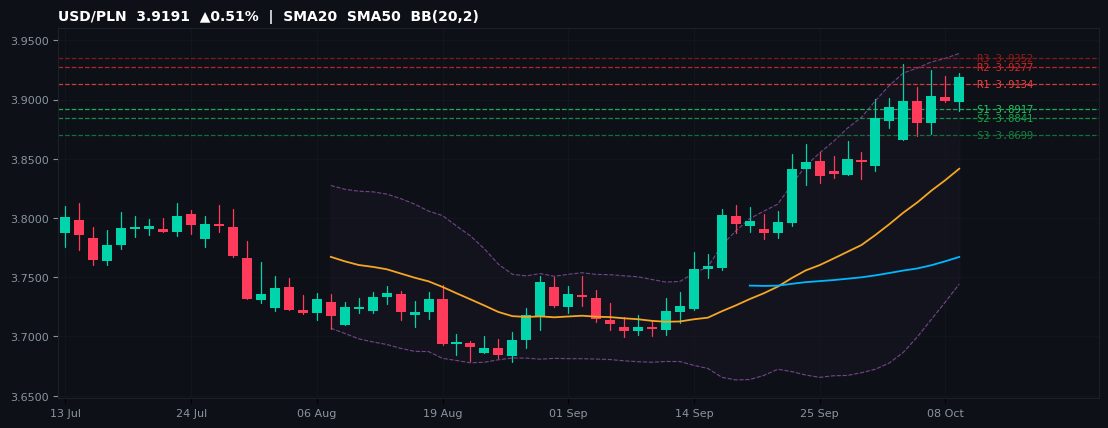
3.9191 ▲0.51% Day H 3.9226 / L 3.8903 52W 3.4750–3.9298
| R3 | R2 | R1 | S1 | S2 | S3 |
|---|---|---|---|---|---|
| 3.9352 | 3.9277 | 3.9134 | 3.8917 | 3.8841 | 3.8699 |
End-of-day snapshot for USD/PLN: closing at 3.9191 (+0.51% on the day), just 0.27% below its 52-week high of 3.9298. Today's full-session range of 3.8903–3.9226 (0.0323 points). The daily close above the pivot (3.9059) signals bullish continuation into tomorrow's Asian open.
For tomorrow's Asian open, the key pivot reference levels remain: R1 3.9134 / R2 3.9277 / R3 3.9352 on the upside and S1 3.8917 / S2 3.8841 / S3 3.8699 on the downside. Asian session liquidity is typically thinner, so gaps through pivot levels should be monitored carefully.
USD/PLN finishes the day the trend is intact; bulls will target a break above the annual high on the next catalyst. The 52-week range of 3.4750–3.9298 places the pair at the 98th percentile. Key overnight risk: Asian economic data and any after-hours US developments that could reprice the USD complex before London re-opens.
USD/PLNBullishAbove R1Near 52W High
Informational purposes only — not investment advice. Pivot levels computed from yesterday's session OHLC via standard floor-pivot formula. Prices sourced from MetaTrader 5 as of Friday 09 October 2026 evening (20:30 CET). Past performance is not indicative of future results.