USD/JPY: Up 0.42% to 157.46 — Bearish — Below Key MAs
MarketsFN Team
USD/JPY: Up 0.42% to 157.46 — Bearish — Below Key MAs
Published: October 26, 2026 · MarketsFN Team · US Session
| Pair | Rate | Change | RSI(14) | SMA-20 | SMA-50 | 52W High | 52W Low | Pivot | R1 | S1 |
|---|---|---|---|---|---|---|---|---|---|---|
| USD/JPY | 157.46 | +0.42% | 43.8 | 157.88 | 157.51 | 163.84 | 152.16 | 156.68 | 157.28 | 156.20 |
📊 Support & Resistance Levels
Dynamic Trendlines
| Level | Type | Direction | Distance |
|---|---|---|---|
| 156.06 | 20d Support | → flat | -0.89% / 140.5 pips |
| 159.16 | 20d Resistance | → flat | +1.08% / 169.9 pips |
| 154.71 | 50d Support | ↗ ascending | -1.74% / 274.7 pips |
| 158.56 | 50d Resistance | ↘ descending | +0.70% / 110.2 pips |
Static Levels
| Level | Type | Touches | Distance |
|---|---|---|---|
| 159.85 | Resistance | 2× | +1.48% / 233.1 pips |
| 157.91 | Resistance | 2× | +0.25% / 39.2 pips |
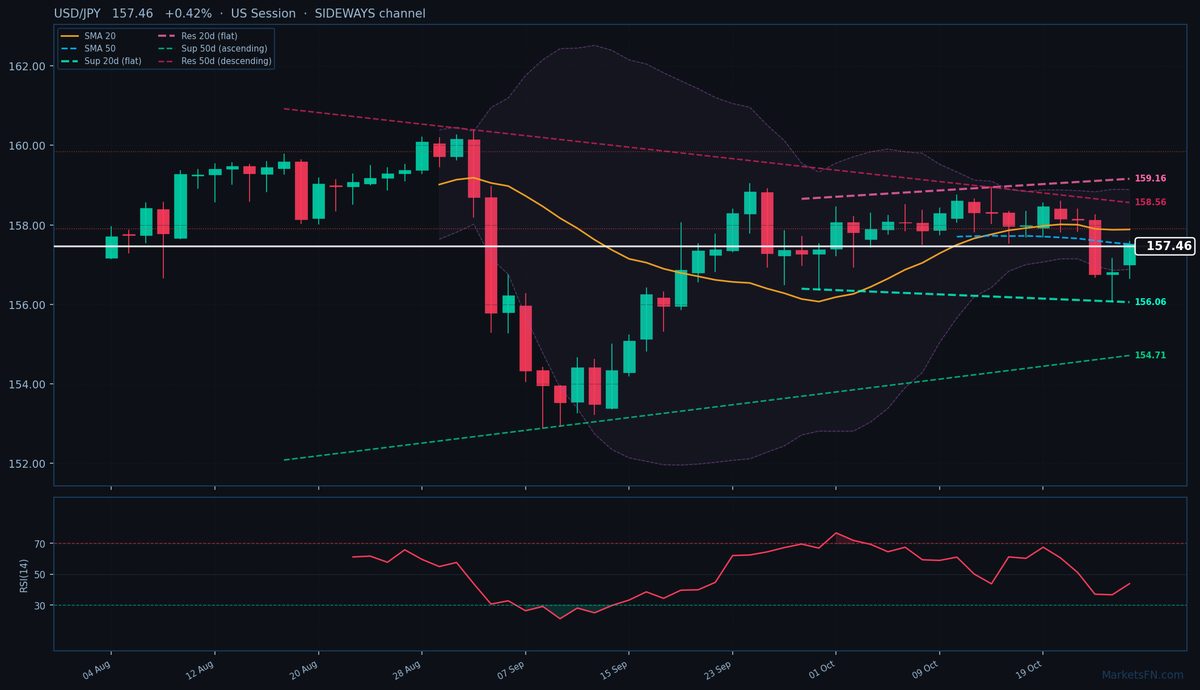
USD/JPY is trading at 157.46 (+0.42%), testing the lower bounds of its recent range as bearish momentum builds below both the SMA-20 (157.88) and SMA-50 (157.51). The pair is now 42.2 pips below the 20-day moving average and 5.5 pips under the 50-day, confirming a near-term downtrend. Price action remains trapped in a sideways 20-day dynamic channel, with immediate resistance at 159.16 (169.9 pips above) and support at 156.06 (140.5 pips below). The 50-day channel shows conflicting signals — ascending support at 154.71 (274.7 pips below) but descending resistance at 158.56 (110.2 pips above), reflecting indecision in medium-term directionality.
Static levels highlight the immediate battleground: S1 at 156.20 (126 pips below) aligns closely with the 20-day dynamic support, while R1 at 157.28 (just 18 pips above) could cap rebounds. The RSI at 43.8 sits in neutral territory but with downward momentum, suggesting room for further downside before oversold conditions emerge. With today's high at 157.58 testing but failing to breach R1, sellers appear in control near-term.
The key test comes at 156.65 (today's low, 81 pips below) — a break here would confirm bearish continuation toward the 156.06 dynamic support. Upside remains constrained by the SMA cluster overhead. Watch US core PCE data tomorrow — a hotter print could revive Fed hike bets and stall the yen's advance, while a miss may accelerate the slide toward 156.20 support.
Disclaimer
The content on MarketsFN.com is provided for educational and informational purposes only and does not constitute financial advice. All investments involve risk and past performance does not guarantee future results.