NZD/USD: Down 0.15% to 0.5689 — Ascending Channel
MarketsFN Team
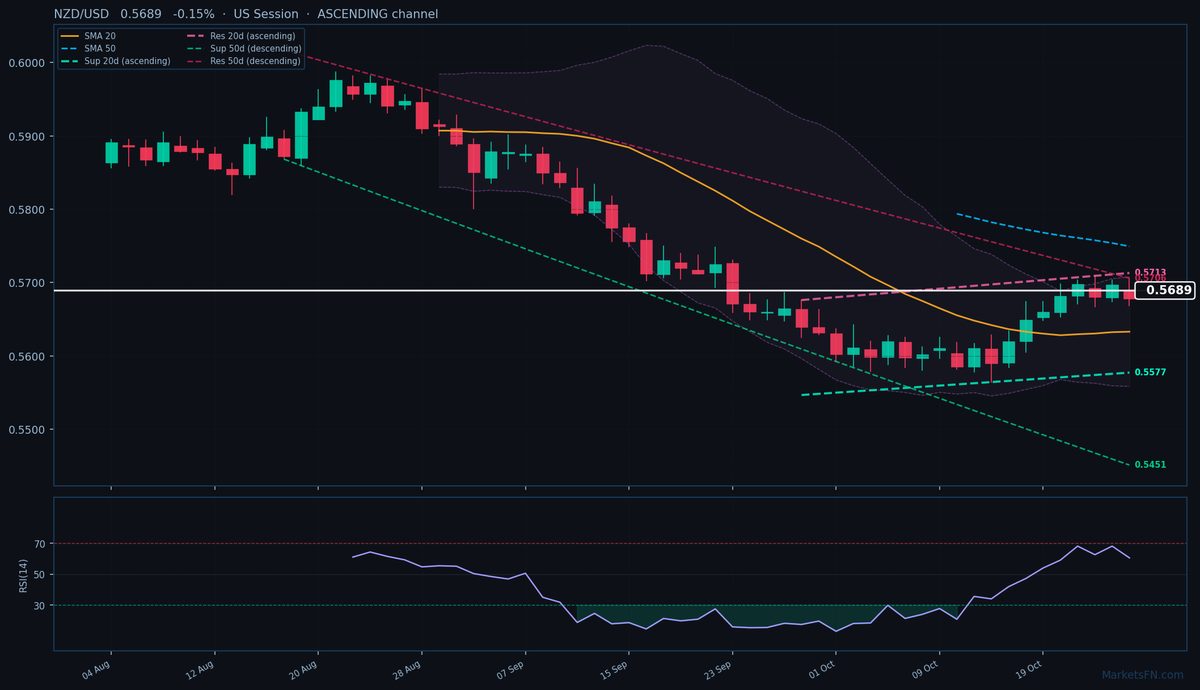
NZD/USD: Down 0.15% to 0.5689 — Ascending Channel
Published: October 26, 2026 · MarketsFN Team · US Session
| Pair | Rate | Change | RSI(14) | SMA-20 | SMA-50 | 52W High | 52W Low | Pivot | R1 | S1 |
|---|---|---|---|---|---|---|---|---|---|---|
| NZD/USD | 0.5689 | -0.15% | 60.6 | 0.5633 | 0.5749 | 0.6075 | 0.5581 | 0.5692 | 0.5709 | 0.5680 |
📊 Support & Resistance Levels
Dynamic Trendlines
| Level | Type | Direction | Distance |
|---|---|---|---|
| 0.5577 | 20d Support | ↗ ascending | -1.97% / 111.9 pips |
| 0.5713 | 20d Resistance | ↗ ascending | +0.42% / 24.0 pips |
| 0.5451 | 50d Support | ↘ descending | -4.18% / 237.9 pips |
| 0.5706 | 50d Resistance | ↘ descending | +0.30% / 16.9 pips |
NZD/USD is trading at 0.5689 (-0.15%), trapped in a tug-of-war between conflicting technical signals that suggest near-term indecision. The pair remains in a consolidation phase, hovering above the 20-day SMA (0.5633) but below the 50-day SMA (0.5749), reflecting mixed intermediate-term momentum. The 20-day dynamic channel is ascending, with immediate resistance at 0.5713 (+24.0 pips) and support at 0.5577 (-111.9 pips), while the 50-day channel remains descending with resistance at 0.5706 (+16.9 pips) — creating a technical battleground between opposing trends. Static levels show the pair testing pivot at 0.5692, with S1 at 0.5680 (-0.9 pips) and R1 at 0.5709 (+20.0 pips) as the nearest reference points. RSI at 60.6 sits in neutral territory, offering no clear directional bias.
The key conflict lies in the 20-day ascending channel versus the 50-day descending channel — a textbook compression pattern that typically precedes a directional breakout. With ATR(14) at just 41 pips, volatility contraction suggests traders are awaiting a catalyst. The immediate test is whether price can reclaim the 50-day dynamic resistance at 0.5706, which would open a path toward the 20-day upper channel boundary. Failure to hold above the 20-day SMA (0.5633) could trigger a retest of the 52-week low at 0.5581. Watch US session flows for breakout potential — a daily close above 0.5713 or below 0.5669 (today's low) would confirm the next directional leg.
Disclaimer
The content on MarketsFN.com is provided for educational and informational purposes only and does not constitute financial advice. All investments involve risk and past performance does not guarantee future results.