USD/JPY: Up 0.25% to 157.88 — Price Below SMA-20
MarketsFN Team
USD/JPY: Up 0.25% to 157.88 — Price Below SMA-20
Published: October 27, 2026 · MarketsFN Team · US Session
| Pair | Rate | Change | RSI(14) | SMA-20 | SMA-50 | 52W High | 52W Low | Pivot | R1 | S1 |
|---|---|---|---|---|---|---|---|---|---|---|
| USD/JPY | 157.88 | +0.25% | 46.3 | 157.90 | 157.48 | 163.84 | 152.16 | 157.26 | 157.87 | 156.88 |
📊 Support & Resistance Levels
Dynamic Trendlines
| Level | Type | Direction | Distance |
|---|---|---|---|
| 156.04 | 20d Support | → flat | -1.17% / 184.4 pips |
| 158.90 | 20d Resistance | → flat | +0.64% / 101.5 pips |
| 154.77 | 50d Support | ↗ ascending | -1.97% / 311.6 pips |
| 158.51 | 50d Resistance | ↘ descending | +0.40% / 63.1 pips |
Static Levels
| Level | Type | Touches | Distance |
|---|---|---|---|
| 159.85 | Resistance | 2× | +1.36% / 214.7 pips |
| 157.91 | Resistance | 2× | +0.13% / 20.8 pips |
| 157.52 | Support | 2× | -0.11% / 17.5 pips |
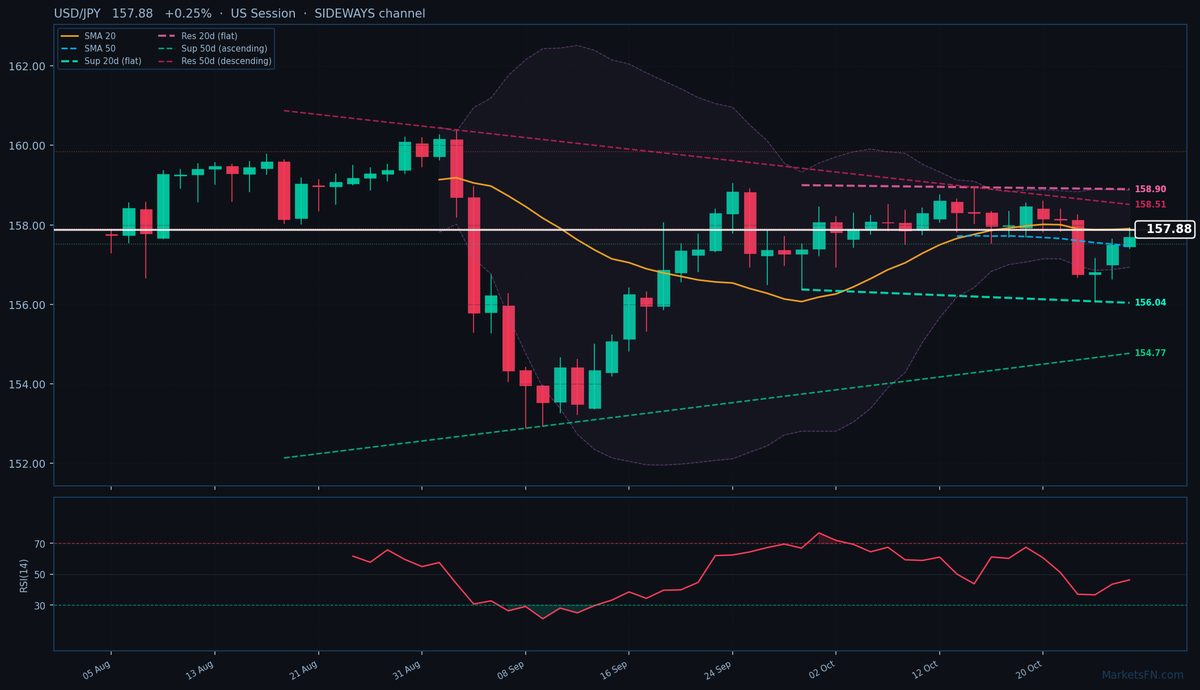
USD/JPY is trading at 157.88 (+0.25%), stuck in a consolidation phase as it oscillates between the SMA-50 (157.48, support) and SMA-20 (157.90, resistance) — a textbook indecision pattern. The rate is literally straddling these moving averages, with today’s 50-pip range (157.42–157.92) failing to break either benchmark. This tight range aligns with the 20-day dynamic channel, which is flat (sideways) with resistance at 158.90 (+101.5 pips) and support at 156.04 (-184.4 pips). The 50-day channel shows conflicting signals — support is ascending (154.77, -311.6 pips) while resistance is descending (158.51, +63.1 pips) — reinforcing the lack of directional conviction.
Static levels highlight immediate battlegrounds: R1 at 157.91 (just 20.8 pips above) marks today’s high and a double-touch resistance, while S1 at 157.52 (17.5 pips below) aligns with yesterday’s close and a pivot cluster. The RSI at 46.3 confirms neutrality — no oversold or overbought extremes. With ATR(14) at 0.83, expect muted volatility unless either 157.52 (S1) or 157.91 (R1) breaks.
Short-term bias leans bearish given the rejection at SMA-20 and proximity to R1, but a clean break above 157.91 could target 158.51 (50-day dynamic resistance). Conversely, losing 157.48 (SMA-50) opens a path to 156.88 (S1 pivot). Watch tonight’s Tokyo session — a close outside 157.42–157.92 would signal directional commitment. Until then, range-trade the pivots.
Disclaimer
The content on MarketsFN.com is provided for educational and informational purposes only and does not constitute financial advice. All investments involve risk and past performance does not guarantee future results.