USD/CHF: Up 0.11% to 0.8283 — Descending Channel
MarketsFN Team
USD/CHF: Up 0.11% to 0.8283 — Descending Channel
Published: October 27, 2026 · MarketsFN Team · US Session
| Pair | Rate | Change | RSI(14) | SMA-20 | SMA-50 | 52W High | 52W Low | Pivot | R1 | S1 |
|---|---|---|---|---|---|---|---|---|---|---|
| USD/CHF | 0.8283 | +0.11% | 43.8 | 0.8289 | 0.8200 | 0.8356 | 0.7609 | 0.8261 | 0.8291 | 0.8244 |
📊 Support & Resistance Levels
Dynamic Trendlines
| Level | Type | Direction | Distance |
|---|---|---|---|
| 0.8184 | 20d Support | ↘ descending | -1.20% / 99.6 pips |
| 0.8357 | 20d Resistance | ↘ descending | +0.89% / 73.7 pips |
| 0.8202 | 50d Support | ↗ ascending | -0.98% / 81.3 pips |
| 0.8533 | 50d Resistance | ↗ ascending | +3.02% / 249.9 pips |
Static Levels
| Level | Type | Touches | Distance |
|---|---|---|---|
| 0.7924 | Support | 2× | -4.32% / 357.5 pips |
| 0.7904 | Support | 2× | -4.56% / 378.0 pips |
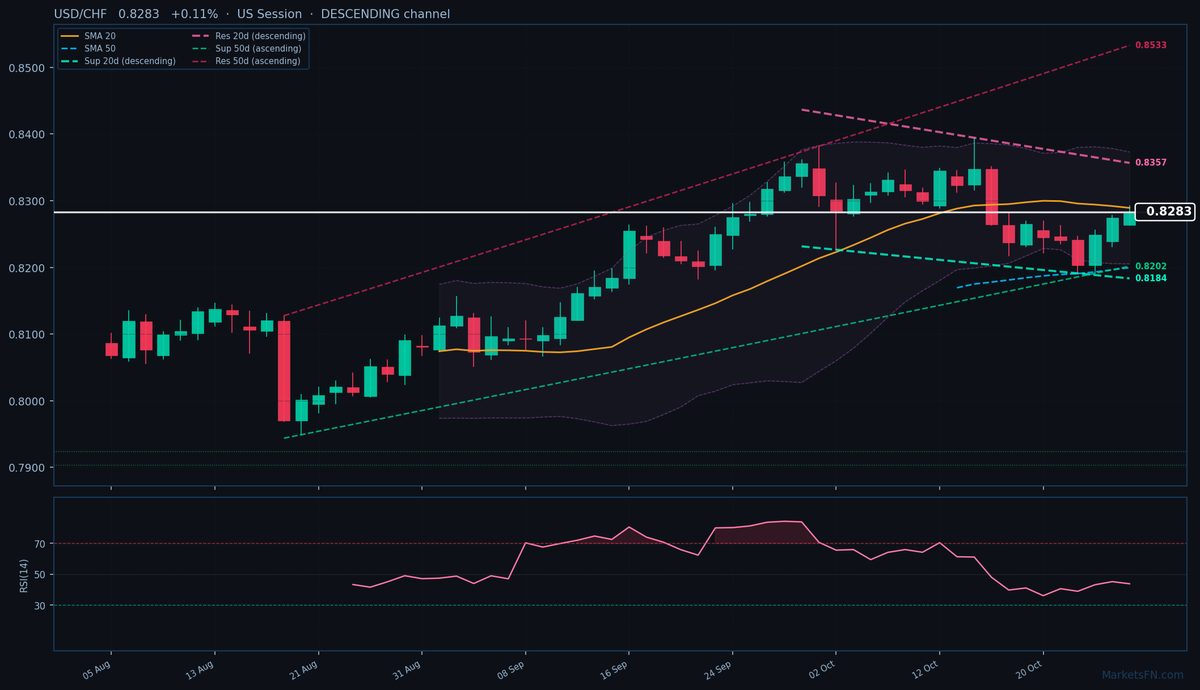
USD/CHF is trading at 0.8283 (+0.11%), testing the lower bounds of a descending 20-day channel while clinging to support from its ascending 50-day trendline. The pair is trapped in a consolidation phase, sandwiched between the 20-day SMA (0.8289, just 6 pips above) and the 50-day SMA (0.8200, 83 pips below). Price action remains rangebound within today’s 29-pip band (0.8263–0.8292), failing to decisively break either the descending 20-day resistance (0.8357, +73.7 pips) or the ascending 50-day support (0.8202, -81.3 pips).
The RSI at 43.8 shows neutral momentum, but the descending 20-day channel (sloping -1.18% from current price) suggests near-term bearish pressure. Immediate static levels are sparse, with the closest pivot support (S1) at 0.8244 (-39 pips) and resistance (R1) at 0.8291 (+8 pips). Notably, stronger static supports cluster much lower at 0.7924 (-357.5 pips), leaving the pair vulnerable to a slide toward the 50-day dynamic support if the 20-day channel’s downtrend persists.
Short-term, the battle between the descending 20-day channel and ascending 50-day trendline will dictate direction. A break above the 20-day SMA (0.8289) could target R1 (0.8291), while failure risks a retest of the 50-day SMA (0.8200). Watch for a close above 0.8291 to invalidate the near-term bearish channel, or a drop below 0.8261 (today’s pivot) to confirm downside momentum. The 50-day trendline’s ascent remains the structural bull case, but the 20-day channel’s slope demands caution.
Disclaimer
The content on MarketsFN.com is provided for educational and informational purposes only and does not constitute financial advice. All investments involve risk and past performance does not guarantee future results.