USD/JPY: Down 0.00% to 158.15 — Ascending Channel
MarketsFN Team
USD/JPY: Down 0.00% to 158.15 — Ascending Channel
Published: October 21, 2026 · MarketsFN Team · US Session
| Pair | Rate | Change | RSI(14) | SMA-20 | SMA-50 | 52W High | 52W Low | Pivot | R1 | S1 |
|---|---|---|---|---|---|---|---|---|---|---|
| USD/JPY | 158.15 | -0.00% | 49.4 | 158.00 | 157.66 | 163.84 | 152.16 | 158.19 | 158.56 | 157.78 |
📊 Support & Resistance Levels
Dynamic Trendlines
| Level | Type | Direction | Distance |
|---|---|---|---|
| 157.84 | 20d Support | ↗ ascending | -0.20% / 31.3 pips |
| 158.91 | 20d Resistance | → flat | +0.48% / 76.6 pips |
| 154.55 | 50d Support | ↗ ascending | -2.27% / 359.7 pips |
| 158.70 | 50d Resistance | ↘ descending | +0.35% / 55.7 pips |
Static Levels
| Level | Type | Touches | Distance |
|---|---|---|---|
| 159.85 | Resistance | 2× | +1.15% / 182.1 pips |
| 157.52 | Support | 2× | -0.32% / 50.1 pips |
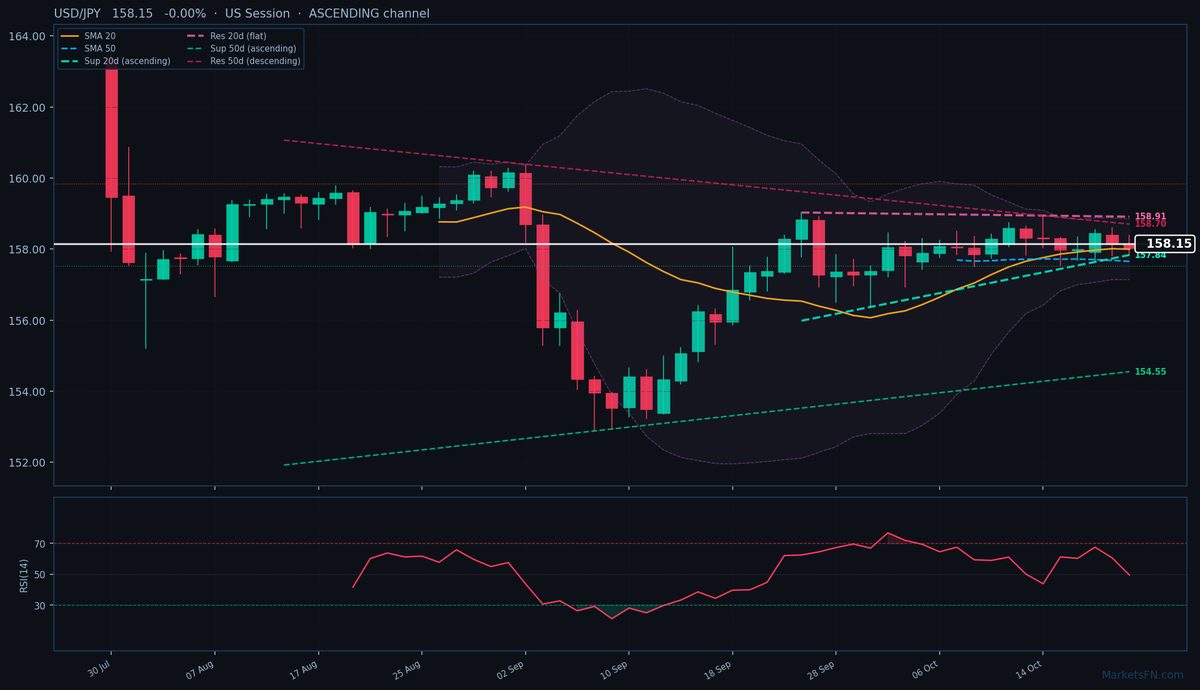
USD/JPY is trading at 158.15 (-0.00%), stuck in neutral gear as it consolidates within a tight 56-pip range (157.83–158.39) after failing to sustain momentum above the 20-day SMA (158.00). The pair remains in a technical uptrend, trading above both the 20-day (158.00) and 50-day (157.66) SMAs, but the lack of directional conviction is evident in the flat RSI at 49.4 and the absence of daily volatility (ATR of just 0.77). The 20-day dynamic channel is ascending, with immediate support at 157.84 (31.3 pips below) and resistance at 158.91 (76.6 pips above), while the 50-day channel shows a more conflicted picture with descending resistance at 158.70 (55.7 pips above) and rising support far below at 154.55.
Static levels reveal a clearer battleground: the pair is testing the pivot at 158.19, with S1 support at 157.52 (50.1 pips below) and no meaningful resistance until 159.85 (182.1 pips above). The lack of follow-through after yesterday’s test of 158.39 suggests sellers are defending the upper bound of the recent range, but the ascending 20-day channel and SMA support favor buyers on dips. A decisive break above 158.56 (R1) could trigger a run toward the 20-day dynamic resistance at 158.91, while failure to hold 157.78 (S1) would expose the 157.52 static support. Watch for US session momentum — a close above 158.19 pivot would confirm near-term bullish control.
Disclaimer
The content on MarketsFN.com is provided for educational and informational purposes only and does not constitute financial advice. All investments involve risk and past performance does not guarantee future results.