US Session Crude Oil Report — 27 Oct 2026
QuoteReporter
WTI crude is trading at $90.86 in the NYMEX session, testing the lower bound of its recent range as bearish momentum extends with RSI diving deeper into oversold territory at 22.5. Brent holds firmer at $103.02, buoyed by tightening Atlantic Basin physical markets, though both benchmarks remain pressured by broader risk-off flows amid a surging dollar index. The Brent-WTI spread widens to $12.16 as European refinery demand absorbs regional sour barrels.
Technicals flash warning signals as WTI trades 1.6% below its 9-day EMA with the 21-day EMA sloping downward at $92.90 - a critical resistance zone that now caps upside attempts. Brent's chart shows marginally better structure, clinging to its 9-day EMA at $103.07, though failure to reclaim the 50-day EMA at $97.21 would confirm bearish continuation. The pivot point framework shows WTI flirting with its PP at $89.46; a sustained break here opens the trapdoor toward S1 at $72.17. Brent finds interim support at its 21-day EMA near $101.63, with R1 resistance looming at $117.04.

Geopolitical tensions simmer beneath price action with Iranian Revolutionary Guard Corps naval units conducting fresh tanker intercepts near Hormuz - a chokepoint handling 20M bbl/d remains on elevated alert. VLCCs continue rerouting via the Cape of Good Hope as Houthi attacks persist at Bab-el-Mandeb, adding 7 days to Mideast-Asia voyages. OPEC+ discipline shows cracks with Iraq and Russia producing 110k bbl/d above quota despite Saudi maintaining 100% compliance. The cartel's cuts now face their sternest test as global demand growth stutters, with the call on OPEC at 27.4M bbl/d versus 26.8M bbl/d output.
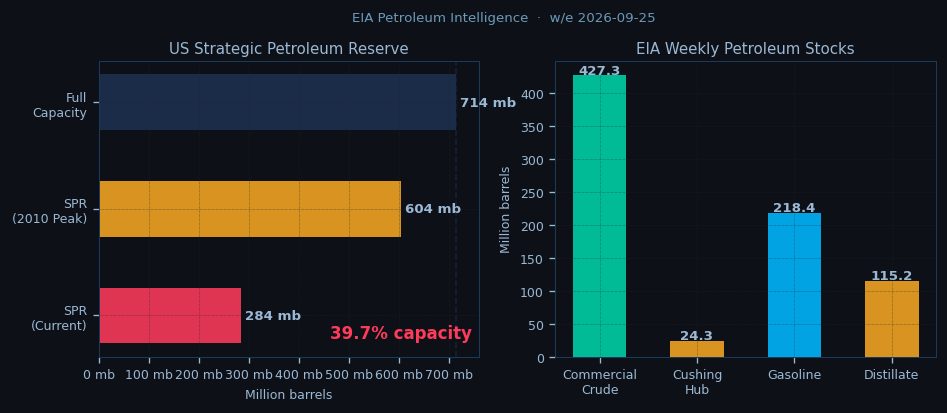
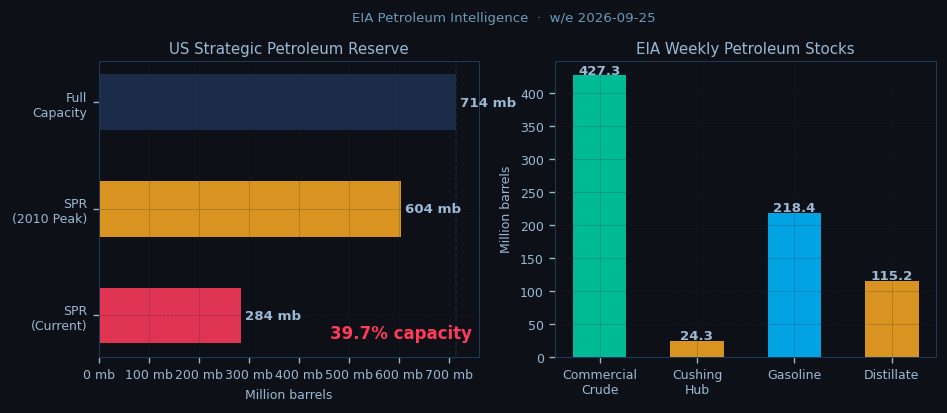
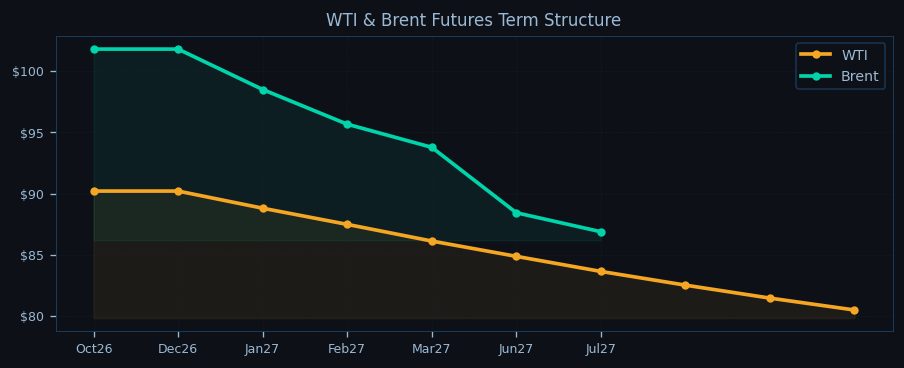
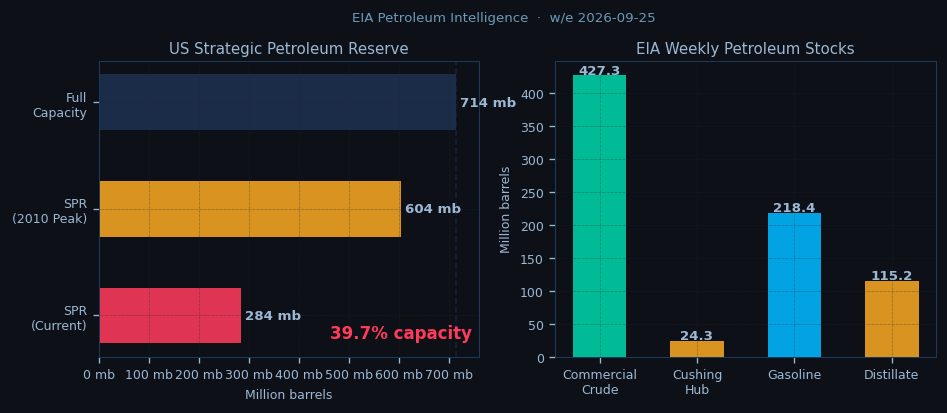
Term structure signals deepening backwardation as front-month WTI trades at $90.21 versus $80.50 for July 2027 - a 10.8% drop reflecting near-term tightness battling long-term demand destruction fears. Brent's curve shows even steeper contango at -14.6% between Oct26 and Jul27 contracts. EIA data reveals US commercial inventories building slightly to 427.3M barrels last week, though Cushing stocks at 24.3M barrels keep WTI delivery mechanisms functional. Refinery runs at 92.5% capacity suggest decent autumn demand, though weakening crack spreads hint at margin pressure.
The session outlook hinges on whether WTI can defend the $89.46 pivot point as algorithmic selling accelerates. Brent's ability to hold $101.63 will dictate whether European crude can avoid contagion from WTI's technical breakdown. Asian session traders will watch for stops below $89.00 on WTI and $101.00 on Brent - levels that could trigger another 3% downside if breached. Upside remains capped by the 9-day EMAs until either geopolitical escalation or a sharp dollar reversal emerges. With backwardation steepening and OPEC+ compliance wavering, the market balances near-term supply risks against growing recessionary headwinds - a tension reflected in the choppy intraday price action.

Disclaimer
The content on MarketsFN.com is provided for educational and informational purposes only. It does not constitute financial advice, investment recommendations, or trading guidance. All investments involve risks, and past performance does not guarantee future results. You are solely responsible for your investment decisions and should conduct independent research and consult a qualified financial advisor before acting. MarketsFN.com and its authors are not liable for any losses or damages arising from your use of this information.
Related Articles
- European Session Crude Oil Report — 27 Oct 2026 — Crude oil markets hover near multi-week lows in the European session as WTI struggles below $91 while Brent holds above…
- Asian Session Crude Oil Report — 27 Oct 2026 — WTI crude hovers near $90.86 in early Asian trading, testing the lower bounds of its recent range as bearish momentum…
- US Session Crude Oil Report — 26 Oct 2026 — WTI crude holds near session lows at $90.86 as the US session struggles to find bullish momentum, testing the 200-day…
- European Session Crude Oil Report — 26 Oct 2026 — Crude oil markets enter the European session with WTI hovering near $90.86 while Brent holds above $103, as the complex…
- US Session Crude Oil Report — 23 Oct 2026 — WTI crude is trading at $90.86 in early New York trading, holding just above the pivotal $89.46 support as Brent tests…