US Session Crude Oil Report — 21 Oct 2026
QuoteReporter
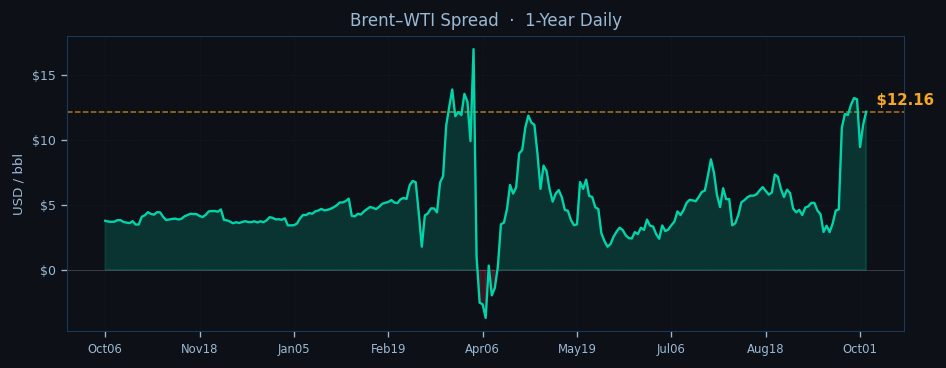
WTI crude hovers near $90.86 in early New York trade, testing the lower bounds of its weekly range as bearish momentum extends from yesterday's 3.96% seven-day slide. The contract now trades 1.6% below its nine-day exponential moving average at $92.34, with RSI(14) deep in oversold territory at 22.5. Brent shows marginally firmer tone at $103.02, clinging to flat price support just below its EMA9 at $103.07 as the intermarket spread widens to $12.16. Both benchmarks remain pressured by technical selling after breaking key moving average supports this week, though Brent's relatively stronger RSI(38.9) hints at potential mean-reversion fuel.
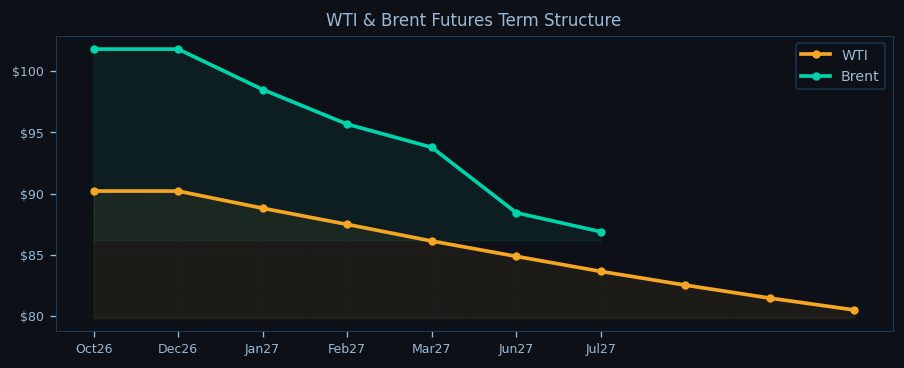
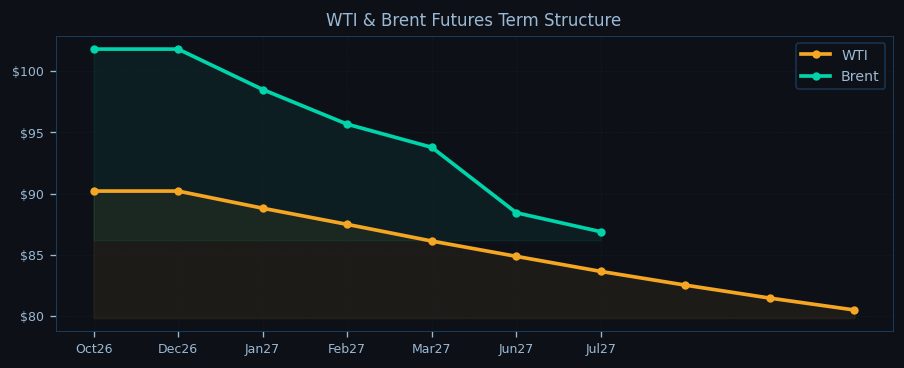
The technical landscape shows WTI testing critical confluence at its pivot point ($89.46) and 50-day EMA ($90.23), with resistance stacked at $92.90 (EMA21) and $108.15 (R1). Brent's structure appears more resilient, holding above psychological $100 support but facing stiff overhead supply at its $103.07 EMA9 and $117.04 R1. The term structure maintains steep backwardation across both benchmarks - WTI's Oct26/Jul27 spread sits at -10.8% while Brent's equivalent contracts show -14.6% - signaling persistent near-term physical tightness despite the spot price weakness.

Geopolitical tensions continue simmering beneath the price action. Iranian Revolutionary Guard Corps naval activity keeps Hormuz Strait risk premiums elevated with 20 million barrels per day of flows potentially at stake, while Houthi attacks in the Bab-el-Mandeb force VLCCs into costly Cape of Good Hope rerouting. These disruptions partially offset bearish inventory data showing U.S. commercial crude stocks building 0.9 million barrels last week despite refinery runs holding at 92.5% of capacity. The market now watches for confirmation of whether OPEC+ maintains its 0.6 million barrel per day deficit position, with compliance cracks appearing in Iraq and Russia even as Saudi Arabia holds 100% cut adherence.
Asian session liquidity will likely cluster around WTI's $89.46 pivot point and Brent's $96.17 equivalent, with overnight stops building below $88 and $95 respectively. The oversold RSI conditions suggest potential for short-covering rebounds, but any rallies face immediate resistance at the EMAs - particularly WTI's $92.34 and Brent's $103.07. Traders monitor whether backwardation steepens further on prompt supply concerns, or flattens as recession fears dominate sentiment. With the EIA report now digested and OPEC+ discipline in focus, the session's price action hinges on whether algorithmic systems respect these technical levels or trigger another liquidation wave through support.

Disclaimer
The content on MarketsFN.com is provided for educational and informational purposes only. It does not constitute financial advice, investment recommendations, or trading guidance. All investments involve risks, and past performance does not guarantee future results. You are solely responsible for your investment decisions and should conduct independent research and consult a qualified financial advisor before acting. MarketsFN.com and its authors are not liable for any losses or damages arising from your use of this information.
Related Articles
- Timor Leste Earthquake Pressures Nickel Prices — Earthquake in Timor Leste: Nickel Supply Chain Concerns Today, a magnitude 5.1 earthquake struck 164 km northeast of…
- European Session Crude Oil Report — 21 Oct 2026 — Crude oil markets trade mixed in the European session as Brent holds above $103 while WTI struggles below $91, with the…
- US Session Crude Oil Report — 20 Oct 2026 — WTI crude is trading at $90.86 in early US session action, struggling to hold above the psychologically critical $90…
- European Session Crude Oil Report — 20 Oct 2026 — Crude oil markets remain under pressure in early European trading as WTI hovers near $90.86, down 0.27% on the session,…
- US Session Crude Oil Report — 19 Oct 2026 — WTI crude is trading at $90.86 in early US session action, holding just above its pivotal $89.46 daily support as Brent…