US Session Crude Oil Report — 19 Oct 2026
QuoteReporter
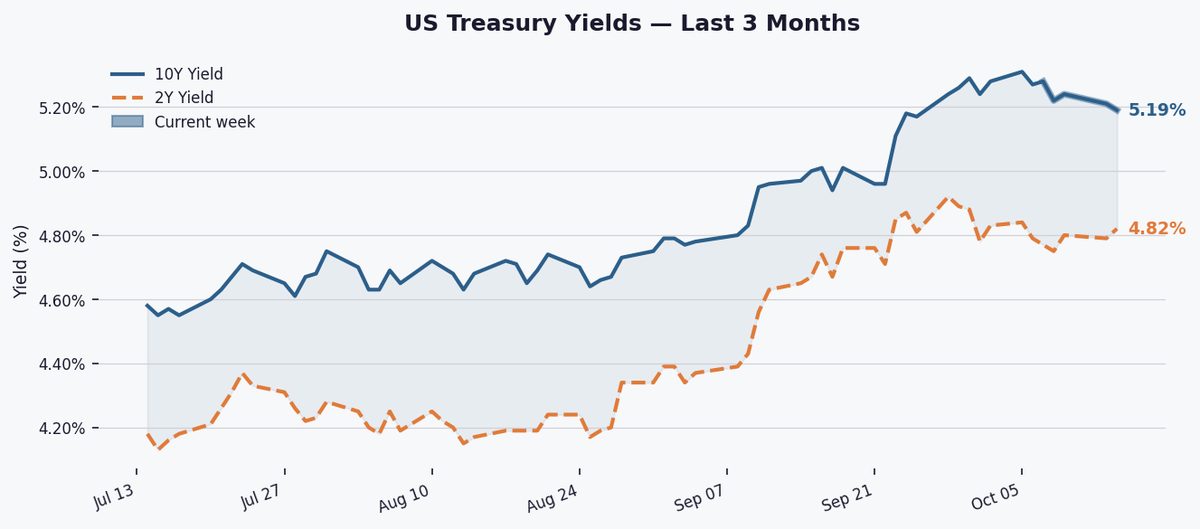
Crude prices are testing key technical levels amid a risk-on session, with WTI hovering near $90 as the S&P 500 rallies 53 points and Treasury yields push above 5.1%. The deepening backwardation in oil curves contrasts with oversold RSI signals, suggesting traders are pricing geopolitical or supply risks despite broader market optimism.
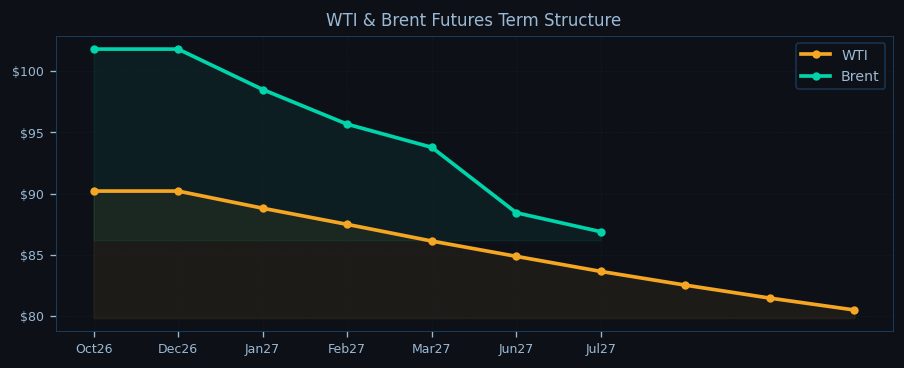
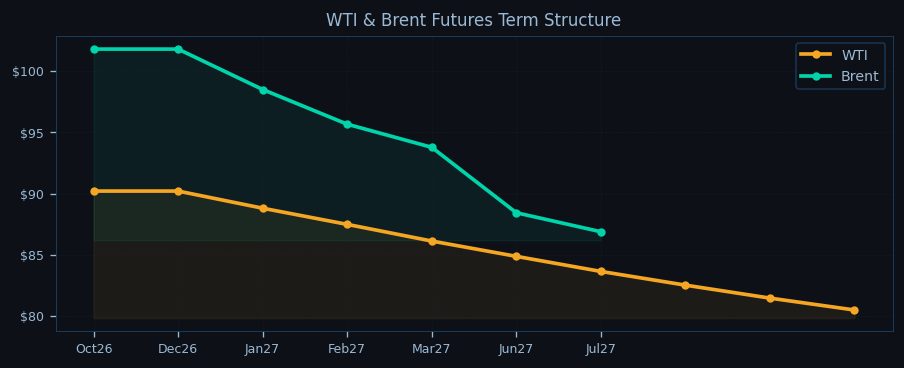
WTI crude is trading at $90.86 in early US session action, holding just above its pivotal $89.46 daily support as Brent tests the $103 handle with a 0.75% intraday gain. The market is grappling with technical exhaustion—WTI’s RSI at 22.5 screams oversold—while backwardation steepens across both benchmarks, front-month Brent contracts commanding a $12.16 premium to WTI amid tightening Atlantic Basin supply.
The technical setup is flashing conflicting signals. WTI is grinding against its 50-day EMA at $90.23, finding temporary footing after a 3.96% weekly slide, but remains trapped under descending EMAs at $92.34 (9-day) and $92.90 (21-day). Brent’s RSI at 38.9 shows less extreme positioning, its term structure notably tighter with Oct26/Jul27 backwardation at -14.6% versus WTI’s -10.8%. The Brent-WTI spread is widening as European refinery demand absorbs displaced Urals barrels, Russian loadings still hampered by Ukrainian drone strikes on Novorossiysk terminals.

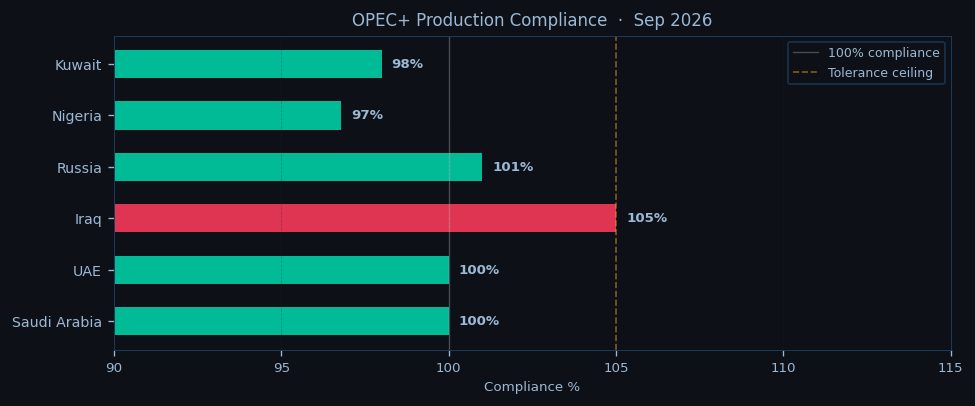
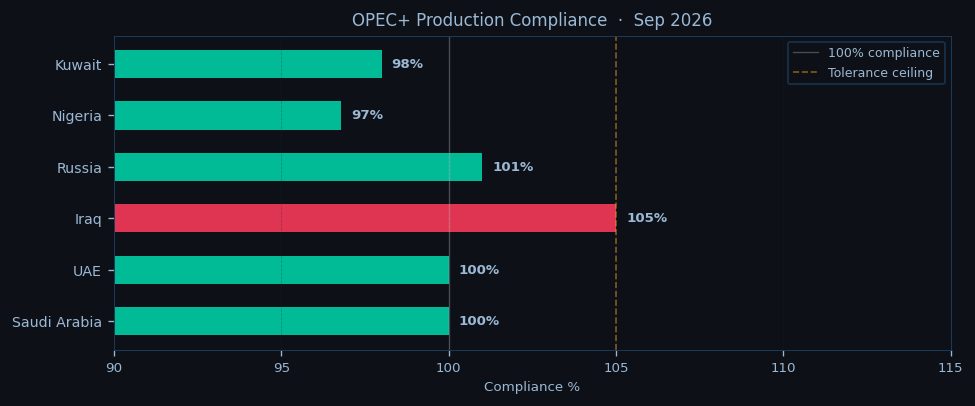
Geopolitical risk premiums are simmering but not boiling. Hormuz tensions are elevated with IRGC forces conducting “inspections” on two VLCCs this week, while Bab-el-Mandeb remains a live wire—Houthi missiles are forcing 2 million bbl/d of Red Sea traffic to divert around Africa. OPEC+ discipline is holding with the group running a 0.6 mb/d deficit to call, though Iraq’s northern exports are creeping up to 350k bbl/d via Ceyhan despite Kurdish pipeline disputes.
Today’s EIA data looms as the next catalyst, with consensus expecting a 1.5 mb crude draw. Any inventory surprise could spark outsized moves given WTI’s oversold condition—the $89.46 pivot point is critical support, with $72.17 (S1) and $53.48 (S2) forming distant downside targets. Resistance clusters at $108.15 (R1) and the psychologically key $100 level. Brent’s structure is more resilient, its $101.80 front-month contract finding bids from European buyers scrambling to replace lost Libyan barrels after Sharara field protests cut output by 200k bbl/d.
The Asian session will eye whether WTI can defend $90. A break lower opens the door for algorithmic selling given the 50-day EMA’s weakening slope, while Brent’s overnight range between $101.63 (21-day EMA) and $103.07 (9-day EMA) sets up a potential inflection point. OPEC+ jawboning is creeping back into the narrative—Saudi Energy Minister’s unscheduled trip to Moscow suggests coordination ahead of the December 1 quota review. For now, the market is balancing frayed technicals against still-constructive fundamentals, the backwardation screaming physical tightness even as paper markets wobble.

Disclaimer
The content on MarketsFN.com is provided for educational and informational purposes only. It does not constitute financial advice, investment recommendations, or trading guidance. All investments involve risks, and past performance does not guarantee future results. You are solely responsible for your investment decisions and should conduct independent research and consult a qualified financial advisor before acting. MarketsFN.com and its authors are not liable for any losses or damages arising from your use of this information.
Related Articles
- European Session Crude Oil Report — 19 Oct 2026 — WTI hovers near $90.86 in early European trade, down 0.27% on the day as it extends its seven-day slide to 3.96%, while…
- US Session Crude Oil Report — 16 Oct 2026 — WTI crude is trading at $90.86 in the NYMEX session, down 0.27% on the day as it struggles to hold above the…
- European Session Crude Oil Report — 16 Oct 2026 — **European Session Crude Oil Report — 05 Oct 2026 11:00 NY** WTI hovers near $90.86, testing the lower bounds of its…
- US Session Crude Oil Report — 15 Oct 2026 — WTI crude is trading at $90.86 in early New York session action, holding just above the pivotal $89.46 support as Brent…
- European Session Crude Oil Report — 15 Oct 2026 — **European Session Crude Oil Report – 05 Oct 2026 (11:00 NY)** Crude markets hold steady in early European trade with…