MarketsFN
S&P 5005,963+0.54%
NASDAQ21,443+0.87%
DOW43,892+0.31%
DAX23,888+0.44%
FTSE 1008,721-0.12%
EUR/USD1.1465+0.07%
GBP/USD1.3220+0.14%
USD/JPY161.31-0.03%
Gold3,241+0.22%
WTI Oil76.40+0.81%
Bitcoin103,241+1.43%
10Y UST4.47%-9bp
S&P 5005,963+0.54%
NASDAQ21,443+0.87%
DOW43,892+0.31%
DAX23,888+0.44%
FTSE 1008,721-0.12%
EUR/USD1.1465+0.07%
GBP/USD1.3220+0.14%
USD/JPY161.31-0.03%
Gold3,241+0.22%
WTI Oil76.40+0.81%
Bitcoin103,241+1.43%
10Y UST4.47%-9bp
Economics

US jobless claims edge up slightly to 206,000, labor market remains stable

MarketsFN Data Team
•4 min read
US jobless claims edge up slightly to 206,000, labor market remains stable
Labour Market · Weekly Tracker

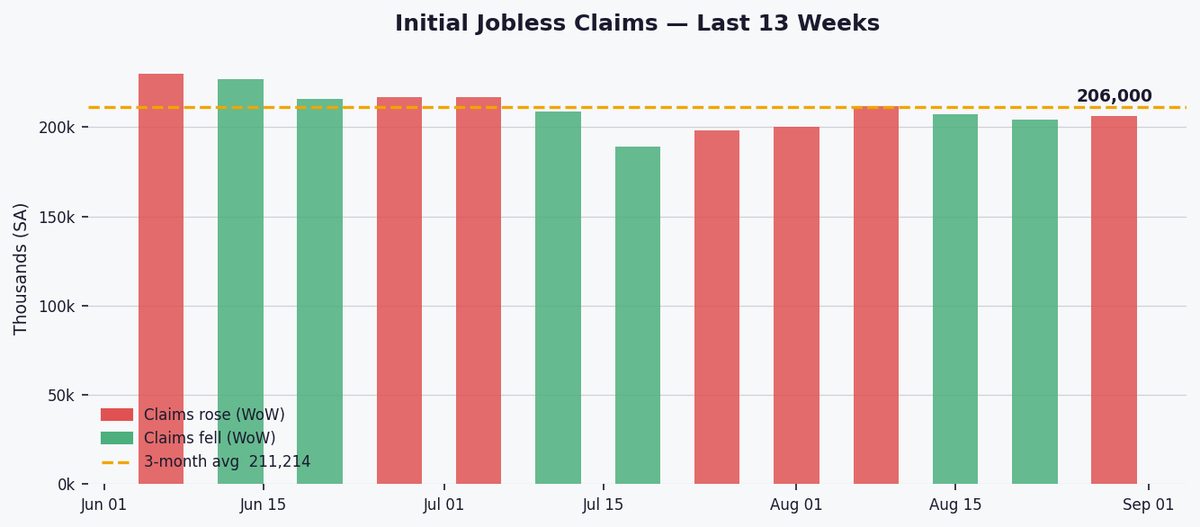
Initial jobless claims rose modestly to 206,000 in the week ending August 29, a 1.0% increase from the previous week's revised 204,000, signaling continued stability in the labor market.

The latest figure remains below the 3-month (211,214), 1-year (215,906), and 5-year averages (220,304), and well within the 52-week range of 189,000 to 259,000, reflecting sustained labor market resilience despite broader economic fluctuations.

The 4-week moving average dipped slightly to 207,250, suggesting a steady but stable trend in layoffs, with no significant uptick in labor market distress amid ongoing economic uncertainty.

36-month trend chart
Fig. 2 — Initial claims (light blue) and 4-week moving average (red) over 36 months. Dashed lines mark 1-year and 3-year averages.

Continued claims rose by 8,000 to 1,779,000, a 0.5% weekly increase, indicating marginally longer durations of unemployment benefits uptake but no sharp deterioration in reemployment prospects.

Key Statistics at a Glance

Latest (week ending)August 29, 2026
Initial claims206,000
WoW change▲ 2,000 (+1.0%)
4-week moving avg207,250
3-month avg211,214 (-2.5% vs current)
1-year avg215,906 (-4.6% vs current)
5-year avg220,304 (-6.5% vs current)
52-week high259,000
52-week low189,000
Continued claims1,779,000
Continued claims WoW+8,000 (+0.5%)
SignalStable
Data: Federal Reserve Bank of St. Louis (FRED) · Series: ICSA, IC4WSA, CCSA · Seasonally adjusted · Released every Thursday by the Bureau of Labor Statistics.
#US Economy#Jobless Claims#Labor Market#Unemployment#BLS#FRED#Federal Reserve#Initial Claims#Weekly Economic Data

Related Articles

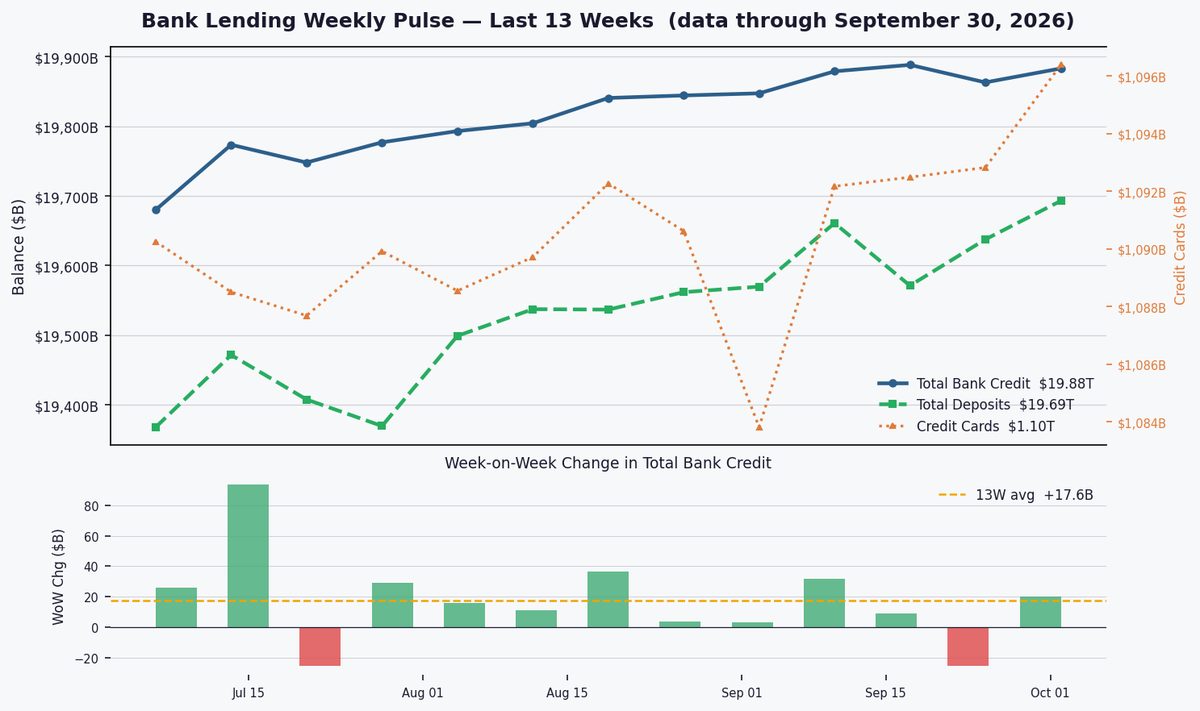
Bank credit expands $20.1B as C&I loans surge 10% YoY, outpacing sluggish real estate growth
Economics

Bank credit expands $20.1B as C&I loans surge 10% YoY, outpacing sluggish real estate growth

MarketsFN Data Team
5 minOct 16, 2026
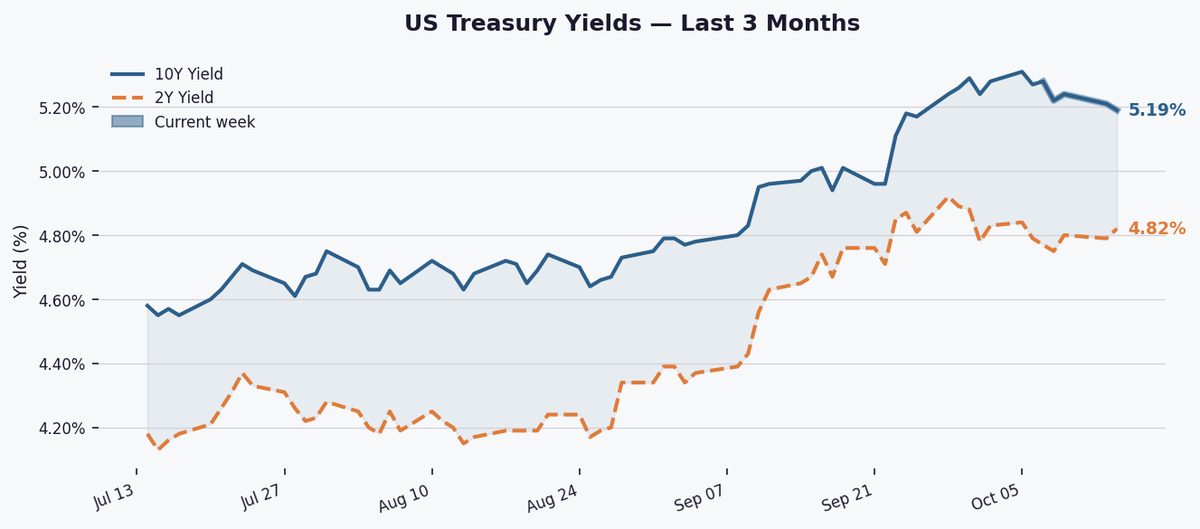
10Y Treasury Yields Fall 8 Bps to 5.19% as Curve Steepens
Economics

10Y Treasury Yields Fall 8 Bps to 5.19% as Curve Steepens

MarketsFN Data Team
4 minOct 16, 2026
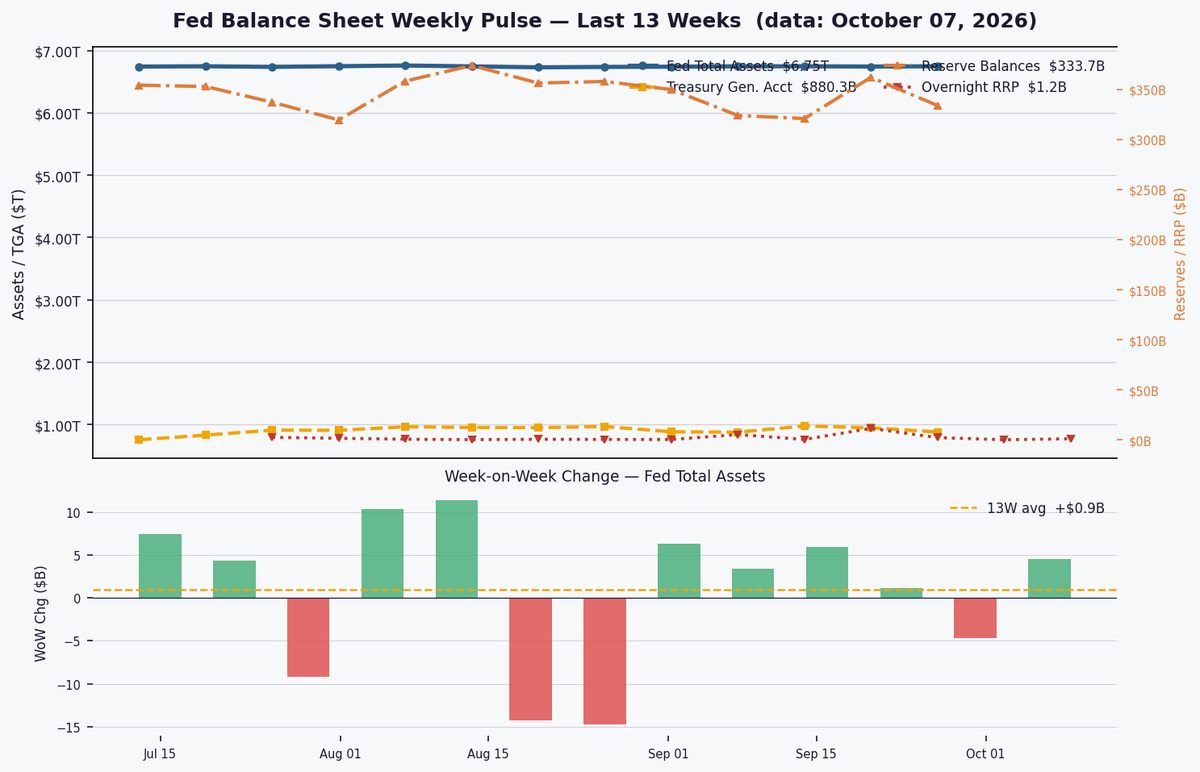
Fed balance sheet shrinks 24.7% to $6.75T as reserves hit critical $333.7B
Economics

Fed balance sheet shrinks 24.7% to $6.75T as reserves hit critical $333.7B

MarketsFN Data Team
5 minOct 15, 2026