US jobless claims dip to 203,000 as labor market holds steady
MarketsFN Data Team
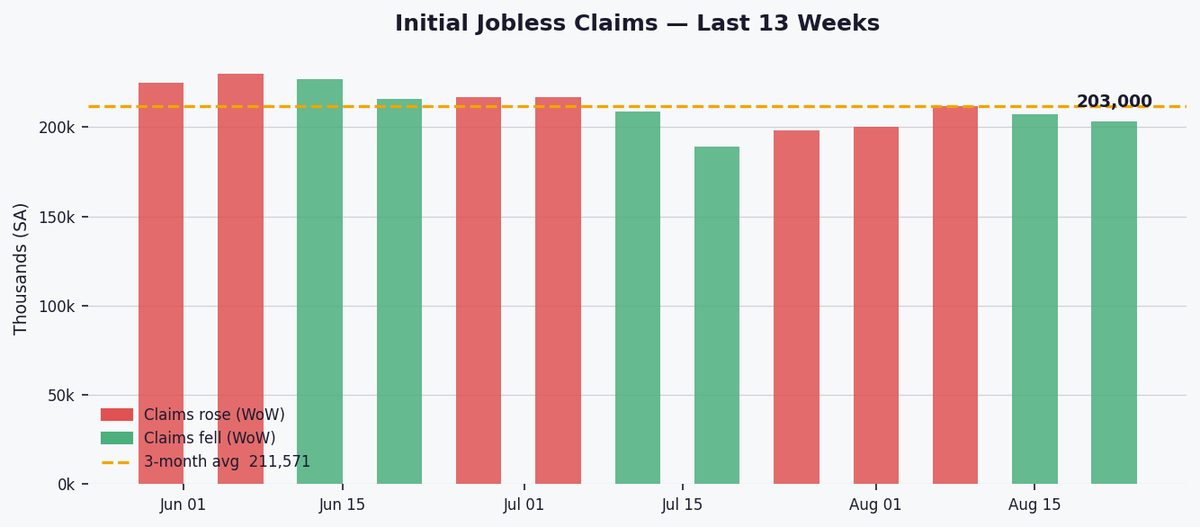
Initial jobless claims fell by 4,000 to 203,000 last week, marking a 1.9% decline and signaling continued stability in the US labor market amid resilient demand for workers.
The latest figure remains below the 3-month (211,571), 1-year (216,321), and 5-year (220,246) averages, underscoring sustained labor market strength. Claims are also well within the 52-week range of 189,000 to 259,000, reflecting a historically tight jobs market despite broader economic uncertainties.
The 4-week moving average edged down slightly to 205,500, reinforcing a gradual downward trend in layoffs. This smoothing of volatility suggests employers remain hesitant to shed workers, supporting the Fed’s view of a balanced but cooling labor market.

Continued claims dropped by 18,000 to 1,778,000, indicating fewer workers are staying on unemployment rolls. The 1.0% decline suggests rehiring or job-finding rates are holding up, though the pace of improvement has slowed compared to earlier in the year.
Key Statistics at a Glance
| Latest (week ending) | August 22, 2026 |
| Initial claims | 203,000 |
| WoW change | ▼ 4,000 (-1.9%) |
| 4-week moving avg | 205,500 |
| 3-month avg | 211,571 (-4.1% vs current) |
| 1-year avg | 216,321 (-6.2% vs current) |
| 5-year avg | 220,246 (-7.8% vs current) |
| 52-week high | 259,000 |
| 52-week low | 189,000 |
| Continued claims | 1,778,000 |
| Continued claims WoW | -18,000 (-1.0%) |
| Signal | Stable |