Fed balance sheet shrinks to $6.74T, reserves at critical $361.9B as QT continues
MarketsFN Data Team
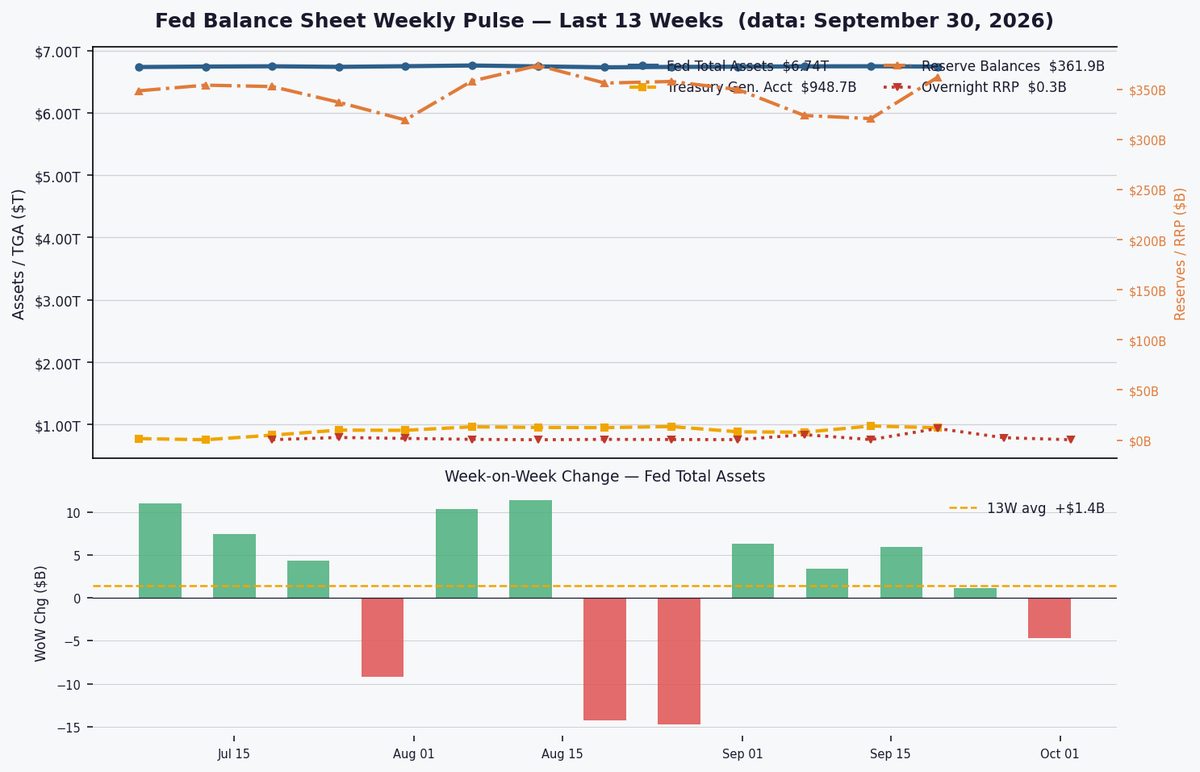
The H.4.1 — Factors Affecting Reserve Balances — is the Federal Reserve's weekly balance sheet statement, released every Thursday at 4:30 PM ET. It shows the Fed's total assets (currently $6.74T) and how those assets are funded (primarily through currency in circulation and bank reserve balances). Tracking the H.4.1 week-by-week reveals the pace of Quantitative Tightening (QT) and how much liquidity the Fed is withdrawing from the financial system.
Quantitative Easing (QE) — the Fed buys Treasuries and MBS, expanding its balance sheet and injecting reserves into banks, making credit cheap and abundant. The Fed's balance sheet peaked at $8.96T in April 2022. Quantitative Tightening (QT) reverses this: the Fed lets bonds mature without reinvesting, shrinking its balance sheet and draining reserves. The Fed has now removed $2.22T (24.8%) from the peak — tightening financial conditions.
Reserve balances are funds that commercial banks hold at the Fed. Currently at $361.9B, they represent the banking system's primary liquidity buffer. When reserves fall too low, banks scramble for overnight funding — exactly what triggered the September 2019 repo market crisis (reserves had fallen to ~$1.4T then). Economists estimate the "ample reserves" floor is around $1,500B. Below that, money market rates can spike unpredictably.
Two key drains on reserves: the Overnight Reverse Repo (RRP) facility, where money market funds park excess cash at the Fed (currently $0.3B, down from a $2.5T peak) — as this drains, that cash re-enters the banking system. The Treasury General Account (TGA) — the government's checking account at the Fed ($948.7B) — drains reserves when it rises (tax receipts) and injects reserves when it falls (government spending). Together, RRP + TGA movements drive weekly reserve volatility.
The Fed's balance sheet stands at $6.74T, down $2.22T (24.8%) from its April 2022 peak, with reserves at $361.9B — a critically low level that risks tightening financial conditions further.
The Fed has reduced its balance sheet by $2.22T (24.8%) since the April 2022 peak of $8.96T, with weekly declines averaging modestly below the $95B monthly cap. The $6.46T securities portfolio (95.9% of assets) shows Treasury runoff ($4.56T, 67.7%) outpacing MBS ($1.90T, 28.1%), reflecting slower mortgage prepayments. QT is proceeding slightly slower than the theoretical cap due to uneven MBS runoff, but remains on track overall.
Reserve balances at $361.9B are far below the estimated ample-reserves floor (~$1,500B) and near the critical threshold (~$600B), with a +4.0% YoY increase masking rapid recent drains. The overnight RRP facility has collapsed to $0.3B (from ~$2.5T peak), indicating money funds have fully exited. This suggests the banking system is nearing 2019-style scarcity risks, though Fed interventions have so far prevented repo market stress.

The TGA balance sits at $948.7B, down $28.4B WoW but up 17.2% YoY. High TGA levels drain reserves as Treasury inflows (taxes/issuance) lock up liquidity. A declining TGA (like this week) temporarily boosts reserves, but upcoming debt ceiling deadlines and seasonal issuance could reverse this. The Fed monitors TGA swings to anticipate reserve volatility.
Full Statistics Dashboard
| Metric | Latest Value | Change / Context | Frequency |
|---|---|---|---|
| Data through | September 30, 2026 | Weekly H.4.1 | |
| Fed total assets | $6.74T | ▼ $4.7B WoW +2.2% YoY | Weekly |
| QT reduction from peak | $2.22T | 24.8% shrinkage from $8.96T peak | |
| Treasury securities | $4.56T | 67.7% of assets | Weekly |
| MBS holdings | $1.90T | 28.1% of assets | Weekly |
| Reserve balances | $361.9B | ▲ $41.2B WoW +4.0% YoY | Weekly |
| Reserve signal | CRITICAL | Ample threshold ~$1,500B · Critical ~$600B | |
| Overnight RRP | $0.3B | ▼ $2.0B WoW (peak ~$2,500B) | Daily |
| Treasury Gen. Account | $948.7B | ▼ $28.4B WoW +17.2% YoY | Weekly |
| 10Y Treasury yield | 5.28% | context: QT drains reserves, may pressure yields | Daily |
Watch for FOMC signals on QT pacing as reserves approach scarcity thresholds (~$600B). Treasury's Q4 borrowing needs ($1.2T+) may drain reserves further unless offset by TGA drawdowns. The Fed could taper QT by year-end if reserves fall below critical levels, but for now, the $95B/month runoff continues.