Tron Holds Steady at $0.34 as RSI Nears Neutral
QuoteReporter
•3 min read
Tron Holds Steady at $0.34 as RSI Nears Neutral
Tron (TRX/USD) | September 09, 2026 $0.3394 +0.16%
🔍 Technical Analysis
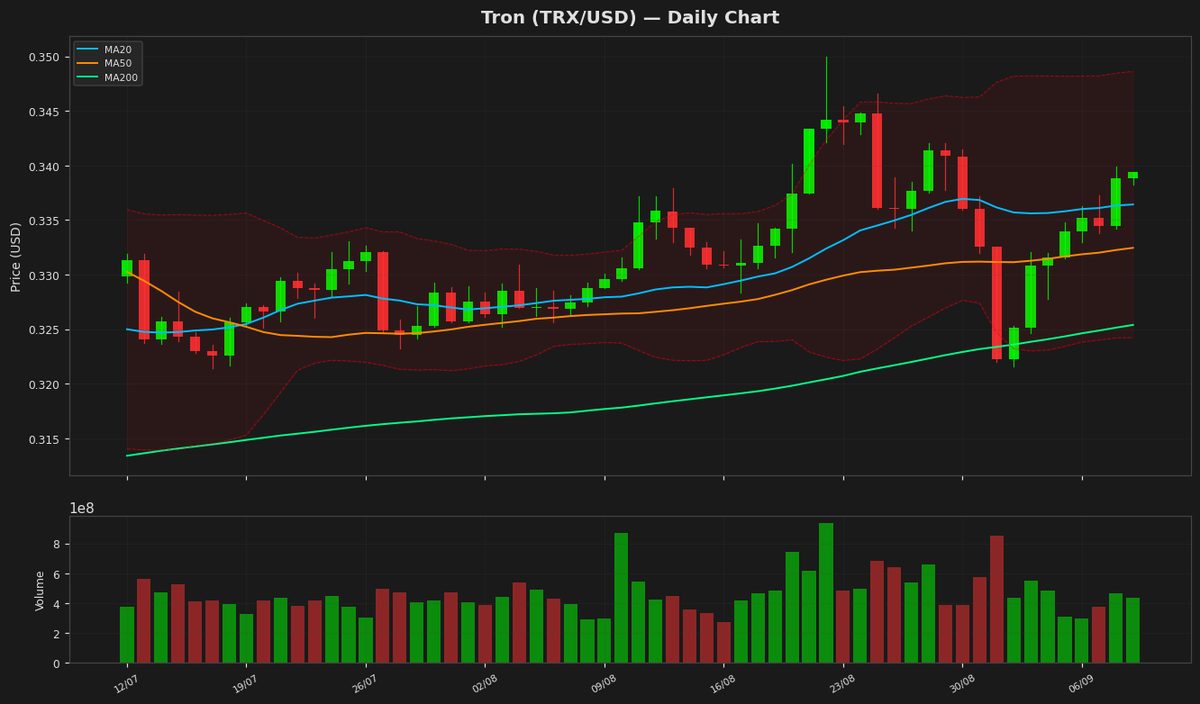
Tron (TRX) is currently trading at $0.339373, showing a marginal daily gain of 0.16%. The price action remains confined within a consolidation phase, hovering near the 20-day moving average (MA20) at $0.336427, which suggests a neutral short-term trend. The 50-day moving average (MA50) at $0.33245 and the 200-day moving average (MA200) at $0.325389 indicate a broader bullish bias, as the price remains above these key levels. Bollinger Bands reveal a narrowing range, with the upper band at $0.348624 and the lower band at $0.32423, signaling reduced volatility and potential for a breakout. The RSI(14) stands at 53.86719, reflecting a balanced momentum without overbought or oversold conditions. The MACD histogram shows a slight bullish crossover, with the MACD line at 0.000672 above the signal line at 0.000388, suggesting tentative upward momentum. Key resistance levels to watch are the 52-week high at $0.37633201 and the YTD high at the same level, while support lies at the MA200 ($0.325389) and the 52-week low at $0.26813799. The ATR(14) of 0.004774 indicates low volatility, reinforcing the consolidation narrative. A breakout above the upper Bollinger Band could signal renewed bullish momentum, while a drop below the MA200 may trigger a deeper correction.
Technical Metrics
| Metric | Value |
|---|---|
| Current Price | $0.3394 |
| Daily Change | +0.16% |
| MA 20 | $0.3364 |
| % from MA20 | +0.88% |
| MA 50 | $0.3324 |
| % from MA50 | +2.08% |
| MA 200 | $0.3254 |
| % from MA200 | +4.30% |
| BB Upper | $0.3486 |
| % from BB Upper | -2.65% |
| BB Lower | $0.3242 |
| % from BB Lower | +4.67% |
| RSI (14) | 53.87 |
| MACD | 0.000672 |
| MACD Signal | 0.000388 |
| ATR (14) | 0.004774 |
| 3-Day High | $0.3399 |
| 3-Day Low | $0.3338 |
| 52-Week High | $0.3763 |
| % from 52W High | -9.82% |
| 52-Week Low | $0.2681 |
| % from 52W Low | +26.57% |
| YTD High | $0.3763 |
| % from YTD High | -9.82% |
| YTD Low | $0.2681 |
| % from YTD Low | +26.57% |
📊 Market Commentary
Tron (TRX) is trading at $0.3394, showing modest gains of 0.16% today as the broader cryptocurrency market exhibits mixed sentiment. The Relative Strength Index (RSI) at 53.9 suggests neutral momentum, indicating neither overbought nor oversold conditions. TRX remains within its 52-week range of $0.2681 to $0.3763, reflecting a relatively stable performance despite recent market volatility.
Market sentiment around TRX is cautiously optimistic, supported by steady network activity and adoption in decentralized applications (dApps) and stablecoin transactions. Traders are closely watching the $0.3400 level, a near-term resistance zone. A sustained break above this level could signal further upside, while failure may see TRX retest support around $0.3200. The 200-day moving average near $0.3150 also serves as a key technical reference point for longer-term trend confirmation.
Volume trends have been moderate, indicating neither strong accumulation nor distribution. Institutional interest remains muted compared to larger-cap assets, but retail activity persists due to Tron’s low transaction fees and high throughput. Regulatory developments in the stablecoin sector, where Tron’s USDT plays a significant role, are also being monitored for potential impacts on TRX demand.
Overall, TRX appears range-bound with a slight bullish bias, but traders await clearer signals from broader market trends or network-specific catalysts before committing to stronger directional positions. The $0.3763 yearly high remains a psychological barrier for bulls, while the $0.2681 low provides a solid floor.
Market sentiment around TRX is cautiously optimistic, supported by steady network activity and adoption in decentralized applications (dApps) and stablecoin transactions. Traders are closely watching the $0.3400 level, a near-term resistance zone. A sustained break above this level could signal further upside, while failure may see TRX retest support around $0.3200. The 200-day moving average near $0.3150 also serves as a key technical reference point for longer-term trend confirmation.
Volume trends have been moderate, indicating neither strong accumulation nor distribution. Institutional interest remains muted compared to larger-cap assets, but retail activity persists due to Tron’s low transaction fees and high throughput. Regulatory developments in the stablecoin sector, where Tron’s USDT plays a significant role, are also being monitored for potential impacts on TRX demand.
Overall, TRX appears range-bound with a slight bullish bias, but traders await clearer signals from broader market trends or network-specific catalysts before committing to stronger directional positions. The $0.3763 yearly high remains a psychological barrier for bulls, while the $0.2681 low provides a solid floor.
Disclaimer
The content on MarketsFN.com is provided for educational and informational purposes only. It does not constitute financial advice or investment recommendations. All investments involve risk. Cryptocurrency markets are highly volatile. Past performance does not guarantee future results.