MarketsFN
S&P 5005,963+0.54%
NASDAQ21,443+0.87%
DOW43,892+0.31%
DAX23,888+0.44%
FTSE 1008,721-0.12%
EUR/USD1.1465+0.07%
GBP/USD1.3220+0.14%
USD/JPY161.31-0.03%
Gold3,241+0.22%
WTI Oil76.40+0.81%
Bitcoin103,241+1.43%
10Y UST4.47%-9bp
S&P 5005,963+0.54%
NASDAQ21,443+0.87%
DOW43,892+0.31%
DAX23,888+0.44%
FTSE 1008,721-0.12%
EUR/USD1.1465+0.07%
GBP/USD1.3220+0.14%
USD/JPY161.31-0.03%
Gold3,241+0.22%
WTI Oil76.40+0.81%
Bitcoin103,241+1.43%
10Y UST4.47%-9bp
Economics

10Y Yield Eases to 4.77% as Curve Stays Positive; 2Y Outperforms

MarketsFN Data Team
4 min read
10Y Yield Eases to 4.77% as Curve Stays Positive; 2Y Outperforms
Fixed Income · Treasury Yields · Mid-Week Update

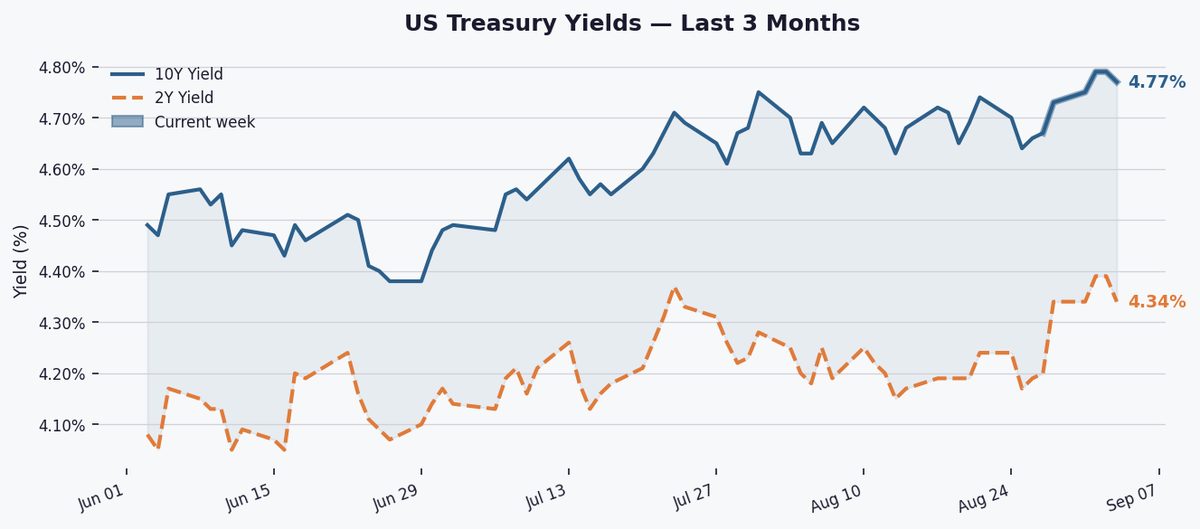
The 10-year Treasury yield dipped 2 bps to 4.77% on Tuesday, trimming its weekly gain to 10 bps, while the 2Y-10Y spread held positive at 41 bps, signaling persistent growth expectations.

The 10-year yield remains elevated, up 10 bps this week and 58 bps YTD, hovering well above its 3-month (4.60%) and 1-year (4.31%) averages. It sits just 2 bps below its 52-week high of 4.79%, reflecting sustained pressure from sticky inflation and Fed hawkishness.

The 2Y-10Y spread widened 2 bps WoW to +41 bps, maintaining a positive slope. While below its 52-week high of +74 bps, the curve’s steepening bias suggests markets still price in economic resilience, contrasting with inversion’s traditional recession signal. The 2Y’s 14 bps weekly jump underscores front-end Fed sensitivity.

36-month yield spread chart
Fig. 2 — 2Y–10Y Treasury spread over 36 months. Green fill = normal curve; red fill = inverted (recession warning signal). Grey shading marks NBER-defined recessions where applicable.

Traders await Thursday’s jobless claims and Friday’s Michigan inflation expectations for Fed clues. Any dovish Fedspeak or soft data could cap yields, while hawkish rhetoric or strong payrolls previews may push 10Y toward 4.80%. Oil prices and equity volatility remain secondary risks.

Key Statistics at a Glance

EditionMid-Week Update
DateTuesday, September 08, 2026
10Y Yield4.77%
10Y Day-on-day▲ 2.0 bps
10Y Week-on-week▲ 10.0 bps
10Y YTD change+58.0 bps
10Y 3-month avg4.60%
10Y 1-year avg4.31%
10Y 52-week high4.79%
10Y 52-week low3.97%
2Y Yield4.34%
2Y–10Y Spread+0.410% (+41.0 bps)
Spread WoW▲ 2.0 bps
Spread 52-week high+0.740%
Spread 52-week low+0.270%
Curve signalPositive
Data: Federal Reserve Bank of St. Louis (FRED) · Series: DGS10, DGS2, T10Y2Y, USREC · Daily, business days only · Source: US Treasury / Federal Reserve.
#US Treasuries#Bond Market#Yield Curve#Interest Rates#10-Year Treasury#2-Year Treasury#2Y10Y Spread#Federal Reserve#Fixed Income#FRED

Related Articles

Mortgage Rates Edge Up to 6.66%, Pushing Monthly Payments Higher
Economics

Mortgage Rates Edge Up to 6.66%, Pushing Monthly Payments Higher

MarketsFN Data Team
4 minSep 3, 2026
US jobless claims edge up slightly to 206,000, labor market remains stable
Economics

US jobless claims edge up slightly to 206,000, labor market remains stable

MarketsFN Data Team
4 minSep 3, 2026
Fed balance sheet shrinks to $6.73T, reserves hit critical $356.2B as QT drains liquidity
Economics

Fed balance sheet shrinks to $6.73T, reserves hit critical $356.2B as QT drains liquidity

MarketsFN Data Team
5 minSep 1, 2026
10Y Yield Eases to 4.77% as Curve Stays Positive; 2Y Outperforms | MarketsFN


