Fed balance sheet shrinks to $6.73T, reserves hit critical $356.2B as QT drains liquidity
MarketsFN Data Team
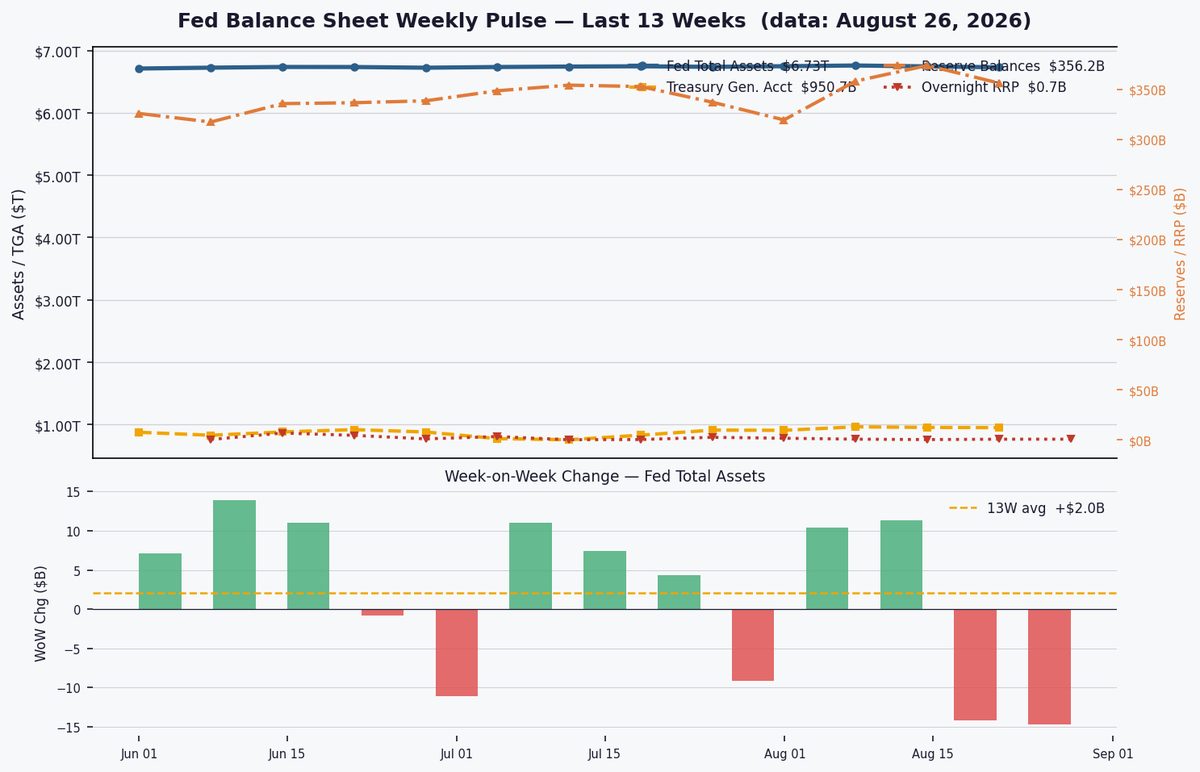
The H.4.1 — Factors Affecting Reserve Balances — is the Federal Reserve's weekly balance sheet statement, released every Thursday at 4:30 PM ET. It shows the Fed's total assets (currently $6.73T) and how those assets are funded (primarily through currency in circulation and bank reserve balances). Tracking the H.4.1 week-by-week reveals the pace of Quantitative Tightening (QT) and how much liquidity the Fed is withdrawing from the financial system.
Quantitative Easing (QE) — the Fed buys Treasuries and MBS, expanding its balance sheet and injecting reserves into banks, making credit cheap and abundant. The Fed's balance sheet peaked at $8.96T in April 2022. Quantitative Tightening (QT) reverses this: the Fed lets bonds mature without reinvesting, shrinking its balance sheet and draining reserves. The Fed has now removed $2.23T (24.9%) from the peak — tightening financial conditions.
Reserve balances are funds that commercial banks hold at the Fed. Currently at $356.2B, they represent the banking system's primary liquidity buffer. When reserves fall too low, banks scramble for overnight funding — exactly what triggered the September 2019 repo market crisis (reserves had fallen to ~$1.4T then). Economists estimate the "ample reserves" floor is around $1,500B. Below that, money market rates can spike unpredictably.
Two key drains on reserves: the Overnight Reverse Repo (RRP) facility, where money market funds park excess cash at the Fed (currently $0.7B, down from a $2.5T peak) — as this drains, that cash re-enters the banking system. The Treasury General Account (TGA) — the government's checking account at the Fed ($950.7B) — drains reserves when it rises (tax receipts) and injects reserves when it falls (government spending). Together, RRP + TGA movements drive weekly reserve volatility.
The Fed's balance sheet stands at $6.73T, down $2.23T (24.9%) from its April 2022 peak, with reserves plunging to $356.2B — nearing levels that could disrupt short-term funding markets as liquidity grows scarce.
The Fed has reduced its balance sheet by $2.23T (24.9%) from the April 2022 peak of $8.96T, with weekly declines averaging below the $95B monthly cap. The $6.46T securities portfolio (96% of assets) shows Treasury runoff ($4.55T) outpacing MBS ($1.91T), suggesting QT is proceeding slower on MBS due to slower prepayments. The $13.2B weekly securities decline indicates the Fed is not maxing out its runoff capacity.
Bank reserves have fallen to $356.2B, far below the estimated ample-reserves floor of ~$1,500B and nearing the ~$600B critical threshold. A 7.0% YoY drop signals rapid drain, exacerbated by the overnight RRP facility's collapse to $0.7B (from ~$2.5T peak). This suggests the banking system is approaching 2019-style scarcity, risking repo market stress if reserves fall further.

The Treasury General Account sits at $950.7B, up 41.4% YoY. A high TGA drains reserves as tax receipts and bond issuance lock up liquidity. The recent $2.9B WoW decline hints at modest relief, but upcoming debt ceiling deadlines or seasonal issuance could swing the TGA sharply, impacting reserve dynamics in the weeks ahead.
Full Statistics Dashboard
| Metric | Latest Value | Change / Context | Frequency |
|---|---|---|---|
| Data through | August 26, 2026 | Weekly H.4.1 | |
| Fed total assets | $6.73T | ▼ $14.8B WoW +1.9% YoY | Weekly |
| QT reduction from peak | $2.23T | 24.9% shrinkage from $8.96T peak | |
| Treasury securities | $4.55T | 67.5% of assets | Weekly |
| MBS holdings | $1.91T | 28.4% of assets | Weekly |
| Reserve balances | $356.2B | ▼ $17.5B WoW -7.0% YoY | Weekly |
| Reserve signal | CRITICAL | Ample threshold ~$1,500B · Critical ~$600B | |
| Overnight RRP | $0.7B | ▼ $6.0B WoW (peak ~$2,500B) | Daily |
| Treasury Gen. Account | $950.7B | ▼ $2.9B WoW +41.4% YoY | Weekly |
| 10Y Treasury yield | 4.75% | context: QT drains reserves, may pressure yields | Daily |
Watch for Fed signals on QT pacing as reserves near scarcity thresholds (~$600B). Upcoming FOMC meetings may address runoff caps, while Treasury issuance plans (e.g., bill supply shifts) could temporarily inject reserves. The Fed faces a tightening liquidity squeeze, with market stability hinging on reserve levels and TGA movements.