S&P 5005,963+0.54%
NASDAQ21,443+0.87%
DOW43,892+0.31%
DAX23,888+0.44%
FTSE 1008,721-0.12%
EUR/USD1.1465+0.07%
GBP/USD1.3220+0.14%
USD/JPY161.31-0.03%
Gold3,241+0.22%
WTI Oil76.40+0.81%
Bitcoin103,241+1.43%
10Y UST4.47%-9bp
S&P 5005,963+0.54%
NASDAQ21,443+0.87%
DOW43,892+0.31%
DAX23,888+0.44%
FTSE 1008,721-0.12%
EUR/USD1.1465+0.07%
GBP/USD1.3220+0.14%
USD/JPY161.31-0.03%
Gold3,241+0.22%
WTI Oil76.40+0.81%
Bitcoin103,241+1.43%
10Y UST4.47%-9bp
MarketsFN
Economics

10Y Yield Jumps 6bps to 4.73% as Curve Stays Positive

MarketsFN Data Team
4 min read
10Y Yield Jumps 6bps to 4.73% as Curve Stays Positive
Fixed Income · Treasury Yields · Mid-Week Update

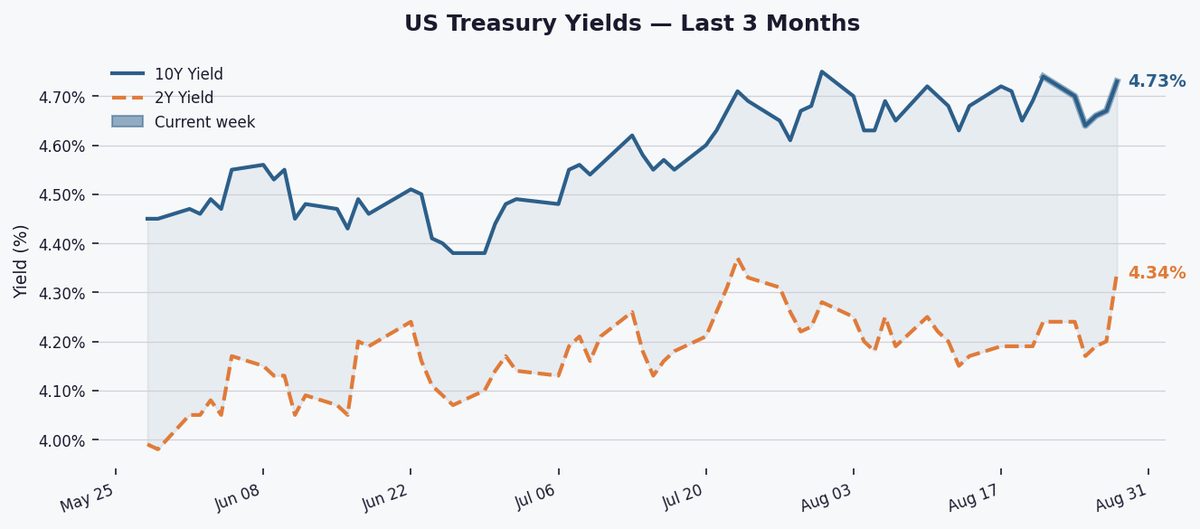
The 10-year Treasury yield rose 6bps to 4.73% on Tuesday, extending recent volatility while maintaining a positive curve signal with the 2Y-10Y spread at +41bps.

The 10-year yield is down 1bp week-on-week but remains elevated, sitting 15bps above its 3-month average (4.578%) and 43bps above its 1-year average (4.297%). It now hovers just 2bps below its 52-week high of 4.75%, having climbed 54bps year-to-date from 2025's troughs.

The 2Y-10Y spread narrowed 5bps this week to +41bps, remaining positively sloped but well below its 52-week peak of +74bps. Historically, such a spread suggests modest growth expectations, though its compression reflects recent short-end pressure as markets weigh Fed policy paths.

36-month yield spread chart
Fig. 2 — 2Y–10Y Treasury spread over 36 months. Green fill = normal curve; red fill = inverted (recession warning signal). Grey shading marks NBER-defined recessions where applicable.

Markets await Friday's August jobs report for Fed clues, with yields sensitive to any payroll surprises. Fed speakers and ISM services data could also shift rate expectations, while technical resistance near 4.75% looms for the 10Y.

Key Statistics at a Glance

EditionMid-Week Update
DateTuesday, September 01, 2026
10Y Yield4.73%
10Y Day-on-day▼ 6.0 bps
10Y Week-on-week▼ 1.0 bps
10Y YTD change+54.0 bps
10Y 3-month avg4.58%
10Y 1-year avg4.30%
10Y 52-week high4.75%
10Y 52-week low3.97%
2Y Yield4.34%
2Y–10Y Spread+0.410% (+41.0 bps)
Spread WoW▼ 5.0 bps
Spread 52-week high+0.740%
Spread 52-week low+0.270%
Curve signalPositive
Data: Federal Reserve Bank of St. Louis (FRED) · Series: DGS10, DGS2, T10Y2Y, USREC · Daily, business days only · Source: US Treasury / Federal Reserve.
#US Treasuries#Bond Market#Yield Curve#Interest Rates#10-Year Treasury#2-Year Treasury#2Y10Y Spread#Federal Reserve#Fixed Income#FRED

Related Articles

Fed balance sheet shrinks to $6.73T, reserves hit critical $356.2B as QT drains liquidity
Economics

Fed balance sheet shrinks to $6.73T, reserves hit critical $356.2B as QT drains liquidity

MarketsFN Data Team
5 minSep 1, 2026
US jobless claims dip to 203,000 as labor market holds steady
Economics

US jobless claims dip to 203,000 as labor market holds steady

MarketsFN Data Team
4 minSep 1, 2026
Mortgage rates inch up to 6.66%, pushing monthly payments $87 higher than last year
Economics

Mortgage rates inch up to 6.66%, pushing monthly payments $87 higher than last year

MarketsFN Data Team
4 minSep 1, 2026