S&P 500 52-Week Highs & Lows Radar: Apple (AAPL), Mosaicmpany (MOS) and more
MarketsFN Team

Screening all 503 S&P 500 constituents for stocks nearest to their 52-week high and their 52-week low. Data as of October 16, 2026. % Realized = 52-week total return.
Legend: RSI > 70 = overbought · RSI < 30 = oversold · Green % Realized = positive 52W return · Red = negative.
📈 Nearest to 52-Week High
Sectors represented: Financial (3), Technology (1), Healthcare (1)
| Ticker | Company | Sector | Price Last | % Realized | 52-Week High Date | RSI | % above MA200 | Trend |
|---|---|---|---|---|---|---|---|---|
| AAPL | Apple Inc | Technology | $344.08 | +39.05% | 2026-10-16 | 63.2 | +17.6% | Above MA20, MA50, MA200 |
| BRK-B | Berkshire Hathaway Inc | Financial | $531.97 | +8.83% | 2026-10-16 | 75.1 | +7.8% | Above MA20, MA50, MA200 |
| V | Visa Inc | Financial | $403.82 | +20.40% | 2026-10-16 | 74.2 | +19.1% | Above MA20, MA50, MA200 |
| MA | Mastercard Incorporated | Financial | $621.39 | +13.00% | 2026-10-16 | 76.3 | +16.6% | Above MA20, MA50, MA200 |
| ABBV | Abbvie Inc | Healthcare | $283.98 | +25.18% | 2026-10-16 | 70.0 | +21.4% | Above MA20, MA50, MA200 |
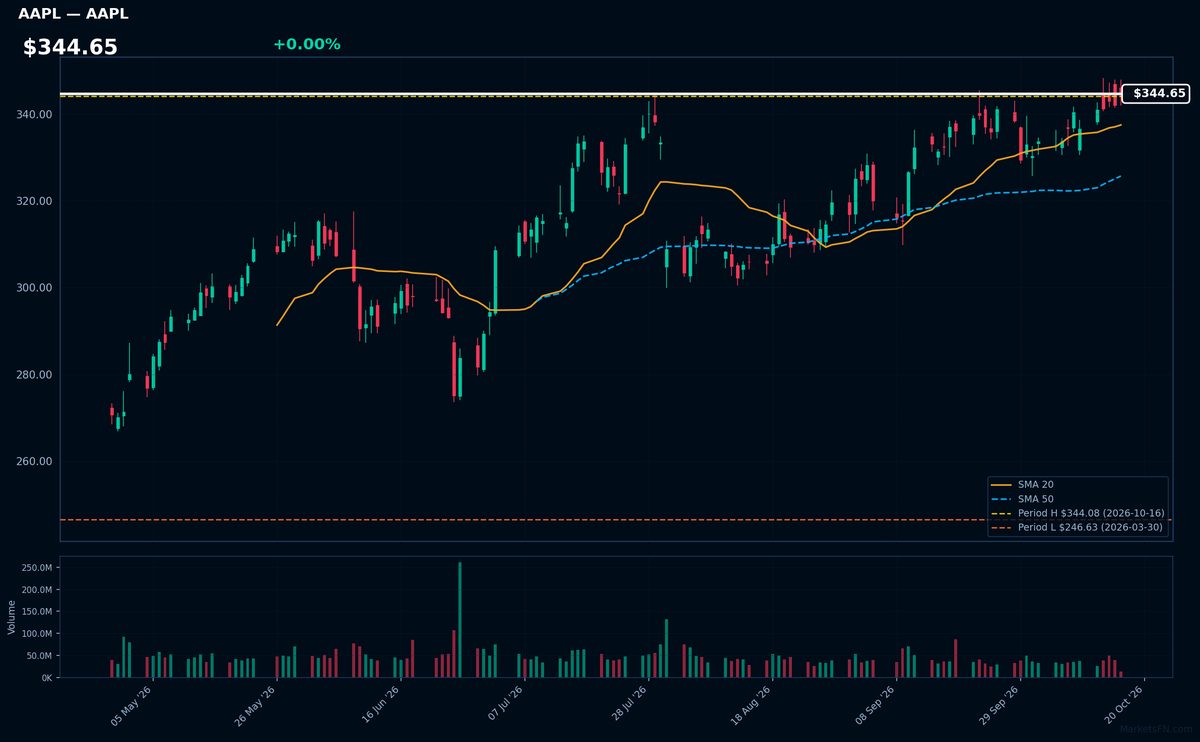
AAPL | Apple Inc | Technology | Price Last: $344.08 | % Realized: +39.05% | RSI: 63.2 | % above MA200: +17.6% | Trend: Above MA20, MA50, MA200
Apple designs premium consumer electronics (iPhone, Mac), operates services (App Store, iCloud), and monetizes 1.8B active devices through ecosystem lock-in. Investors care about its pricing power, recurring revenue streams, and industry-leading $110B annual R&D budget driving AR/VR and AI initiatives.
AAPL shows bullish momentum at $344.65 (0.0% below 52W high) with RSI(14) at 63.2 and sustained uptrend (price > MA20 > MA50 > MA200). The 39.1% 52W return suggests institutional accumulation, though RSI nears overbought territory.
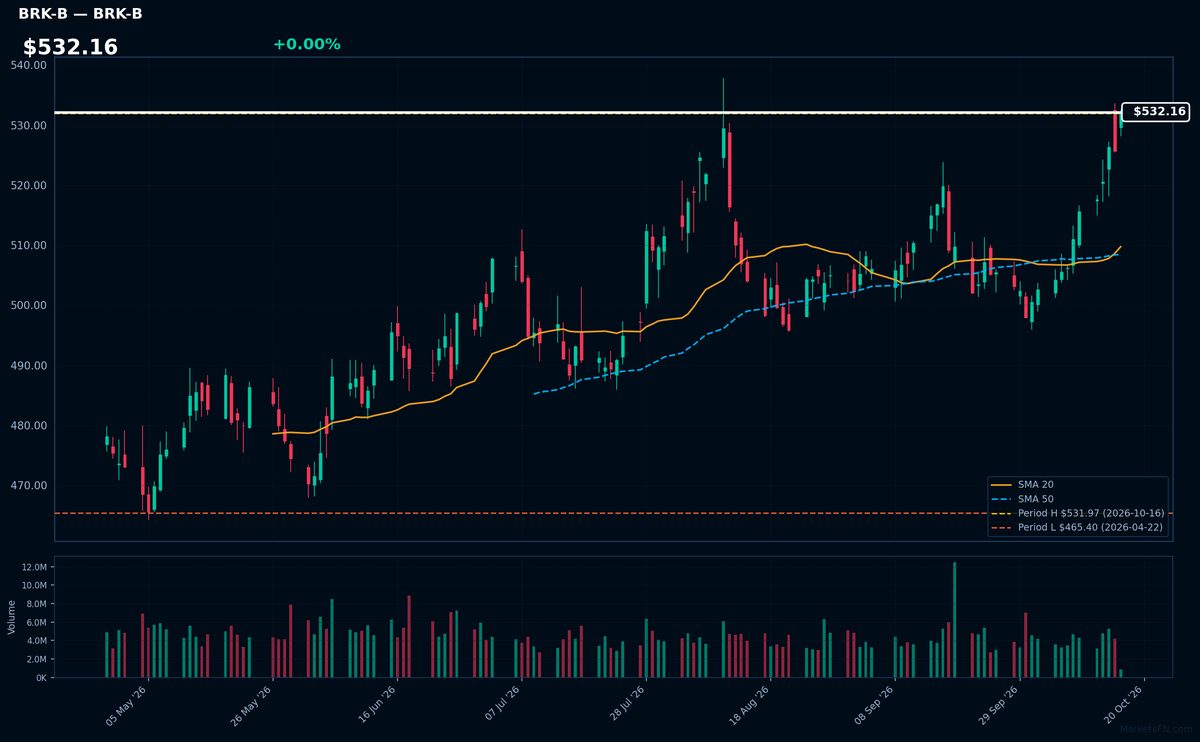
BRK-B | Berkshire Hathaway Inc | Financial | Price Last: $531.97 | % Realized: +8.83% | RSI: 75.1 | % above MA200: +7.8% | Trend: Above MA20, MA50, MA200
Berkshire Hathaway operates a diversified portfolio of wholly-owned businesses (GEICO, BNSF, utilities) and major equity stakes (Apple, Bank of America). Investors care for its unique capital allocation under Warren Buffett, combining insurance float with value investing at scale.
Technically bullish with RSI(14) at 75.1 (overbought) and price > MA20 > MA50 > MA200. At 52-week highs (+8.8% YTD), momentum dominates but RSI warrants caution. No fundamental data provided to assess valuation.
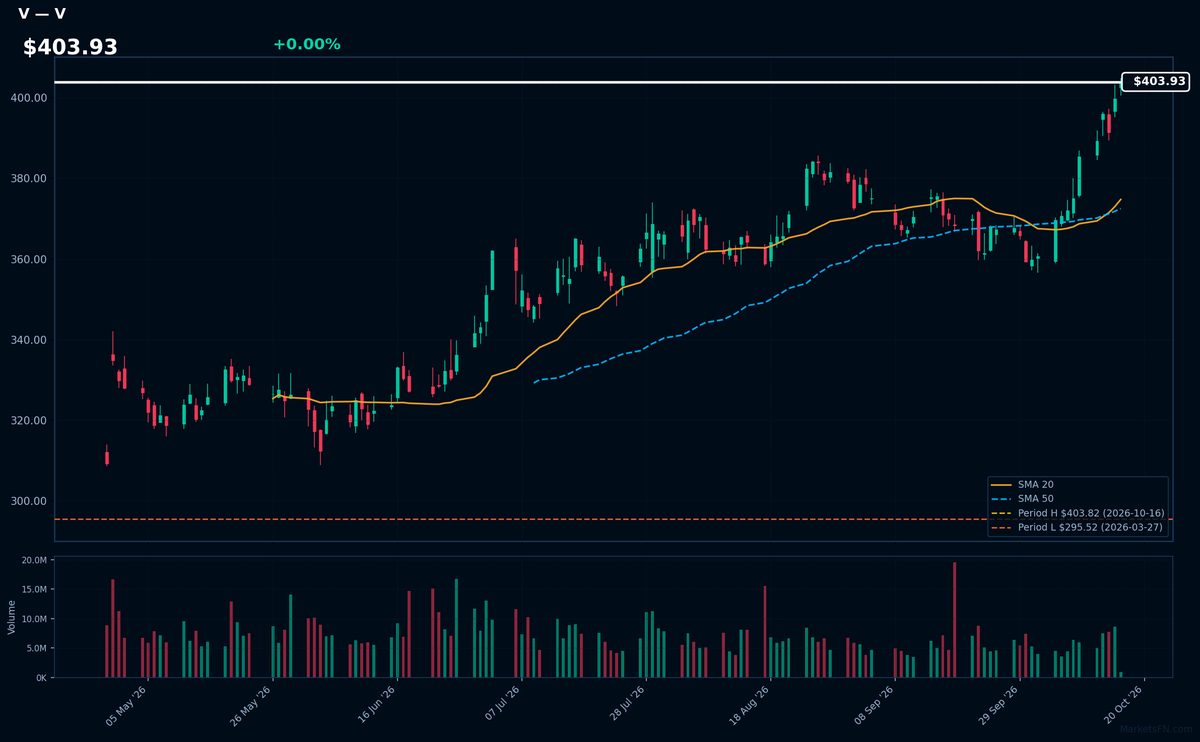
V | Visa Inc | Financial | Price Last: $403.82 | % Realized: +20.40% | RSI: 74.2 | % above MA200: +19.1% | Trend: Above MA20, MA50, MA200
Visa operates the world's largest electronic payments network, processing over $14 trillion annually. Investors care because its asset-light model (no lending risk) generates 60%+ operating margins as global cashless adoption grows, with pricing power from its entrenched network effects.
Technically overbought (RSI 74.2) but in strong uptrend (price > MA20 > MA50 > MA200). At 52-week highs after 20.4% YTD gain, momentum suggests continuation though RSI signals caution.
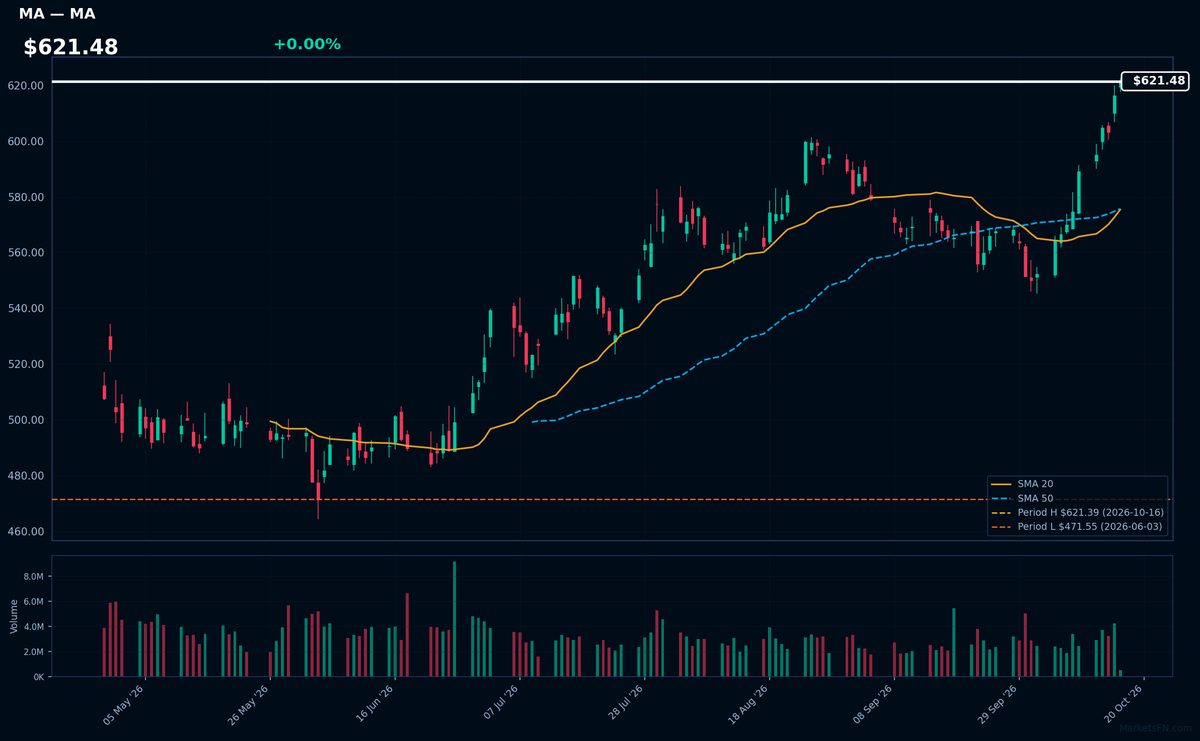
MA | Mastercard Incorporated | Financial | Price Last: $621.39 | % Realized: +13.00% | RSI: 76.3 | % above MA200: +16.6% | Trend: Above MA20, MA50, MA200
Mastercard operates a global payment network processing over $8 trillion annually. Investors care because its asset-light model generates 50%+ operating margins from every card swipe, benefiting from the secular shift to digital payments and cross-border transaction growth.
At $621.48 (0.0% below 52W high), MA shows momentum (RSI 76.3, above MA20/50/200) but overbought signals. The 13.0% 52W return suggests fundamental strength, though extreme RSI warrants caution near all-time highs.
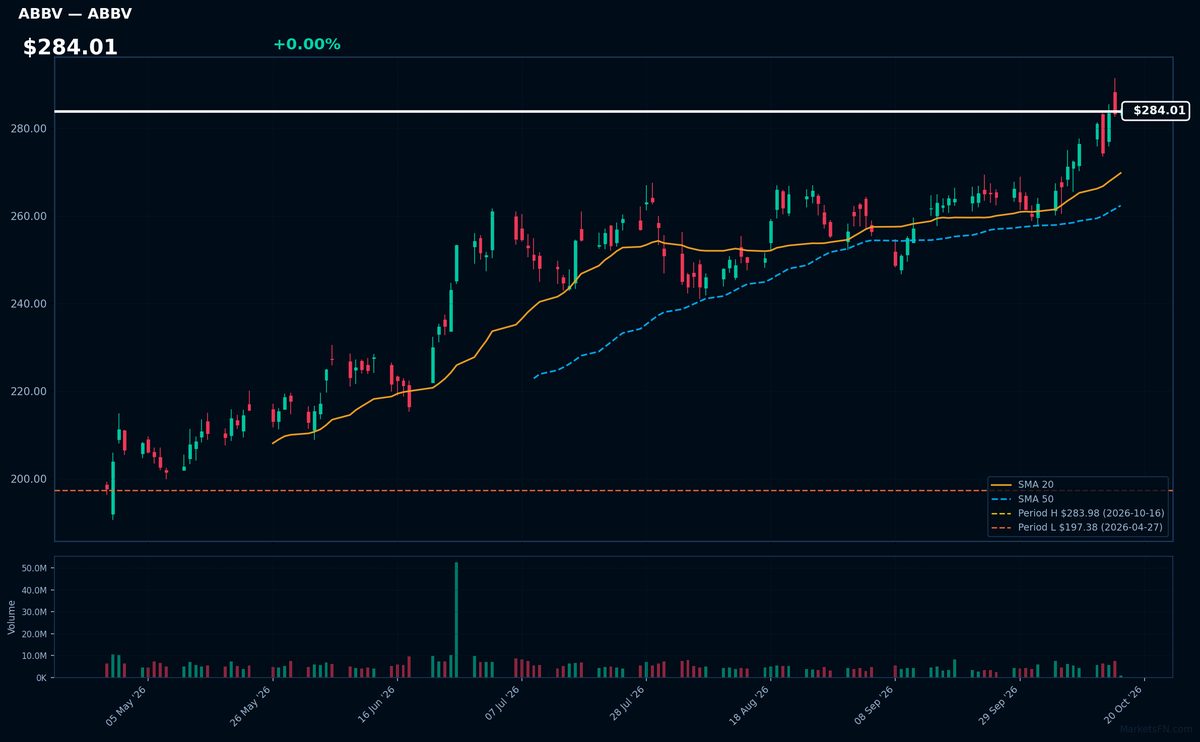
ABBV | Abbvie Inc | Healthcare | Price Last: $283.98 | % Realized: +25.18% | RSI: 70.0 | % above MA200: +21.4% | Trend: Above MA20, MA50, MA200
AbbVie is a biopharmaceutical leader specializing in immunology and oncology drugs, including blockbuster Humira. Investors care because its patent-cliff management and pipeline (like Skyrizi/Rinvoq) drive consistent cash flows, making it both a defensive play and growth story in healthcare.
Technically bullish with RSI(14) at 70.0 (overbought) and price > MA20 > MA50 > MA200. The stock sits at its 52-week high (+25.2% YoY), suggesting strong momentum but requiring caution near resistance. MA alignment confirms uptrend, though RSI hints at potential consolidation.
📉 Nearest to 52-Week Low
Sectors represented: Communication Services (2), Basic Materials (1), Consumer Cyclical (1), Real Estate (1)
| Ticker | Company | Sector | Price Last | % Realized | 52-Week Low Date | RSI | % above MA200 | Trend |
|---|---|---|---|---|---|---|---|---|
| MOS | Mosaic Company | Basic Materials | $19.03 | -35.34% | 2026-10-09 | 27.9 | -21.6% | Below MA20, MA50, MA200 |
| MGM | MGM Resorts International | Consumer Cyclical | $29.44 | -7.10% | 2026-10-14 | 19.9 | -25.2% | Below MA20, MA50, MA200 |
| TKO | TKO Group Holdings Inc | Communication Services | $176.80 | -5.87% | 2026-10-14 | 43.6 | -9.2% | Below MA20, MA50, MA200 |
| MAA | Mid-America Apartment Communities, Inc | Real Estate | $117.14 | -10.87% | 2026-10-07 | 41.6 | -9.9% | Above MA20 · Below MA50, MA200 |
| PSKY | Paramount Skydance Corp | Communication Services | $7.26 | -8.68% | 2026-10-14 | nan | — | — |
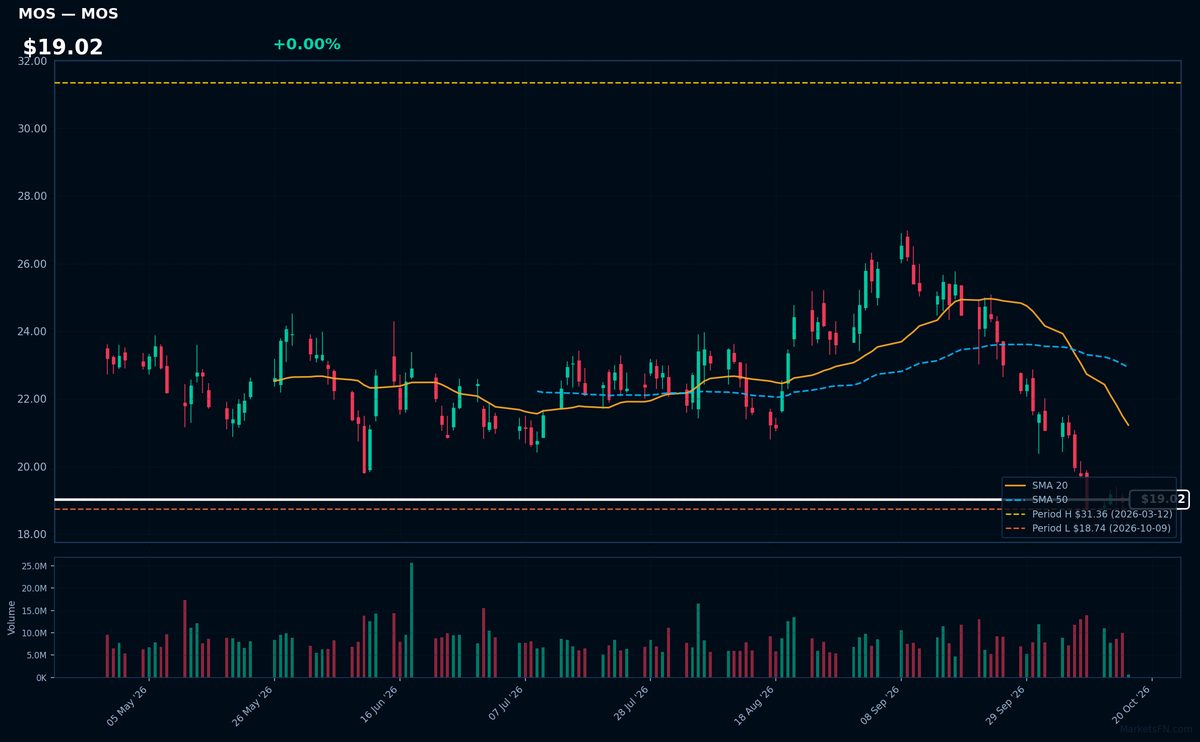
MOS | Mosaic Company | Basic Materials | Price Last: $19.03 | % Realized: -35.34% | RSI: 27.9 | % above MA200: -21.6% | Trend: Below MA20, MA50, MA200
Mosaic Company produces concentrated phosphate and potash crop nutrients for global agriculture. Investors monitor MOS as a fertilizer pure-play tied to crop prices and farm economics, with volatile earnings cycles that create trading opportunities.
Technically distressed: RSI(14) at 27.9 shows oversold conditions amid bearish MA alignment (price < MA20 < MA50 < MA200). Testing 52-week low support (-35.3% YoY) signals severe downside momentum, not fundamental strength.
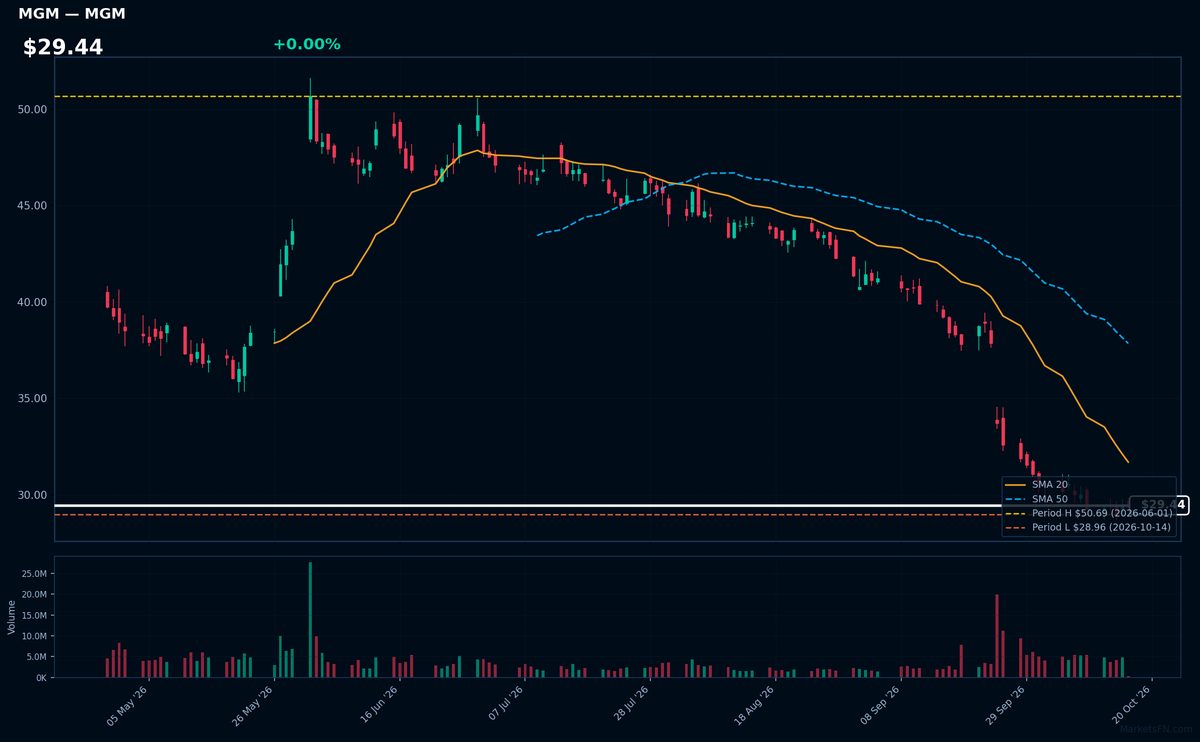
MGM | MGM Resorts International | Consumer Cyclical | Price Last: $29.44 | % Realized: -7.10% | RSI: 19.9 | % above MA200: -25.2% | Trend: Below MA20, MA50, MA200
MGM Resorts International operates iconic casino resorts like Bellagio and MGM Grand in Las Vegas, Macau, and regional U.S. markets. Investors watch its high-margin hospitality/convention business and digital betting expansion, though cyclicality and Macau regulatory risks remain key factors.
MGM shows extreme technical weakness: RSI(14) at 19.9 (deeply oversold) with sustained bearish MA alignment (price < MA20 < MA50 < MA200). Trading just 1.7% above 52-week lows after a 7.1% annual decline, this signals capitulation, not momentum.
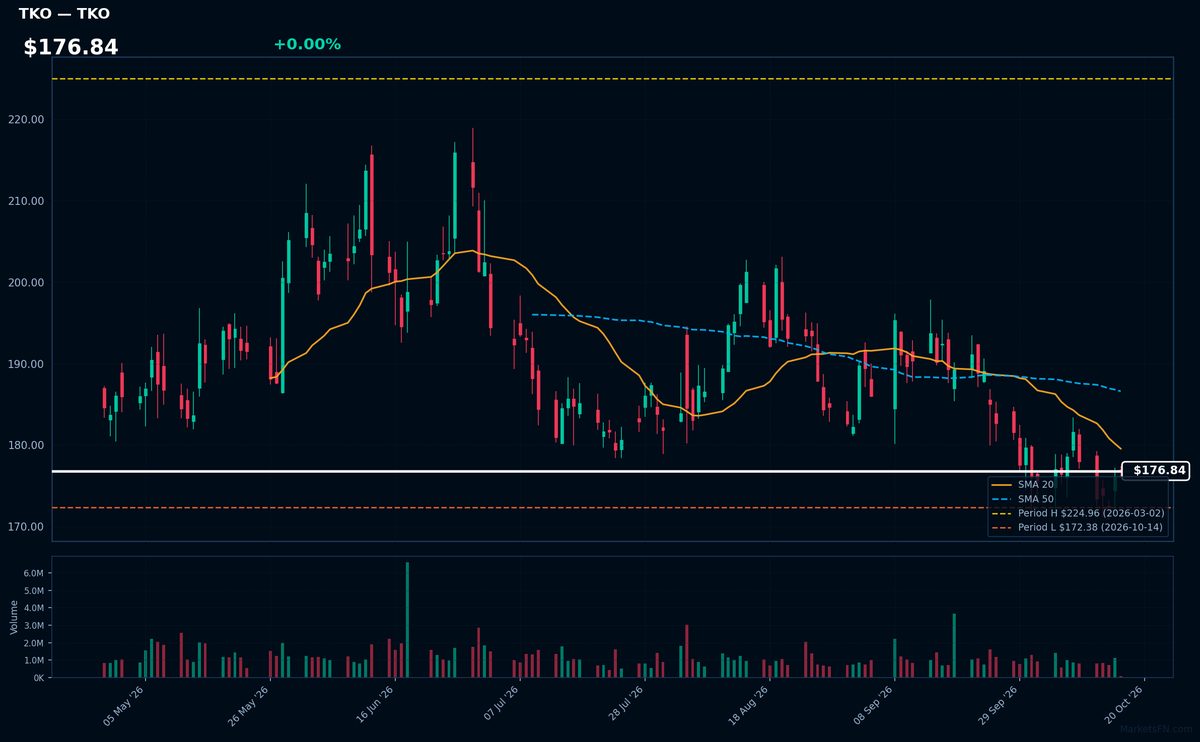
TKO | TKO Group Holdings Inc | Communication Services | Price Last: $176.80 | % Realized: -5.87% | RSI: 43.6 | % above MA200: -9.2% | Trend: Below MA20, MA50, MA200
TKO Group Holdings operates in the sports entertainment sector, focusing on live events and media rights. Investors should monitor its performance given the cyclical nature of sports media revenues and its exposure to fluctuating consumer discretionary spending.
TKO shows bearish momentum with an RSI(14) of 43.6 and sustained downtrend (price < MA20 < MA50 < MA200). Trading just 2.6% above its 52-week low, the stock tests critical support after a -5.9% annual decline, signaling caution.
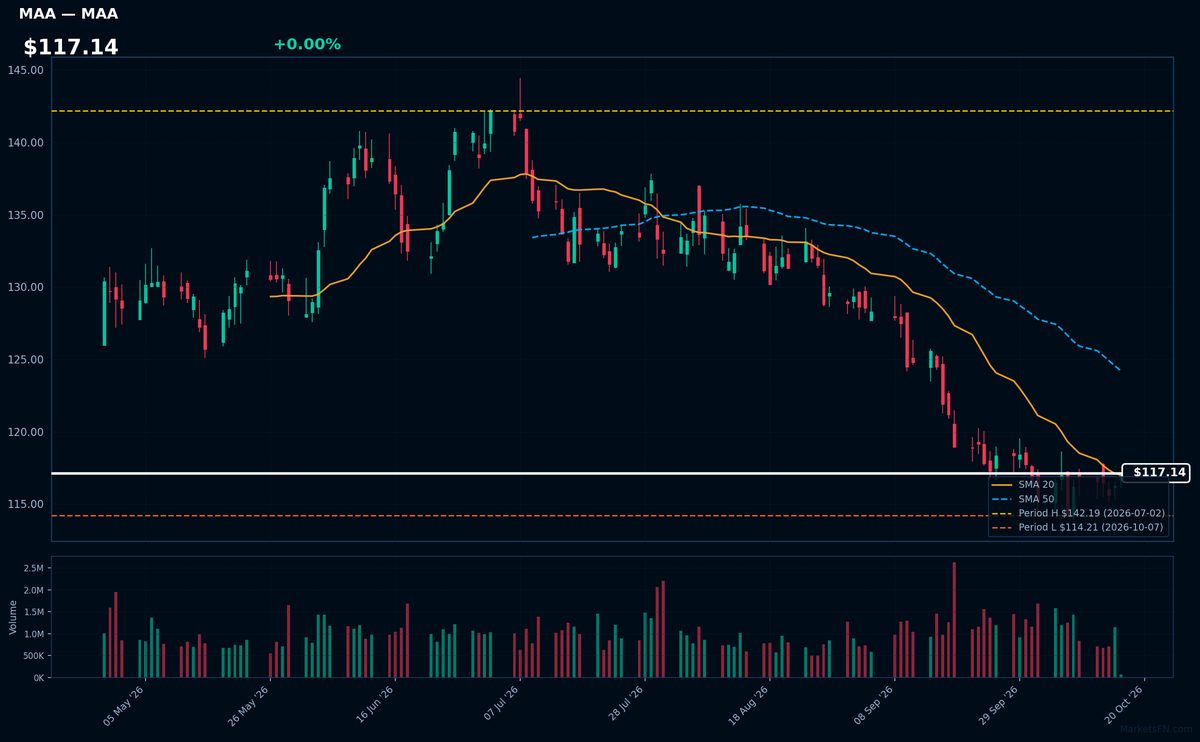
MAA | Mid-America Apartment Communities, Inc | Real Estate | Price Last: $117.14 | % Realized: -10.87% | RSI: 41.6 | % above MA200: -9.9% | Trend: Above MA20 · Below MA50, MA200
Mid-America Apartment Communities (MAA) owns and operates multifamily apartments across the Sunbelt region, benefiting from migration trends and job growth in Southern markets. Investors watch MAA for exposure to resilient rental demand and inflation-protected cash flows through lease turnover.
MAA trades at $117.14 with mixed signals: RSI(14) at 41.6 (neutral momentum), price above MA20 but below MA50/MA200, and just 2.6% above its 52-week low. The 10.9% annual decline tests support—caution warranted until MA alignment improves or RSI confirms strength.
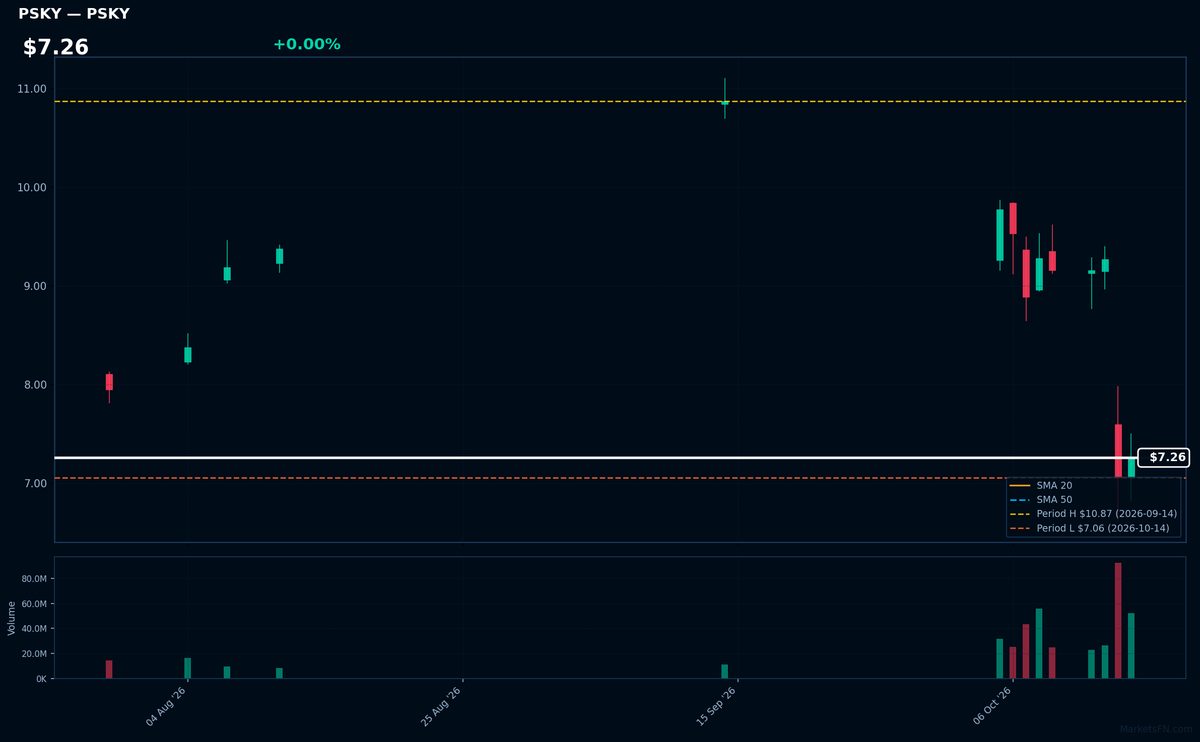
PSKY | Paramount Skydance Corp | Communication Services | Price Last: $7.26 | % Realized: -8.68% | RSI: nan | % above MA200: — | Trend: —
Paramount Skydance Corp operates in [specific industry not provided in data]. Investors should monitor its [specific catalyst not provided] given its current distressed valuation at $7.26, just 2.8% above 52-week lows, suggesting either deep value or fundamental deterioration.
Technically concerning: PSKY tests major support at -8.7% YoY. RSI(14) data unavailable and MA alignment inconclusive per incomplete data. Extreme proximity to 52-week low (2.8% above) signals potential breakdown risk.
Market Commentary
The concentration of blue-chip stocks like Apple (AAPL), Berkshire Hathaway (BRK-B), Visa (V), and Mastercard (MA) at 52-week highs signals persistent investor confidence in quality defensive names with strong cash flows and pricing power. Meanwhile, cyclical and interest-rate-sensitive sectors are lagging, as evidenced by Mosaic (MOS), MGM Resorts (MGM), and real estate play Mid-America Apartment Communities (MAA) hovering near 52-week lows. This divergence reflects a risk-averse market favoring secular growth over economically sensitive exposures.
Sector rotation trends highlight macro caution, with payments giants (V, MA) and healthcare (ABBV) benefiting from resilient consumer spending and defensive demand, while materials (MOS), gaming (MGM), and REITs (MAA) face pressure from softening commodity prices, discretionary spending concerns, and elevated rates. The underperformance of Paramount (PSKY) and TKO Group (TKO) further underscores content/media sector challenges amid streaming disruption and cord-cutting.
Key levels to monitor include the 52-week highs ($182.63 for AAPL, $416.90 for BRK-B) as potential resistance zones, while MOS ($22.10 52W low) and MGM ($32.47 52W low) could stabilize if macro sentiment improves. Catalysts include Fed policy shifts for rate-sensitive names, commodity price rebounds for MOS, and consumer spending data for discretionary plays like MGM and payment networks.
Methodology: All 503 S&P 500 constituents screened. 52-week high = highest daily close over the past 252 trading days (approx. 1 year). 52-week low = lowest daily close over the same period. Distance = (current price / extreme − 1) × 100. Technical indicators computed on up to 1 year of daily OHLCV data.
Disclaimer: For informational purposes only. Not investment advice. Past performance is not indicative of future results.