Nasdaq 100 2026 YTD Highs & Lows Radar: Gilead Sciences, (GILD), Paccar (PCAR) and more
MarketsFN Team

Screening all 101 Nasdaq 100 constituents for stocks nearest to their 2026 year-to-date high and their 2026 YTD low. Data as of October 16, 2026. % Realized = total return since Jan 1 2026.
Legend: RSI > 70 = overbought · RSI < 30 = oversold · Green % Realized = positive YTD return · Red = negative.
📈 Nearest to 2026 High
Sectors represented: Healthcare (2), Technology (2), Consumer Defensive (1)
| Ticker | Company | Sector | Price Last | % Realized | 2026 YTD High Date | RSI | % above MA200 | Trend |
|---|---|---|---|---|---|---|---|---|
| GILD | Gilead Sciences, Inc | Healthcare | $157.37 | +29.42% | 2026-10-15 | 64.5 | +14.0% | Above MA20, MA50, MA200 |
| TEAM | Atlassian Corporation | Technology | $217.12 | +40.29% | 2026-10-15 | 66.3 | +89.7% | Above MA20, MA50, MA200 |
| KDP | Keurig Dr Pepper Inc | Consumer Defensive | $34.18 | +23.26% | 2026-10-15 | 69.5 | +15.4% | Above MA20, MA50, MA200 |
| CDW | CDW Corp | Technology | $154.33 | +15.90% | 2026-10-15 | 64.4 | +17.1% | Above MA20, MA50, MA200 |
| BIIB | Biogen Inc | Healthcare | $235.35 | +32.35% | 2026-10-15 | 64.1 | +19.0% | Above MA20, MA50, MA200 |
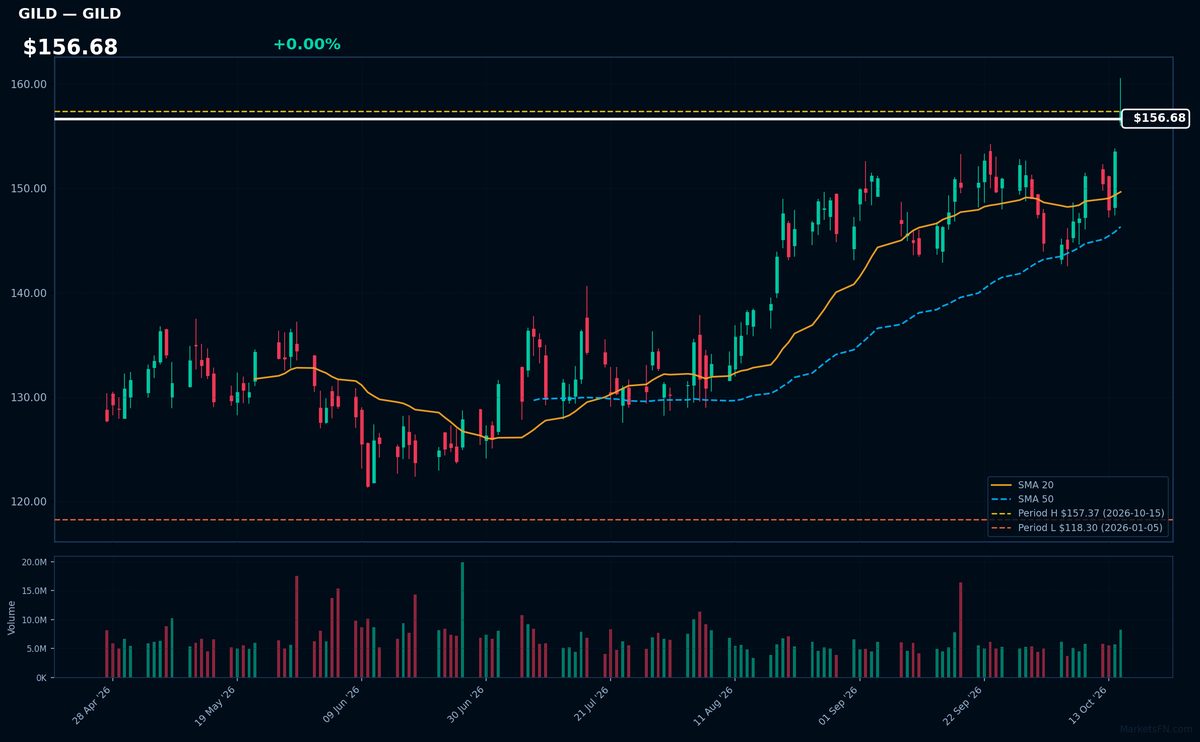
GILD | Gilead Sciences, Inc | Healthcare | Price Last: $157.37 | % Realized: +29.42% | RSI: 64.5 | % above MA200: +14.0% | Trend: Above MA20, MA50, MA200
Gilead Sciences develops antiviral drugs including HIV treatments and COVID-19 therapies like remdesivir. Investors watch its infectious disease pipeline and pricing power in specialty pharmaceuticals.
Technically bullish with RSI(14) at 64.5 and price > MA20 > MA50 > MA200. Up 29.4% YTD, testing 2026 highs — momentum confirms the uptrend.
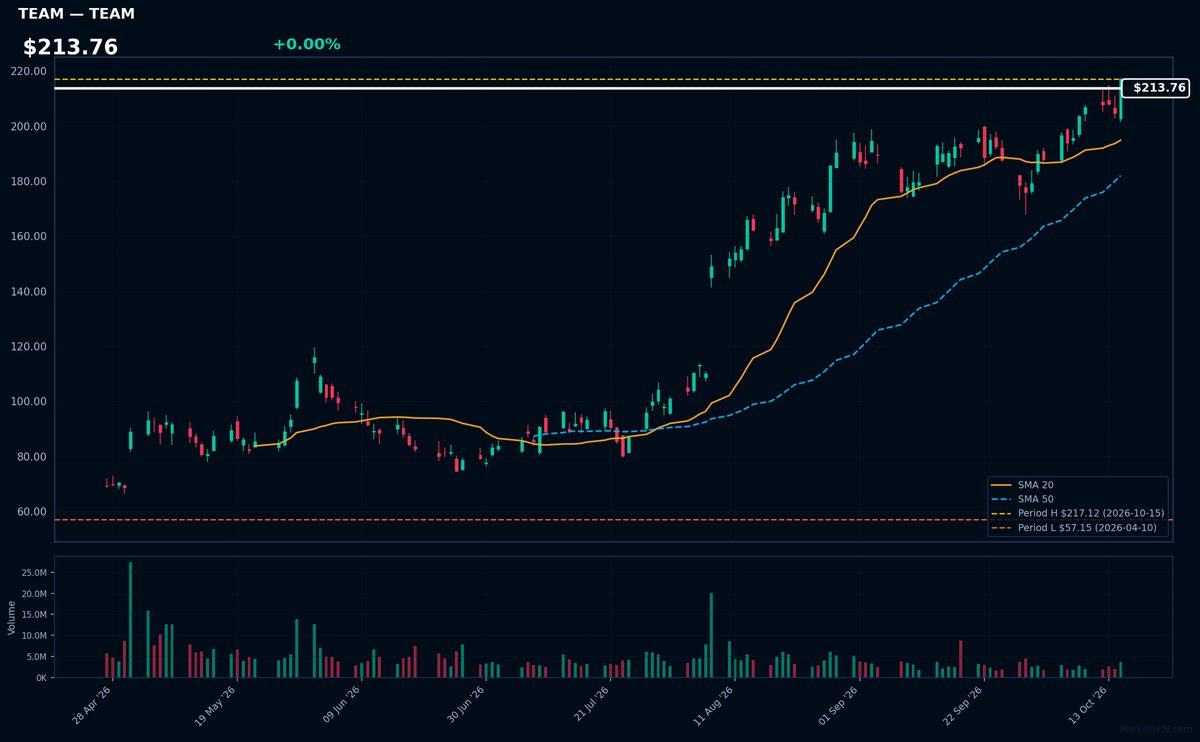
TEAM | Atlassian Corporation | Technology | Price Last: $217.12 | % Realized: +40.29% | RSI: 66.3 | % above MA200: +89.7% | Trend: Above MA20, MA50, MA200
Atlassian provides collaboration software (Jira, Confluence) for agile development teams. Investors care because its tools are mission-critical for developers, driving sticky subscriptions. The shift to remote work accelerated adoption, making it a cloud productivity staple.
TEAM shows bullish momentum with RSI(14) at 66.3 and price > MA20 > MA50 > MA200. The stock is flat versus its 2026 YTD high after a 40.3% rally, suggesting consolidation near breakout levels. Watch RSI for overbought signals.
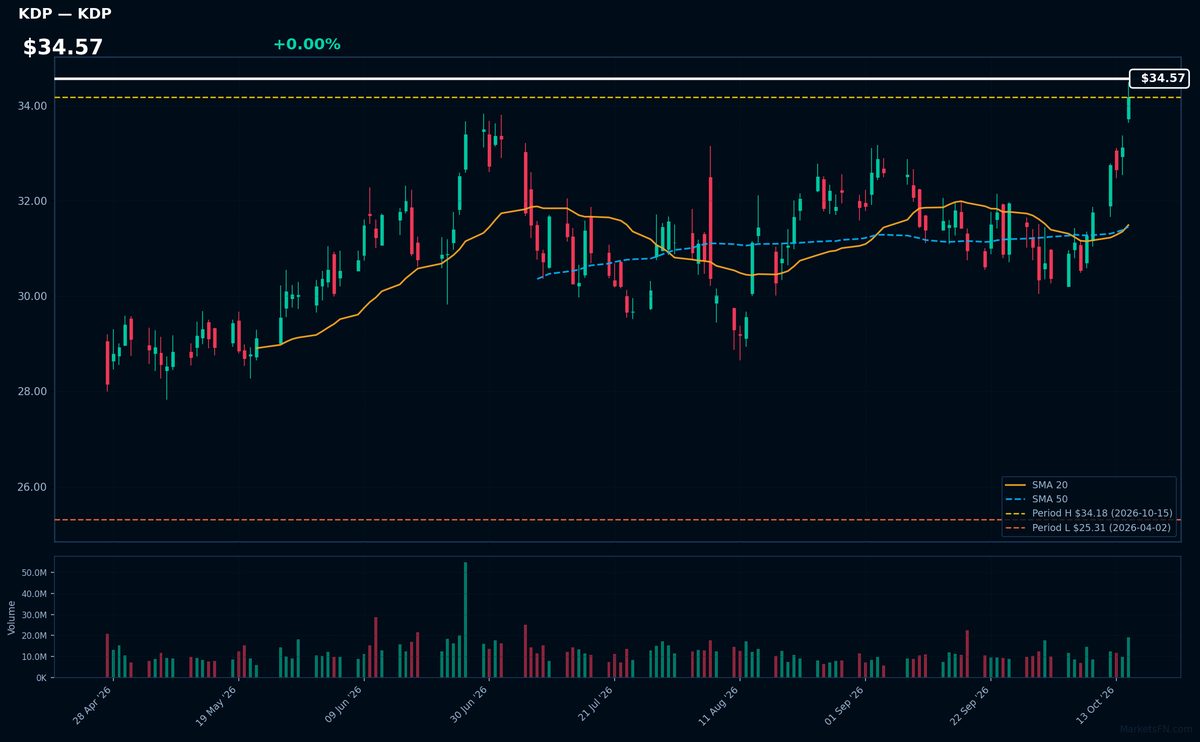
KDP | Keurig Dr Pepper Inc | Consumer Defensive | Price Last: $34.18 | % Realized: +23.26% | RSI: 69.5 | % above MA200: +15.4% | Trend: Above MA20, MA50, MA200
Keurig Dr Pepper Inc operates in beverages, manufacturing single-serve coffee systems (Keurig) and distributing branded soft drinks (Dr Pepper). Investors care for its dual exposure to at-home coffee consumption and stable CSD category, with pricing power in both segments.
KDP shows bullish momentum (RSI 69.5, price > MA20 > MA50 > MA200) after a 23.3% YTD rally. The extreme proximity to YTD highs suggests breakout potential, though RSI nears overbought territory.
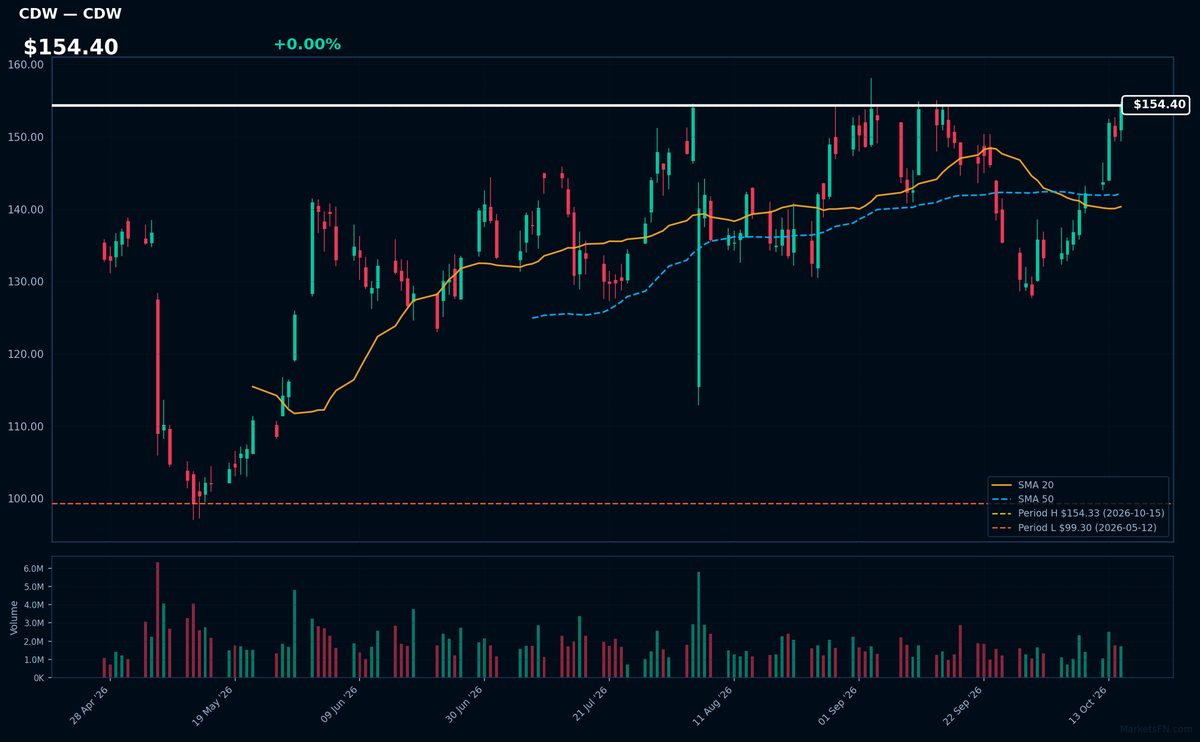
CDW | CDW Corp | Technology | Price Last: $154.33 | % Realized: +15.90% | RSI: 64.4 | % above MA200: +17.1% | Trend: Above MA20, MA50, MA200
CDW distributes IT hardware/software solutions to businesses, governments, and education. Investors care because its value-added reseller model thrives in hybrid work environments, with recurring revenue from configuration services and enterprise contracts that provide stability amid tech spending cycles.
CDW trades at $154.40 (0.0% below YTD high) with RSI(14) at 64.4 (approaching overbought) above mixed MAs. The 15.9% YTD gain suggests momentum, but proximity to resistance warrants caution.
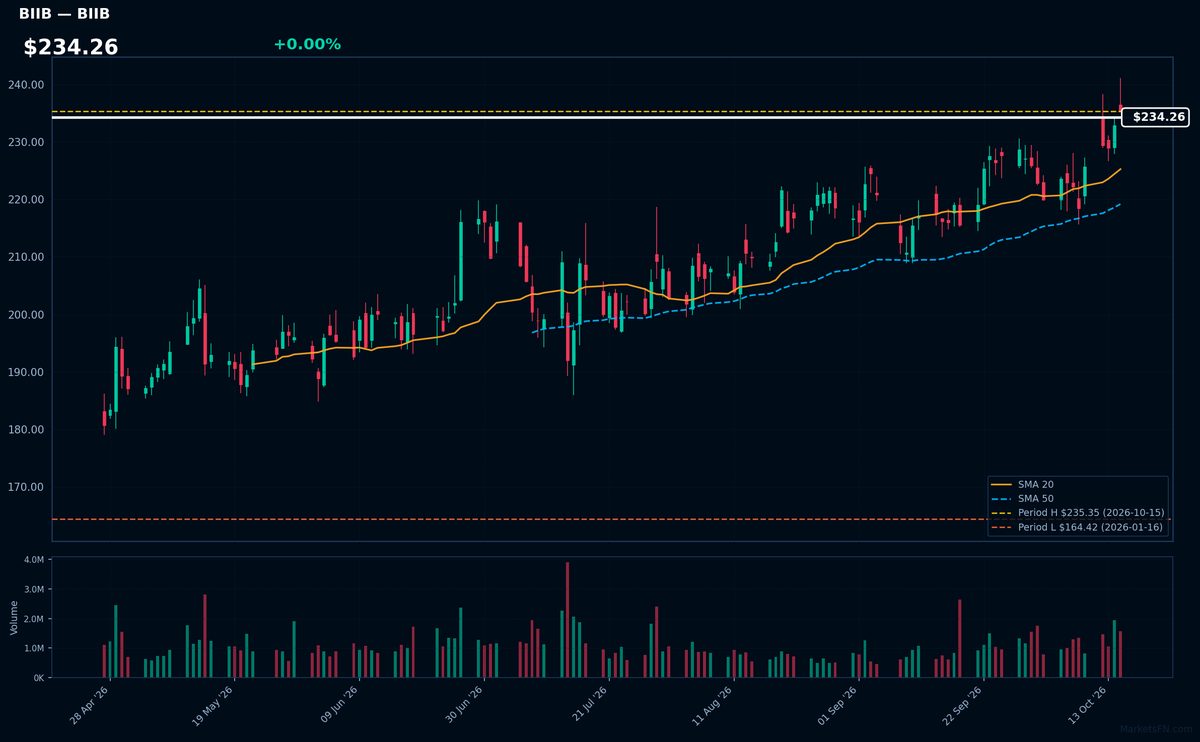
BIIB | Biogen Inc | Healthcare | Price Last: $235.35 | % Realized: +32.35% | RSI: 64.1 | % above MA200: +19.0% | Trend: Above MA20, MA50, MA200
Biogen Inc specializes in neuroscience therapies, including treatments for multiple sclerosis and Alzheimer's disease. Investors watch its pipeline of neurological drugs, which drive revenue in a high-margin specialty pharma market with significant unmet needs.
Biogen shows bullish momentum with RSI(14) at 64.1 and a sustained uptrend (price > MA20 > MA50 > MA200). The stock is 0.0% below its 2026 YTD high after gaining 32.4% YTD, suggesting potential breakout conditions but nearing overbought territory.
📉 Nearest to 2026 Low
Sectors represented: Industrials (3), Consumer Defensive (1), Communication Services (1)
| Ticker | Company | Sector | Price Last | % Realized | 2026 YTD Low Date | RSI | % above MA200 | Trend |
|---|---|---|---|---|---|---|---|---|
| PCAR | Paccar Inc | Industrials | $110.81 | -0.67% | 2026-10-07 | 47.5 | -8.1% | Above MA20 · Below MA50, MA200 |
| PEP | PepsiCo Inc | Consumer Defensive | $128.38 | -9.74% | 2026-10-07 | 50.9 | -12.2% | Above MA20 · Below MA50, MA200 |
| HON | Honeywell International Inc | Industrials | $210.50 | +2.47% | 2026-09-14 | 53.6 | -8.7% | Below MA20, MA50, MA200 |
| CMCSA | Comcast Corp | Communication Services | $21.77 | -21.37% | 2026-10-09 | 48.0 | -17.4% | Above MA20 · Below MA50, MA200 |
| CPRT | Copart, Inc | Industrials | $27.75 | -26.53% | 2026-10-14 | 49.4 | -15.6% | Above MA20 · Below MA50, MA200 |
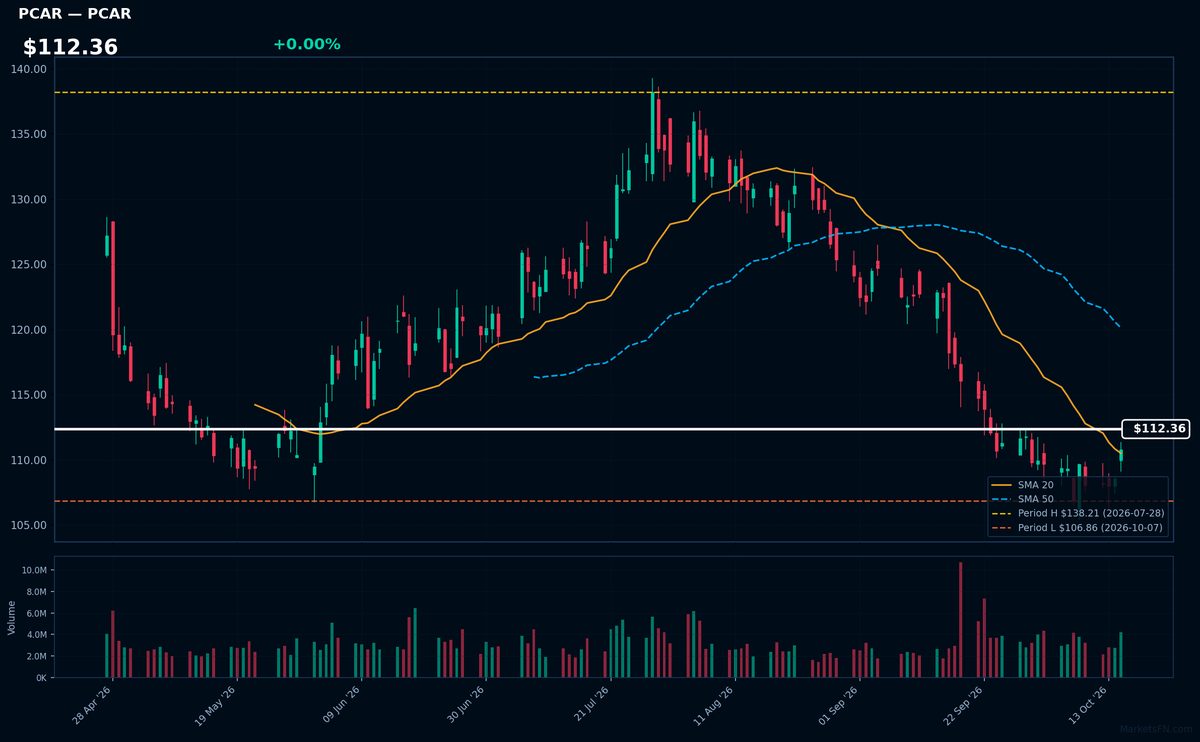
PCAR | Paccar Inc | Industrials | Price Last: $110.81 | % Realized: -0.67% | RSI: 47.5 | % above MA200: -8.1% | Trend: Above MA20 · Below MA50, MA200
Paccar manufactures premium Kenworth, Peterbilt, and DAF trucks, dominating North American Class 8 market share. Investors watch PCAR as a cyclical bellwether with industry-leading margins (9.5% net) and $4.8B liquidity to navigate freight downturns.
Technically mixed at $112.36: RSI 47.5 neutral but testing key support 3.7% above YTD lows. Below MA50/200 signals caution despite holding MA20.
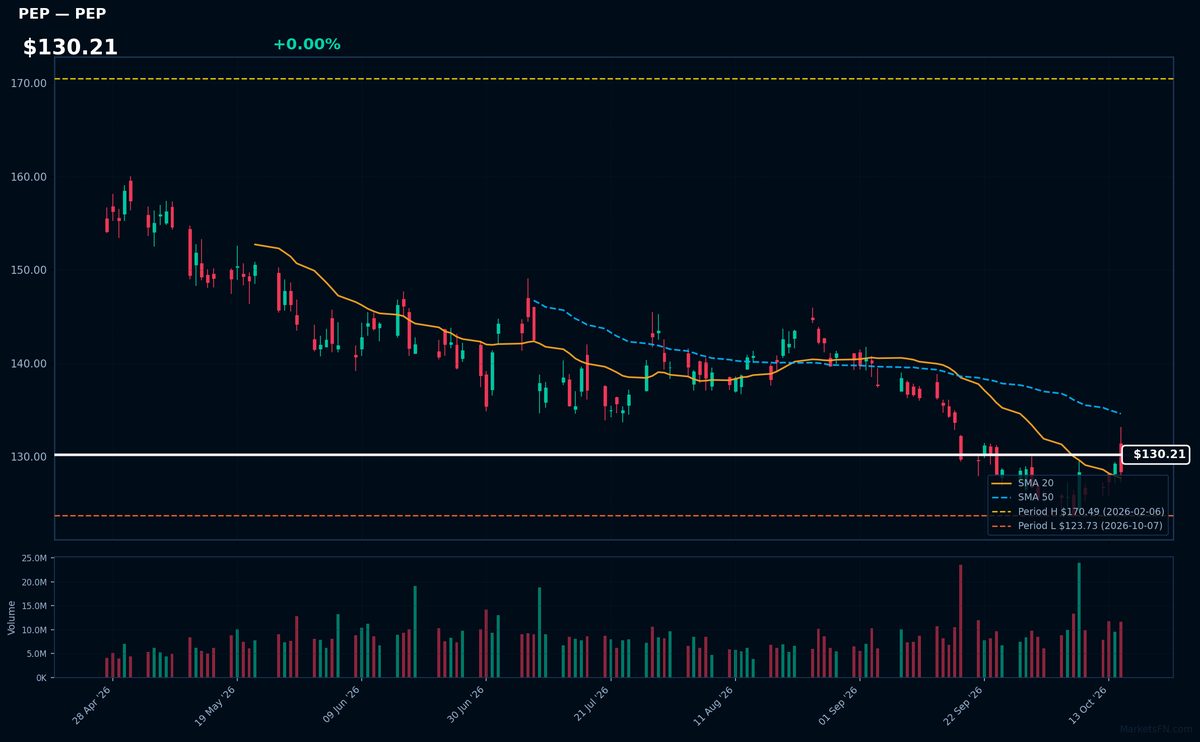
PEP | PepsiCo Inc | Consumer Defensive | Price Last: $128.38 | % Realized: -9.74% | RSI: 50.9 | % above MA200: -12.2% | Trend: Above MA20 · Below MA50, MA200
PepsiCo Inc operates a global food and beverage portfolio including Pepsi, Frito-Lay, Quaker, and Gatorade. Investors care due to its defensive staples exposure, consistent cash flows, and 3.8% dividend yield (2026 YTD data) — though recent -9.7% YTD underperformance raises questions on growth.
Technically mixed at $130.21 — RSI(14) 50.9 shows neutral momentum while price sits 3.8% above 2026 lows, below MA50/MA200 but above MA20. Critical support test underway after -9.7% YTD drop; breach of YTD low could accelerate selling.
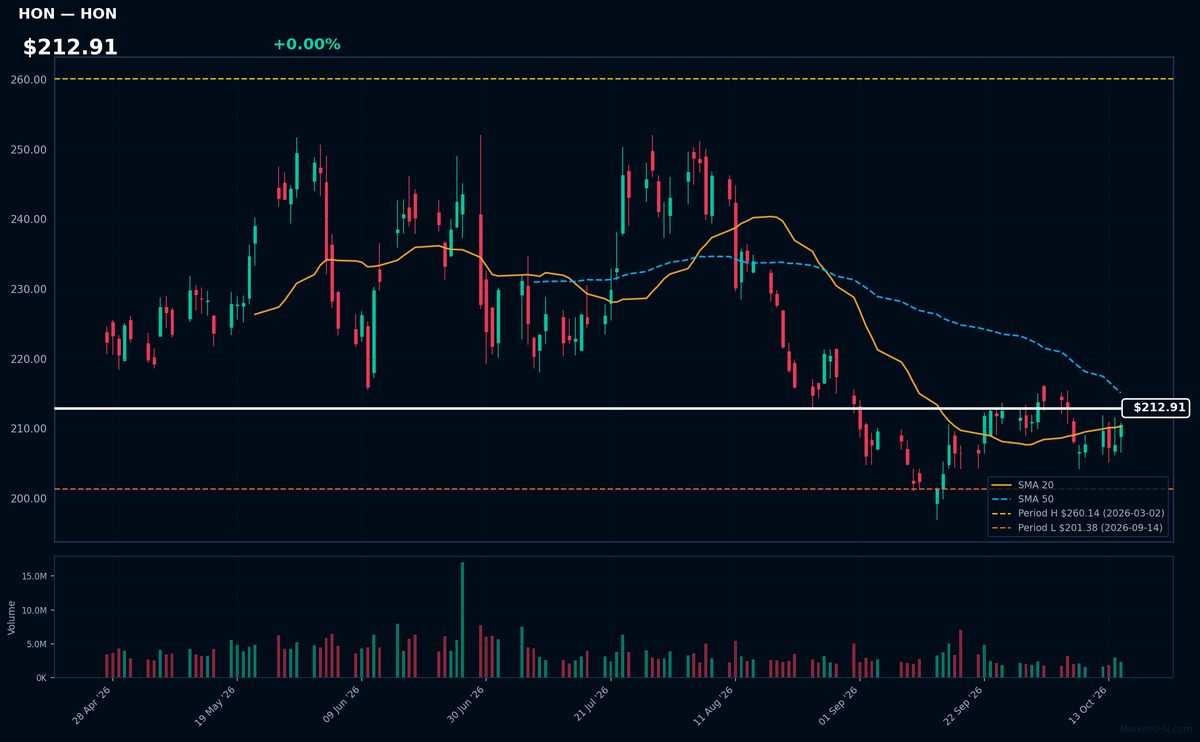
HON | Honeywell International Inc | Industrials | Price Last: $210.50 | % Realized: +2.47% | RSI: 53.6 | % above MA200: -8.7% | Trend: Below MA20, MA50, MA200
Honeywell International Inc operates in aerospace, building technologies, and performance materials, providing critical industrial solutions like aircraft components, automation controls, and advanced materials. Investors care due to its diversified industrial exposure and consistent cash flows from long-cycle businesses.
HON shows mixed technical signals at $212.91 - RSI(14) at 53.6 (neutral) with price above MA20 but below MA50/MA200. Trading just 4.5% above YTD lows suggests vulnerability despite the 2.5% YTD gain. Current setup warns of weakening momentum near key support.
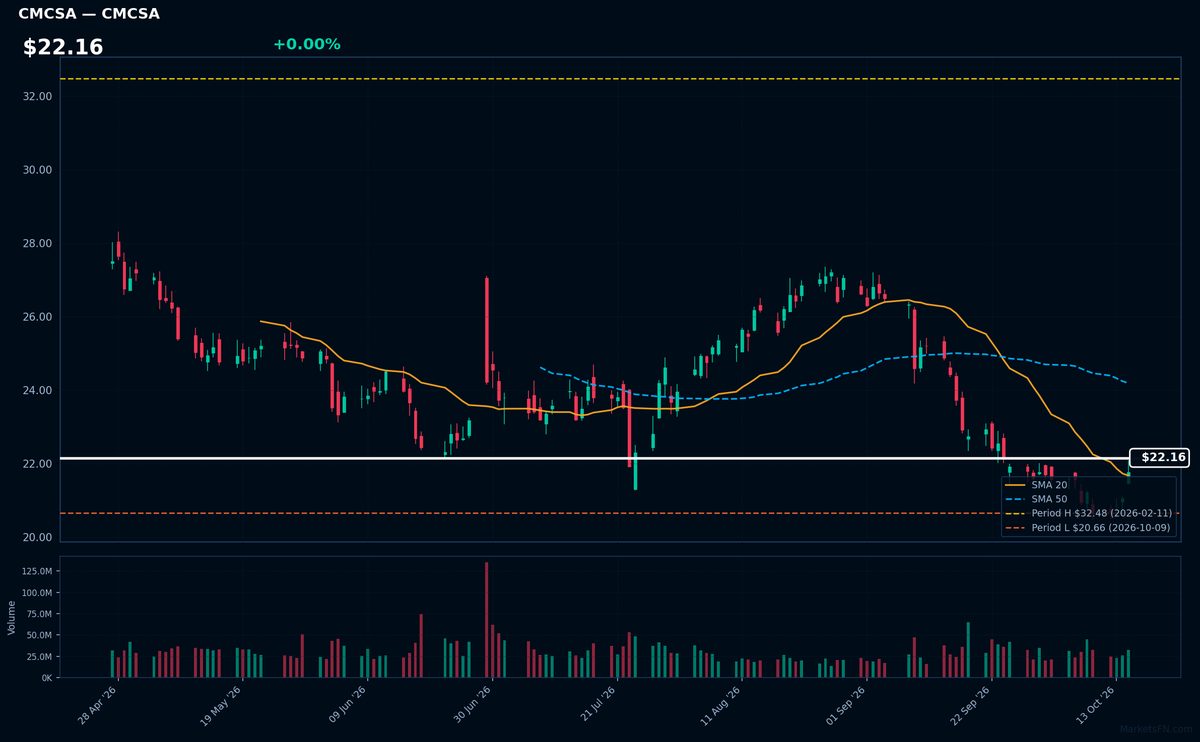
CMCSA | Comcast Corp | Communication Services | Price Last: $21.77 | % Realized: -21.37% | RSI: 48.0 | % above MA200: -17.4% | Trend: Above MA20 · Below MA50, MA200
Comcast Corp operates as a media and technology conglomerate, providing broadband, video, wireless, and streaming services. Investors care due to its infrastructure dominance in U.S. connectivity and NBCUniversal's content assets, though cord-cutting pressures persist.
Technically concerning: RSI(14) at 48.0 shows neutral momentum, while mixed MA alignment (above MA20 but below MA50/MA200) and a -21.4% YTD decline suggest weakness. The 5.4% buffer above YTD lows flags critical support testing.
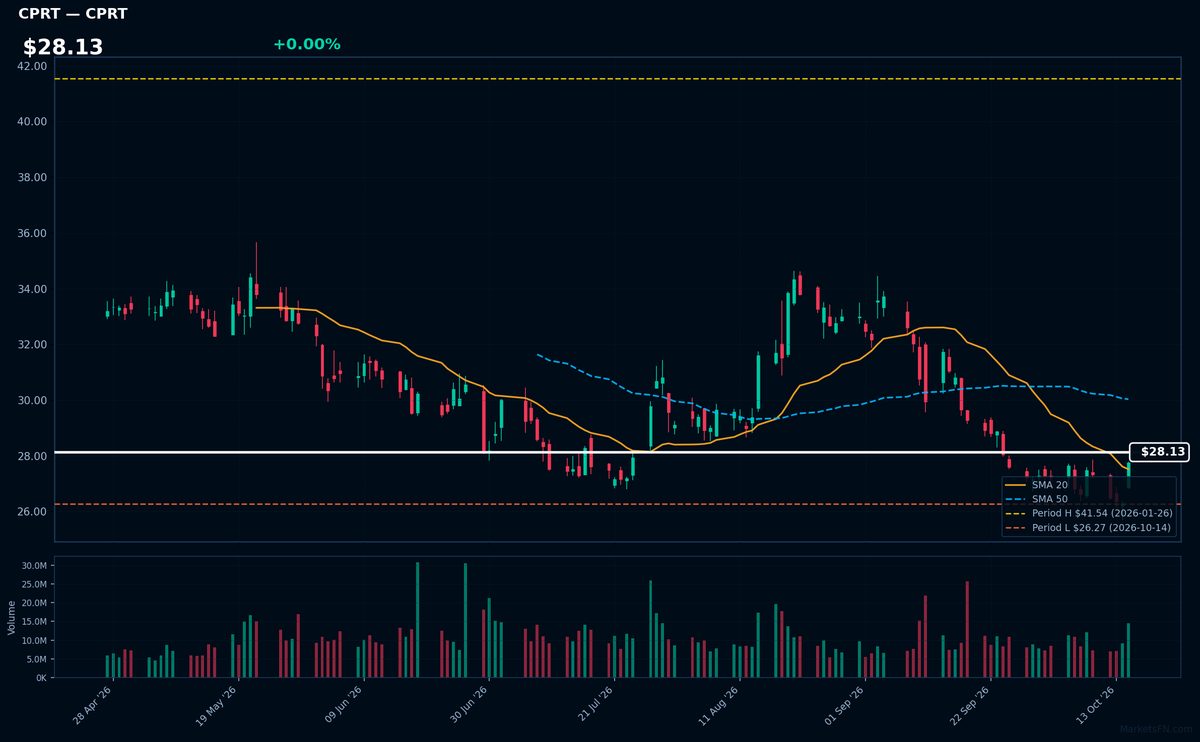
CPRT | Copart, Inc | Industrials | Price Last: $27.75 | % Realized: -26.53% | RSI: 49.4 | % above MA200: -15.6% | Trend: Above MA20 · Below MA50, MA200
Copart operates an online vehicle auction platform, specializing in salvage and insurance-totaled cars. Investors care because its asset-light model dominates a fragmented $10B+ market with high barriers to entry.
CPRT trades at $28.13 with mixed signals: RSI(14) at 49.4 neutral, but -26.5% YTD and just 5.6% above 2026 lows suggests weakening momentum below key MAs.
Market Commentary
The Nasdaq 100 stocks at 2026 highs—GILD, TEAM, KDP, CDW, and BIIB—reflect strong investor confidence in their near-term performance, with all trading at exactly 0.0% below their YTD peaks. Conversely, PCAR, PEP, HON, CMCSA, and CPRT hovering just 3.7% to 5.6% above their 2026 lows suggest persistent underperformance or sector-specific headwinds. These extremes highlight divergences within the index, where select names thrive while others struggle to regain momentum.
Biotech (GILD, BIIB) and enterprise software (TEAM, CDW) leadership signals continued demand for innovation and digital transformation, while defensive sectors like beverages (KDP) show resilience. The laggards—industrial (PCAR, HON), media (CMCSA), and auto-related (CPRT)—face cyclical pressures or slower growth. Macro conditions, including interest rate uncertainty and uneven economic growth, may be amplifying these trends, rewarding high-growth tech while punishing more economically sensitive names.
Investors should monitor earnings revisions and guidance from the high-flyers for sustainability, while watching for mean reversion opportunities in oversold names if macro sentiment improves. Sector rotation risks loom if rate expectations shift, particularly for tech’s premium valuations. Traders may focus on breakout/breakdown confirmation near these extremes, with volume and relative strength as key signals.
Methodology: All 101 Nasdaq 100 constituents screened. Close prices downloaded from 2026-01-01. Period high = highest close since Jan 1 2026; period low = lowest close since Jan 1 2026. Distance = (current price / period extreme − 1) × 100. Technical indicators computed on up to 1 year of daily OHLCV data.
Disclaimer: For informational purposes only. Not investment advice. Past performance is not indicative of future results.