S&P 500 2026 YTD Highs & Lows Radar: Visa (V), Prologis (PLD) and more
MarketsFN Team

Screening all 503 S&P 500 constituents for stocks nearest to their 2026 year-to-date high and their 2026 YTD low. Data as of October 16, 2026. % Realized = total return since Jan 1 2026.
Legend: RSI > 70 = overbought · RSI < 30 = oversold · Green % Realized = positive YTD return · Red = negative.
📈 Nearest to 2026 High
Sectors represented: Financial (2), Healthcare (2), Consumer Defensive (1)
| Ticker | Company | Sector | Price Last | % Realized | 2026 YTD High Date | RSI | % above MA200 | Trend |
|---|---|---|---|---|---|---|---|---|
| V | Visa Inc | Financial | $399.75 | +15.37% | 2026-10-15 | 74.5 | +17.9% | Above MA20, MA50, MA200 |
| MA | Mastercard Incorporated | Financial | $616.32 | +9.45% | 2026-10-15 | 76.5 | +15.6% | Above MA20, MA50, MA200 |
| KO | Coca-Cola Co | Consumer Defensive | $92.00 | +33.10% | 2026-10-15 | 73.5 | +13.6% | Above MA20, MA50, MA200 |
| TMO | Thermo Fisher Scientific Inc | Healthcare | $696.49 | +17.55% | 2026-10-15 | 67.7 | +27.2% | Above MA20, MA50, MA200 |
| PFE | Pfizer Inc | Healthcare | $29.44 | +16.92% | 2026-10-15 | 70.6 | +10.8% | Above MA20, MA50, MA200 |
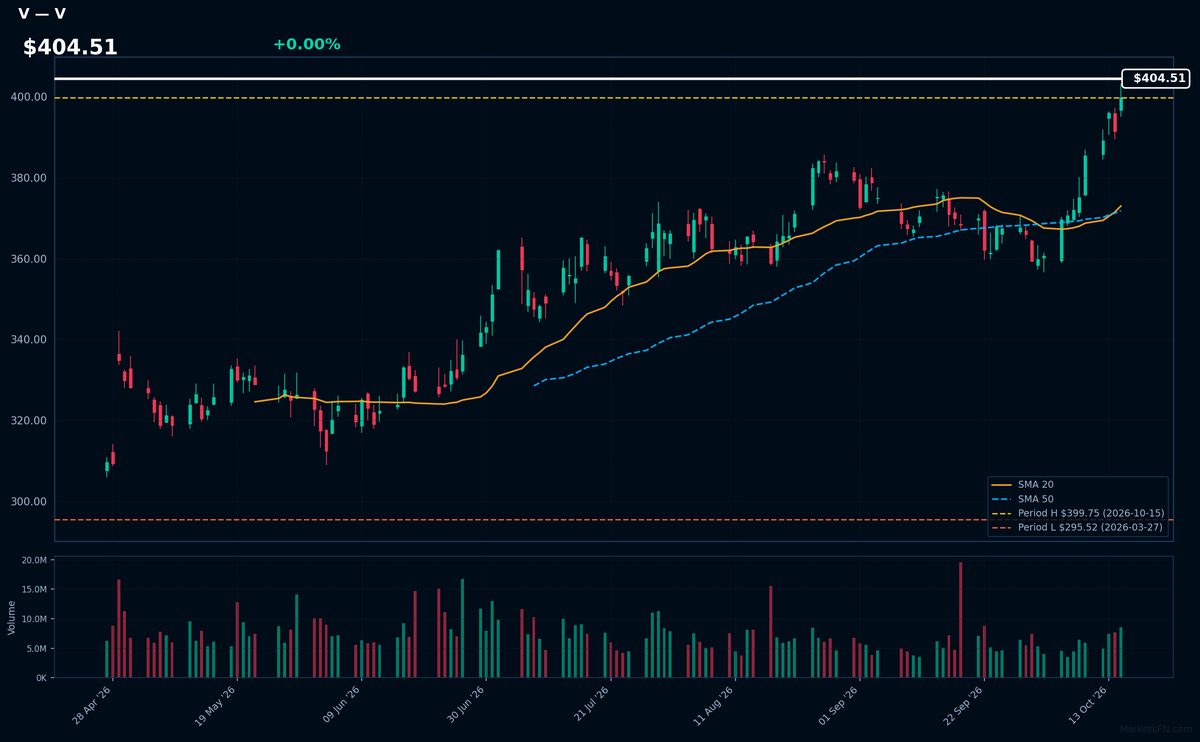
V | Visa Inc | Financial | Price Last: $399.75 | % Realized: +15.37% | RSI: 74.5 | % above MA200: +17.9% | Trend: Above MA20, MA50, MA200
Visa operates the world's largest payment network, processing over $14 trillion annually. Investors care because it's a toll bridge on global commerce with 60%+ operating margins, benefiting from cash-to-card conversion and cross-border transactions without credit risk.
Technically bullish with RSI(14) at 74.5 (overbought) and price > MA20 > MA50 > MA200. The 15.4% YTD gain shows momentum, but extreme proximity to YTD highs suggests potential breakout or pullback.
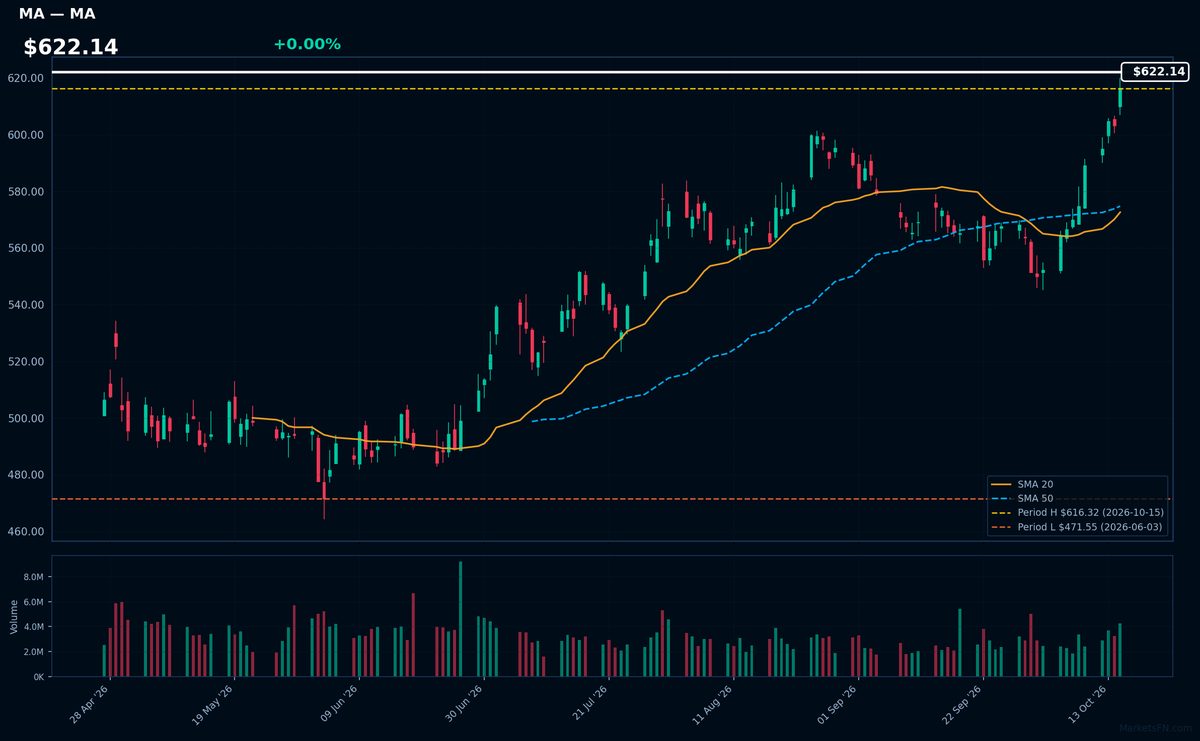
MA | Mastercard Incorporated | Financial | Price Last: $616.32 | % Realized: +9.45% | RSI: 76.5 | % above MA200: +15.6% | Trend: Above MA20, MA50, MA200
Mastercard operates a global payment network processing $9.9 trillion in annual transactions. Investors care because its asset-light model generates 58% operating margins as digital payments grow 12% annually worldwide, making it a pure-play on cash displacement.
At RSI 76.5 and 0.0% below YTD highs, MA shows overbought momentum above all key MAs (20/50/200). The 9.4% YTD gain suggests continuation potential but warrants caution given extreme readings.
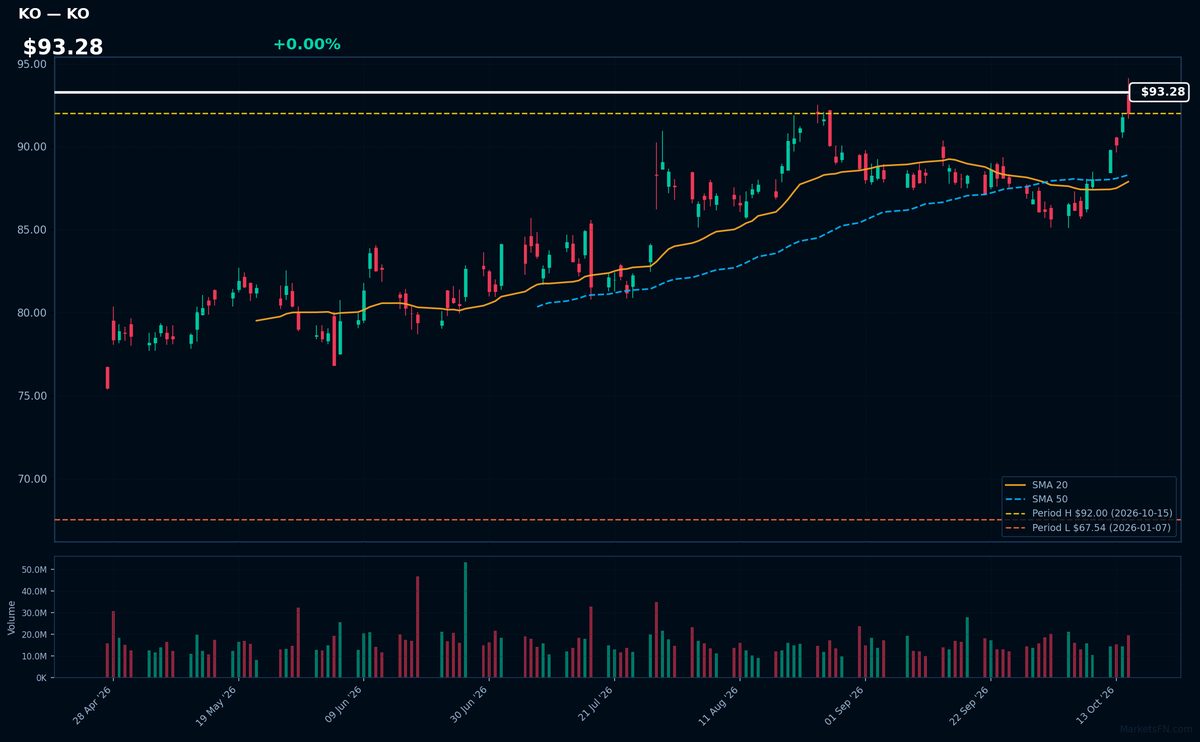
KO | Coca-Cola Co | Consumer Defensive | Price Last: $92.00 | % Realized: +33.10% | RSI: 73.5 | % above MA200: +13.6% | Trend: Above MA20, MA50, MA200
Coca-Cola Co owns the world's most valuable beverage portfolio (including Coke, Sprite, and 200+ brands) with unmatched global distribution. Investors care because its asset-light model generates consistent cash flow even in downturns, with pricing power across 200+ countries.
KO trades at $93.28 (0.0% below 2026 high) with RSI(14) at 73.5 (overbought) and mixed MA alignment (above MA20/50/200). The 33.1% YTD surge suggests momentum, but extreme RSI warrants caution near all-time highs.
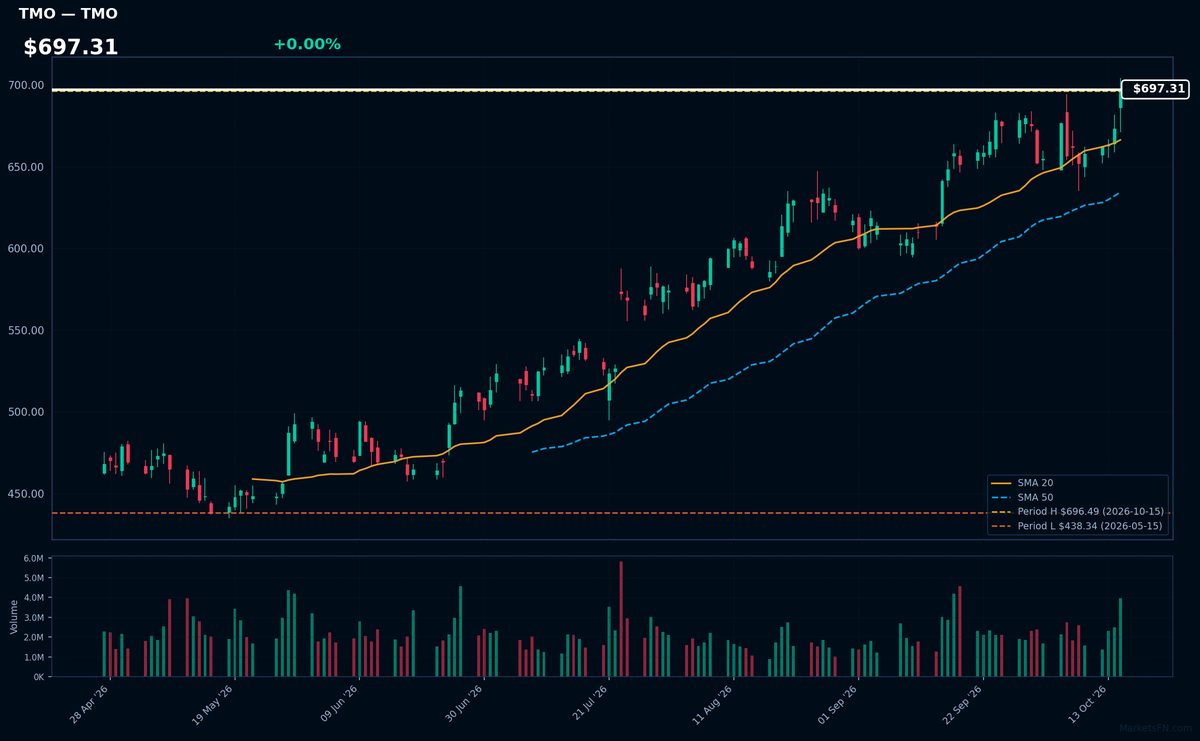
TMO | Thermo Fisher Scientific Inc | Healthcare | Price Last: $696.49 | % Realized: +17.55% | RSI: 67.7 | % above MA200: +27.2% | Trend: Above MA20, MA50, MA200
Thermo Fisher Scientific provides analytical instruments, lab equipment, software, and consumables for life sciences, diagnostics, and applied markets. Investors should care because its essential tools enable biopharma R&D and precision medicine—high-growth sectors with recurring revenue streams.
Technically bullish with RSI(14) at 67.7 and price ($697.31) above all key MAs (20/50/200). The 17.5% YTD gain shows strong momentum, though RSI nears overbought. Testing YTD highs suggests potential breakout if buying pressure sustains.
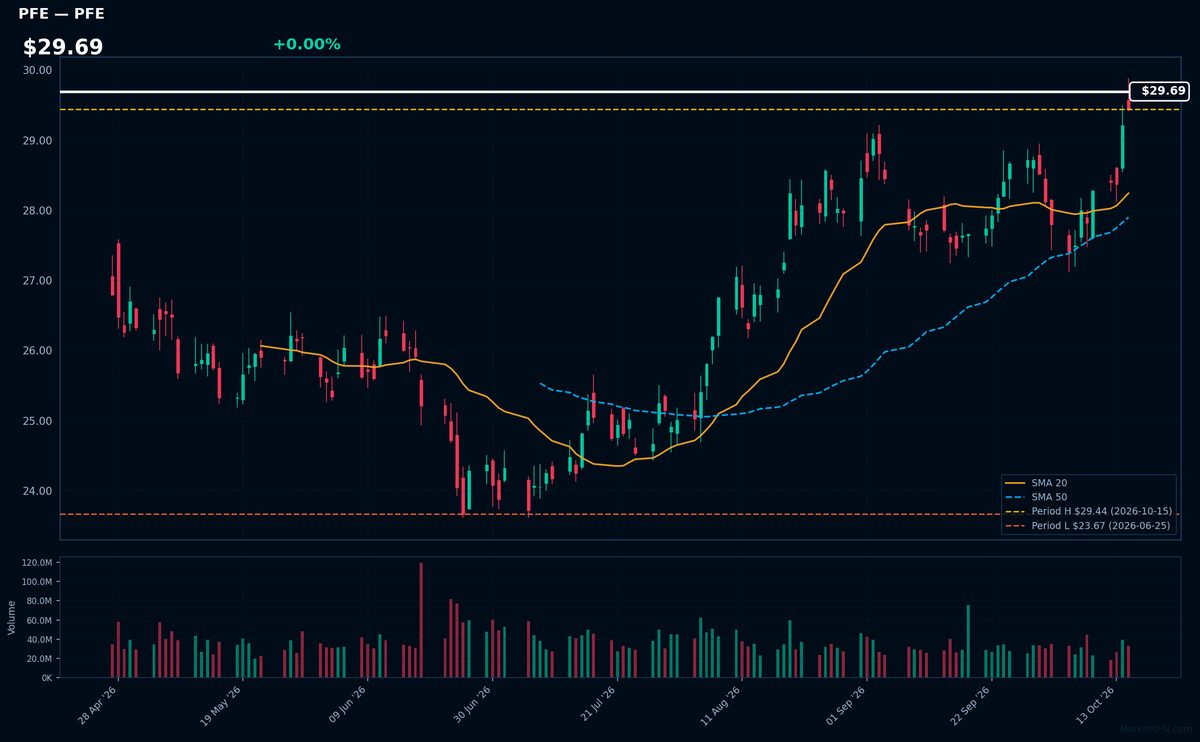
PFE | Pfizer Inc | Healthcare | Price Last: $29.44 | % Realized: +16.92% | RSI: 70.6 | % above MA200: +10.8% | Trend: Above MA20, MA50, MA200
Pfizer develops and commercializes vaccines (including COVID-19 shots), oncology drugs (like Ibrance), and immunology treatments. Investors watch its pipeline for blockbuster drug approvals and patent cliffs on key revenue drivers.
Technically bullish with RSI(14) at 70.6 (overbought) and sustained uptrend (price > MA20 > MA50 > MA200). Testing YTD highs after 16.9% 2026 YTD gain — momentum play with overheating risk.
📉 Nearest to 2026 Low
Sectors represented: Real Estate (2), Basic Materials (2), Consumer Cyclical (1)
| Ticker | Company | Sector | Price Last | % Realized | 2026 YTD Low Date | RSI | % above MA200 | Trend |
|---|---|---|---|---|---|---|---|---|
| PLD | Prologis Inc | Real Estate | $126.94 | -1.64% | 2026-01-26 | 38.7 | -8.0% | Below MA20, MA50, MA200 |
| ALB | Albemarle Corp | Basic Materials | $98.18 | -31.79% | 2026-10-13 | 28.6 | -35.9% | Below MA20, MA50, MA200 |
| MOS | Mosaic Company | Basic Materials | $18.95 | -24.26% | 2026-10-09 | 27.1 | -21.9% | Below MA20, MA50, MA200 |
| MGM | MGM Resorts International | Consumer Cyclical | $29.48 | -19.21% | 2026-10-14 | 20.1 | -25.1% | Below MA20, MA50, MA200 |
| MAA | Mid-America Apartment Communities, Inc | Real Estate | $116.27 | -16.43% | 2026-10-07 | 37.1 | -10.6% | Below MA20, MA50, MA200 |
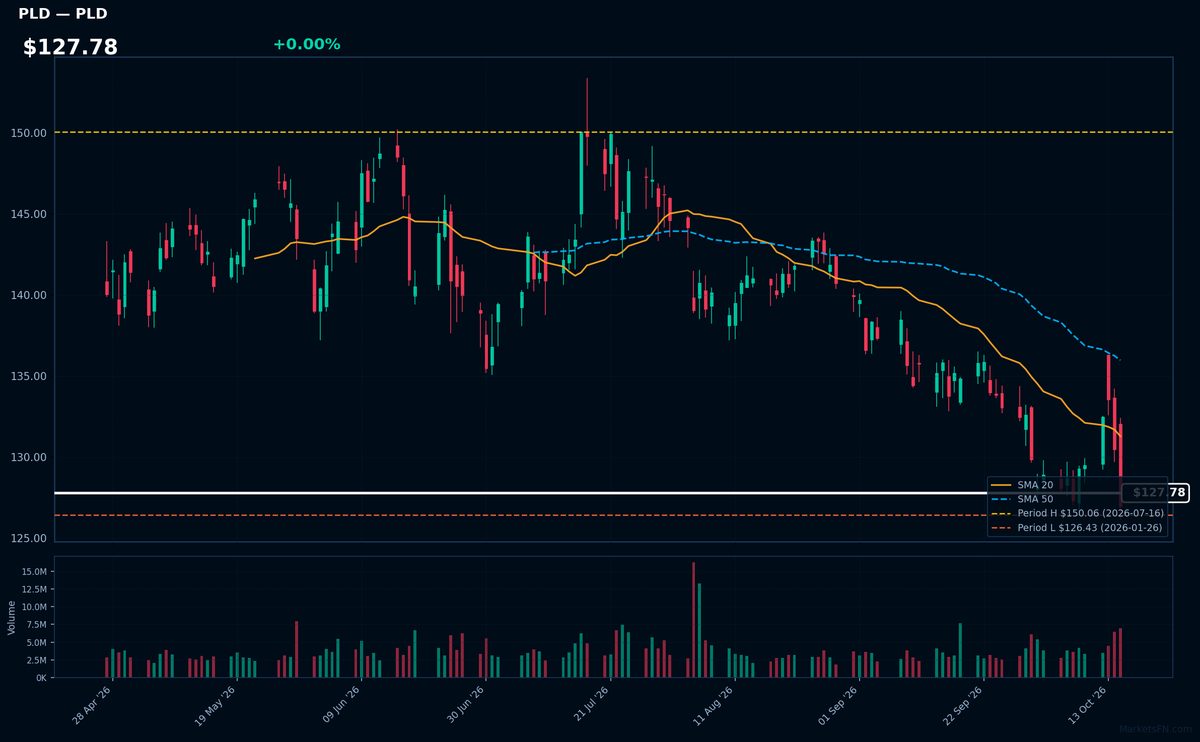
PLD | Prologis Inc | Real Estate | Price Last: $126.94 | % Realized: -1.64% | RSI: 38.7 | % above MA200: -8.0% | Trend: Below MA20, MA50, MA200
Prologis Inc operates as a global leader in logistics real estate, owning and managing high-demand industrial warehouses crucial for e-commerce and supply chains. Investors watch PLD as a bellwether for global trade activity and industrial property valuations.
PLD shows bearish momentum with RSI(14) at 38.7 and sustained downtrend (price $127.78 below MA20/50/200). Testing critical support just 0.4% above YTD lows, the -1.6% YTD return signals weakening demand. Technicals suggest caution, not fundamental strength.
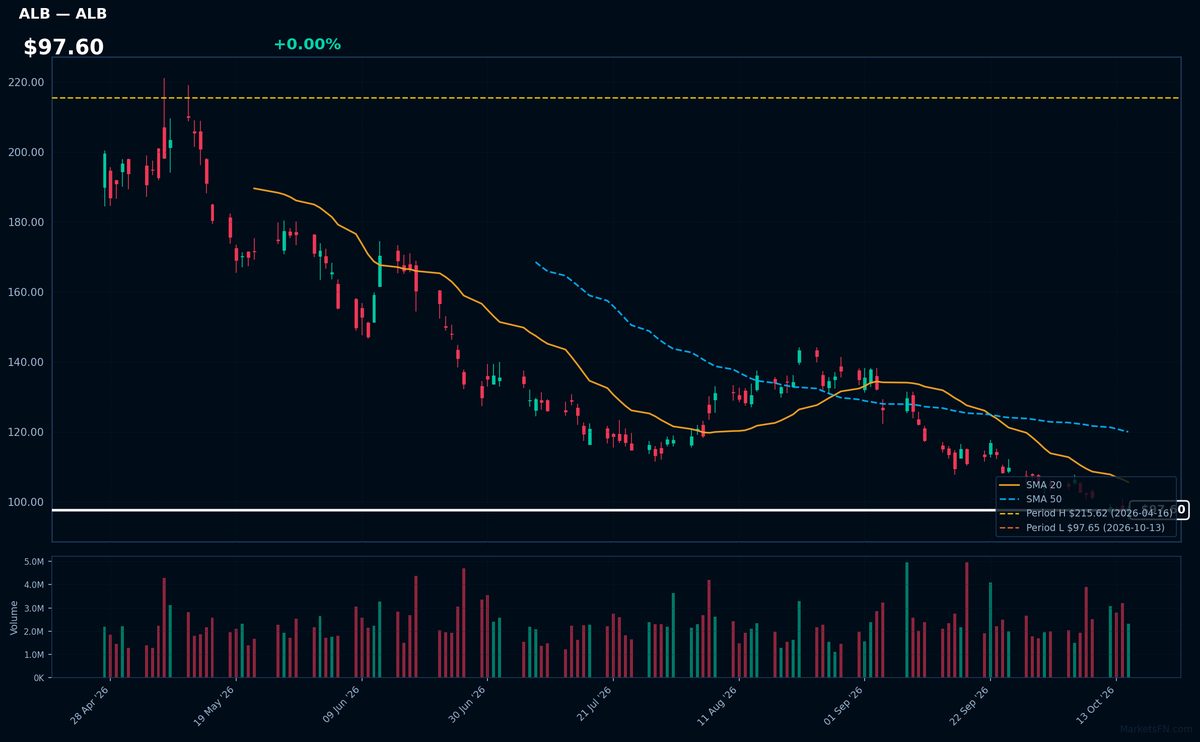
ALB | Albemarle Corp | Basic Materials | Price Last: $98.18 | % Realized: -31.79% | RSI: 28.6 | % above MA200: -35.9% | Trend: Below MA20, MA50, MA200
Albemarle Corp is a global leader in lithium production, essential for electric vehicle batteries. Investors monitor ALB as a critical player in the energy transition, with pricing power tied to lithium demand cycles and EV adoption rates.
ALB shows extreme technical weakness: RSI(14) at 28.6 (oversold) with bearish MA alignment (price < MA20 < MA50 < MA200). Trading just 0.5% above YTD lows after a -31.8% 2026 decline, this signals capitulation near multi-year support.
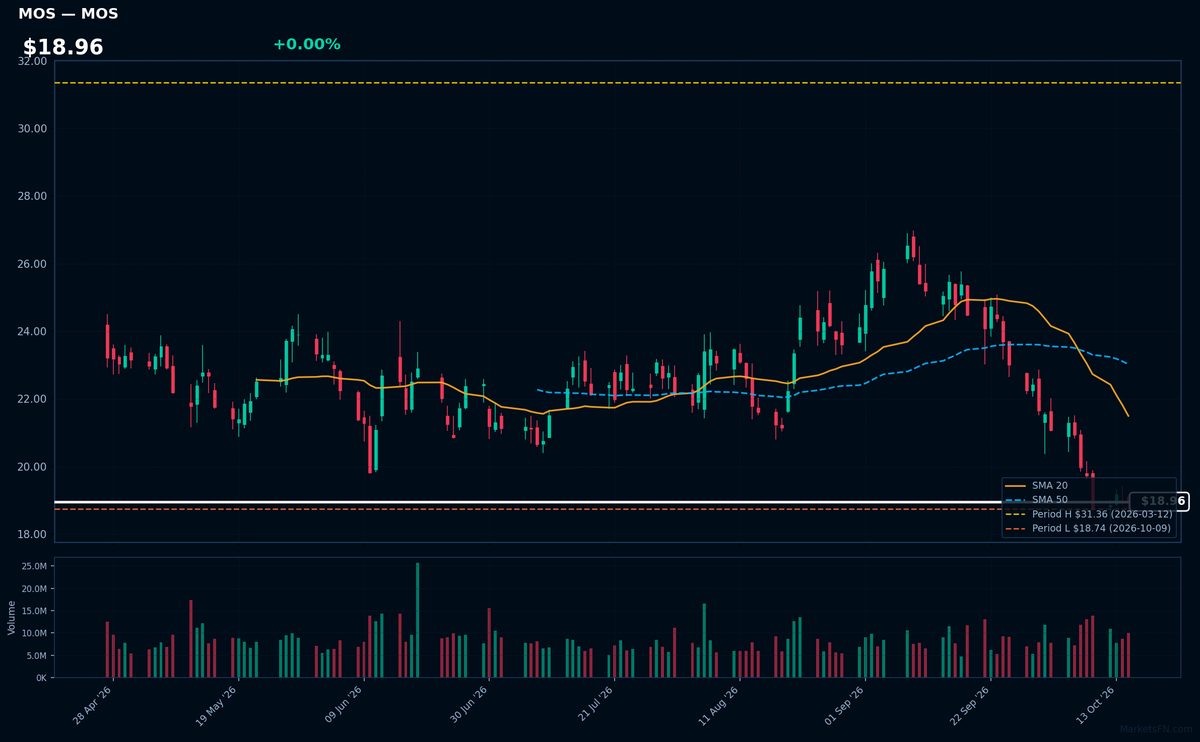
MOS | Mosaic Company | Basic Materials | Price Last: $18.95 | % Realized: -24.26% | RSI: 27.1 | % above MA200: -21.9% | Trend: Below MA20, MA50, MA200
The Mosaic Company produces concentrated phosphate and potash crop nutrients, serving global agricultural markets. Investors monitor MOS as a key fertilizer producer exposed to commodity cycles and food demand trends.
MOS shows extreme technical weakness: RSI(14) at 27.1 signals oversold conditions amid bearish MA alignment (price < MA20 < MA50 < MA200). Trading just 1.1% above YTD lows after a -24.3% 2026 decline, this reflects severe downside momentum, not fundamental strength.
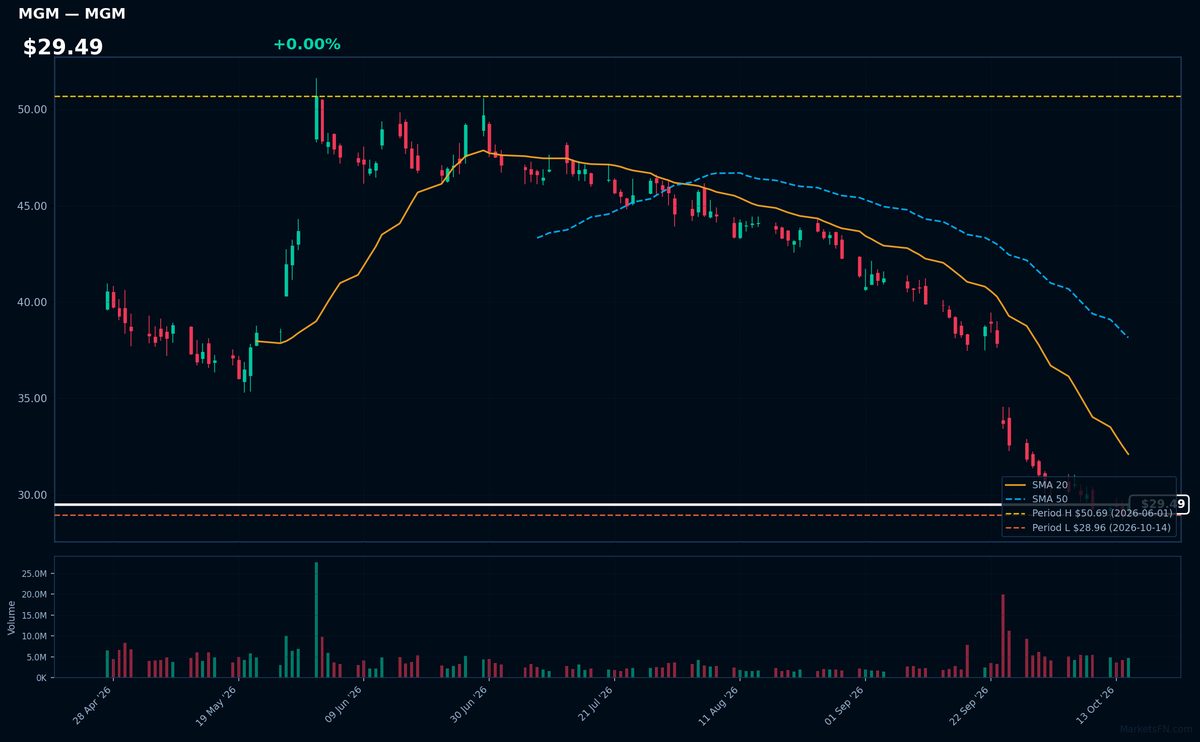
MGM | MGM Resorts International | Consumer Cyclical | Price Last: $29.48 | % Realized: -19.21% | RSI: 20.1 | % above MA200: -25.1% | Trend: Below MA20, MA50, MA200
MGM Resorts International operates luxury casinos, hotels, and entertainment venues in Las Vegas and regional US markets. Investors watch MGM as a pure-play on US gaming demand, particularly high-end resort spending and convention business in key markets like the Las Vegas Strip.
MGM shows extreme technical weakness: RSI(14) at 20.1 (oversold) with bearish MA alignment (price < MA20 < MA50 < MA200). Down 19.2% YTD and just 1.8% above 2026 lows, this signals severe selling pressure, not fundamental strength. The setup suggests capitulation risk near critical support.
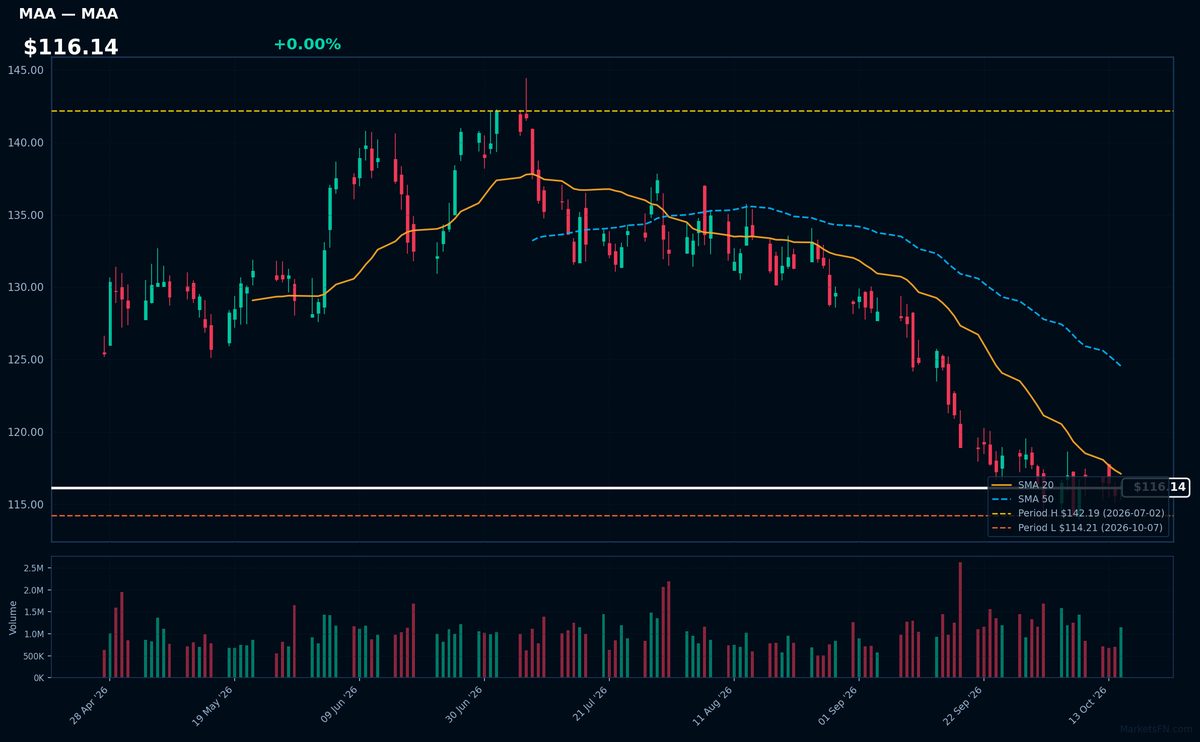
MAA | Mid-America Apartment Communities, Inc | Real Estate | Price Last: $116.27 | % Realized: -16.43% | RSI: 37.1 | % above MA200: -10.6% | Trend: Below MA20, MA50, MA200
Mid-America Apartment Communities (MAA) owns and operates over 100,000 apartment units across the Southeast and Southwest U.S., focusing on Sun Belt markets with strong demographic growth. Investors watch MAA for exposure to rental housing demand driven by migration trends and affordability pressures in these high-growth regions.
MAA shows bearish technicals: RSI(14) at 37.1 signals near-oversold conditions, while the sustained downtrend (price $116.14 below MA20/50/200) and -16.4% YTD decline test key support just 1.8% above 2026 lows. This reflects distribution, not accumulation.
Market Commentary
The S&P 500 stocks trading near their 2026 highs—Visa, Mastercard, Coca-Cola, Thermo Fisher, and Pfizer—reflect strong investor confidence in defensive sectors like payments, consumer staples, and healthcare. These industries typically outperform during economic uncertainty due to stable cash flows and resilient demand. Conversely, Prologis, Albemarle, Mosaic, MGM, and Mid-America Apartment Communities hovering near lows suggest pressure on real estate, commodities, and leisure sectors, likely tied to higher interest rates or cyclical downturns.
The divergence highlights a risk-off market environment favoring predictable earnings over cyclical exposure. Payment networks (V, MA) benefit from digital adoption, while healthcare (PFE, TMO) remains insulated from macro volatility. On the weak end, real estate (PLD, MAA) faces financing challenges, and lithium/fertilizer plays (ALB, MOS) may reflect softening commodity prices. Leisure (MGM) could be weighed down by consumer spending shifts.
Investors should monitor interest rate trajectories, commodity price trends, and consumer health for reversals in these extremes. A pivot toward cyclical sectors would signal renewed risk appetite, while persistent highs in defensives may confirm lingering caution. Earnings revisions and guidance from these bellwethers will be critical to validate their current positioning.
Methodology: All 503 S&P 500 constituents screened. Close prices downloaded from 2026-01-01. Period high = highest close since Jan 1 2026; period low = lowest close since Jan 1 2026. Distance = (current price / period extreme − 1) × 100. Technical indicators computed on up to 1 year of daily OHLCV data.
Disclaimer: For informational purposes only. Not investment advice. Past performance is not indicative of future results.