S&P 500 52-Week Highs & Lows Radar: Abbvie (ABBV), PepsiCo (PEP) and more
MarketsFN Team

S&P 500 52-Week Highs & Lows Radar: Abbvie (ABBV), PepsiCo (PEP) and more
Screening all 503 S&P 500 constituents for stocks nearest to their 52-week high and their 52-week low. Data as of October 07, 2026. % Realized = 52-week total return.
Legend: RSI > 70 = overbought · RSI < 30 = oversold · Green % Realized = positive 52W return · Red = negative.
📈 Nearest to 52-Week High
Sectors represented: Energy (3), Healthcare (1), Technology (1)
| Ticker | Company | Sector | Price Last | % Realized | 52-Week High Date | RSI | % above MA200 | Trend |
|---|---|---|---|---|---|---|---|---|
| ABBV | Abbvie Inc | Healthcare | $270.85 | +16.33% | 2026-10-07 | 65.9 | +16.7% | Above MA20, MA50, MA200 |
| MPC | Marathon Petroleum Corp | Energy | $444.00 | +131.81% | 2026-10-07 | 75.1 | +67.1% | Above MA20, MA50, MA200 |
| PSX | Phillips 66 | Energy | $274.43 | +107.32% | 2026-10-07 | 70.2 | +47.4% | Above MA20, MA50, MA200 |
| VLO | Valero Energy Corp | Energy | $427.14 | +161.78% | 2026-10-07 | 72.6 | +61.7% | Above MA20, MA50, MA200 |
| HPE | Hewlett Packard Enterprise Co | Technology | $71.48 | +186.95% | 2026-10-07 | 70.7 | +90.2% | Above MA20, MA50, MA200 |
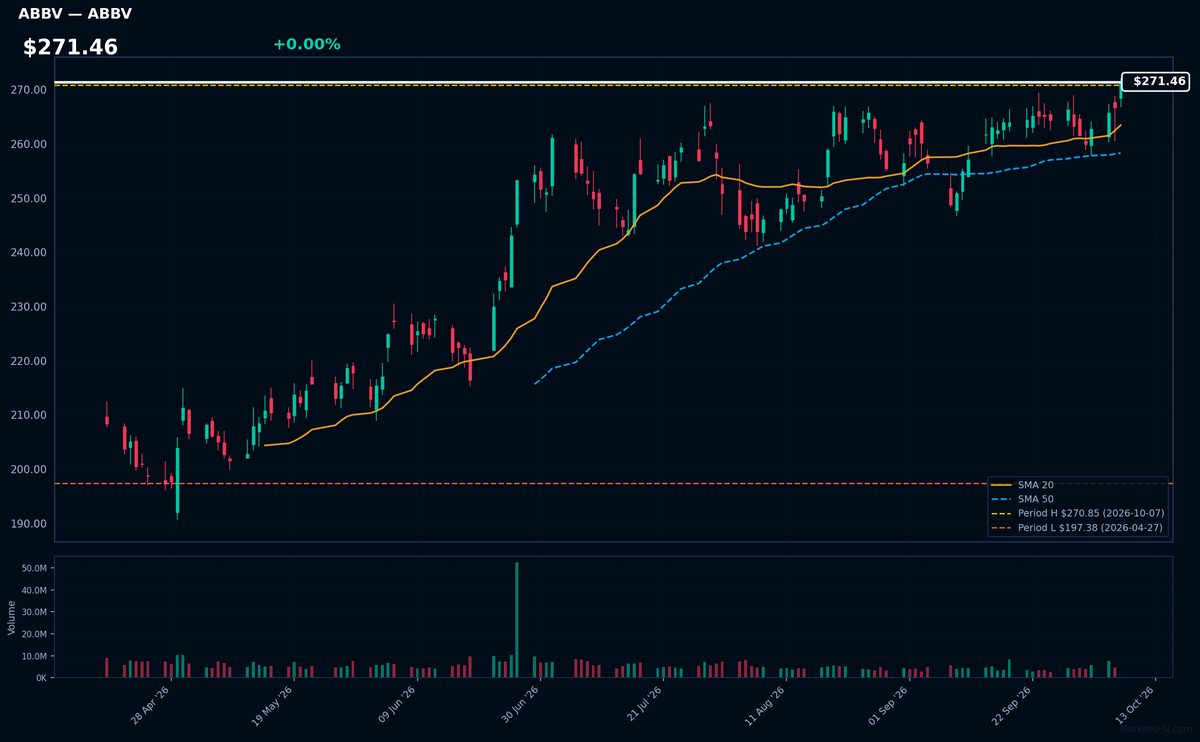
ABBV | Abbvie Inc | Healthcare | Price Last: $270.85 | % Realized: +16.33% | RSI: 65.9 | % above MA200: +16.7% | Trend: Above MA20, MA50, MA200
AbbVie is a biopharmaceutical leader specializing in immunology (Humira, Skyrizi) and oncology (Imbruvica, Venclexta), with a growing neuroscience pipeline. Investors care due to its high-margin biologic drugs, dividend aristocrat status, and strategic acquisitions to offset Humira biosimilar competition.
Technically bullish: RSI(14) at 65.9 shows strong momentum without overbought extremes, confirmed by bullish MA alignment (price > MA20 > MA50 > MA200). At 0.0% below 52-week highs, the 16.3% annual return suggests sustained institutional demand.
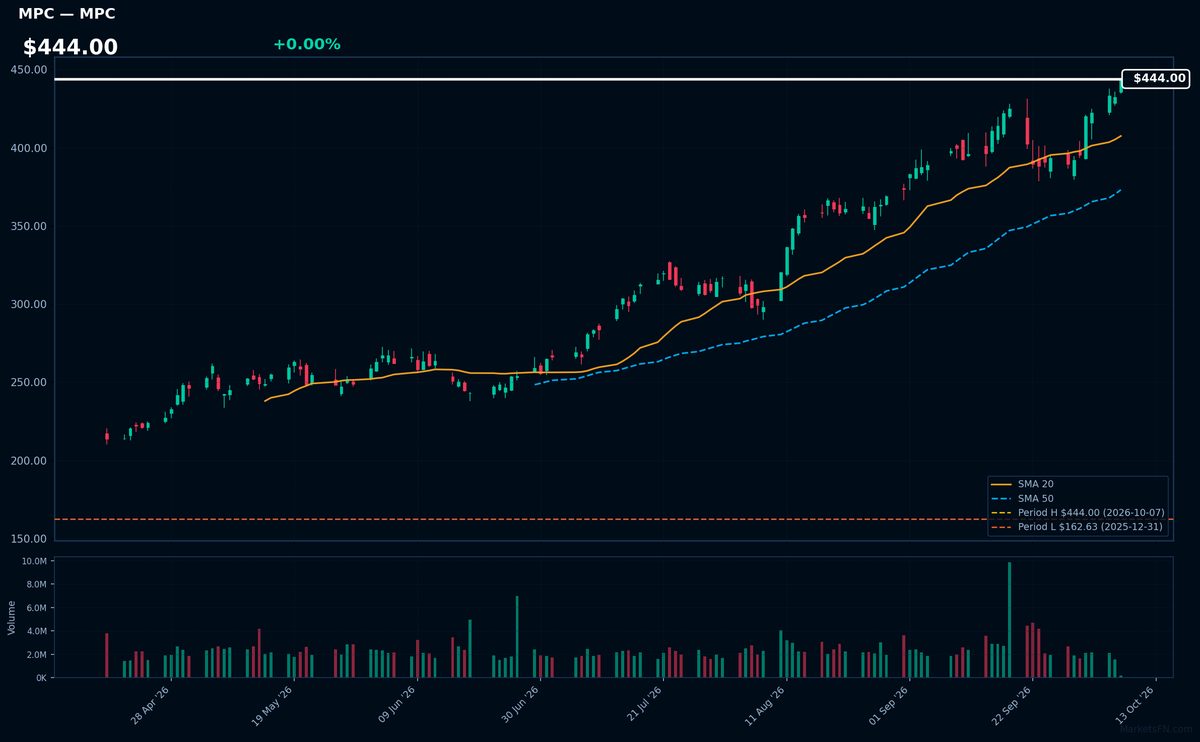
MPC | Marathon Petroleum Corp | Energy | Price Last: $444.00 | % Realized: +131.81% | RSI: 75.1 | % above MA200: +67.1% | Trend: Above MA20, MA50, MA200
Marathon Petroleum operates refineries, pipelines, and retail stations, processing crude into fuels and lubricants. Investors watch MPC as a key barometer of refining margins and energy demand, with its scale offering leverage to oil price swings.
MPC shows extreme bullish momentum (RSI 75.1, price > MA20 > MA50 > MA200) after a 131.8% 52-week surge, now testing 52-week highs. This suggests overbought conditions but confirms a strong uptrend.
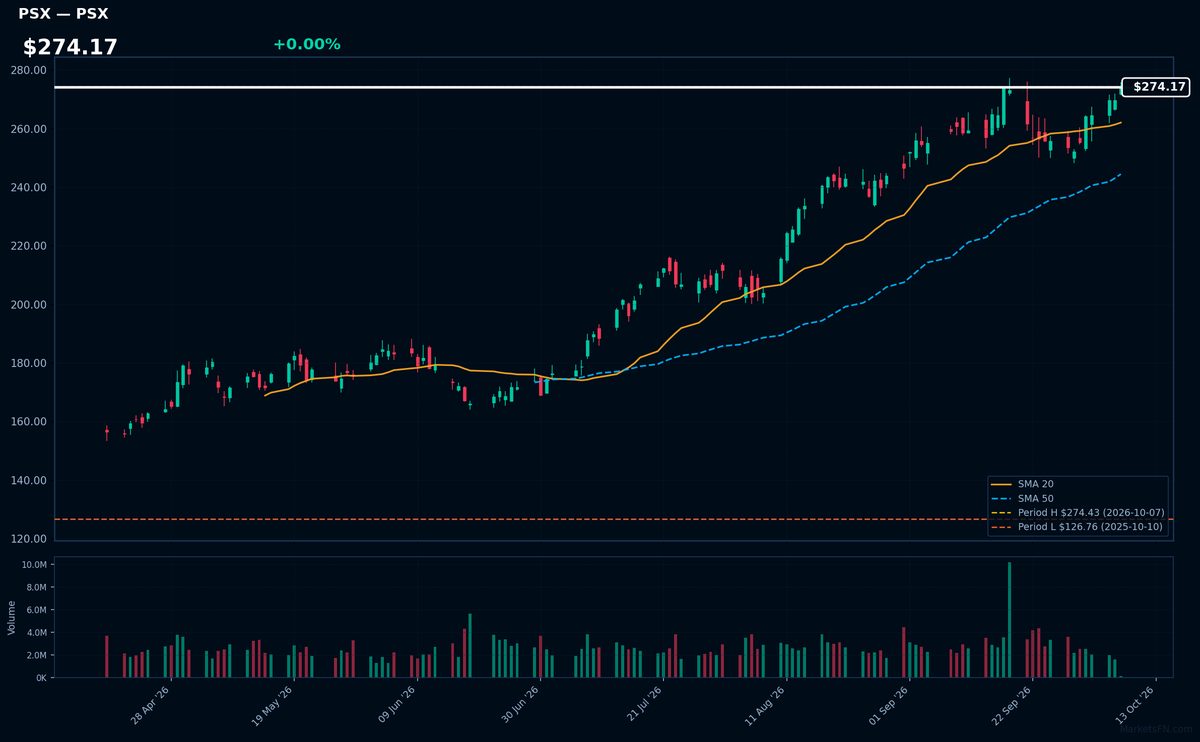
PSX | Phillips 66 | Energy | Price Last: $274.43 | % Realized: +107.32% | RSI: 70.2 | % above MA200: +47.4% | Trend: Above MA20, MA50, MA200
Phillips 66 refines, transports, and markets fuels and lubricants, operating 13 refineries and 7,000 branded outlets. Investors care because its integrated model captures margins across the energy value chain, evidenced by its 107.3% 52-week return amid volatile oil markets.
Technically overbought (RSI 70.2) but bullish (price > MA20 > MA50 > MA200), testing 52-week highs. Momentum suggests continuation risk if RSI holds.
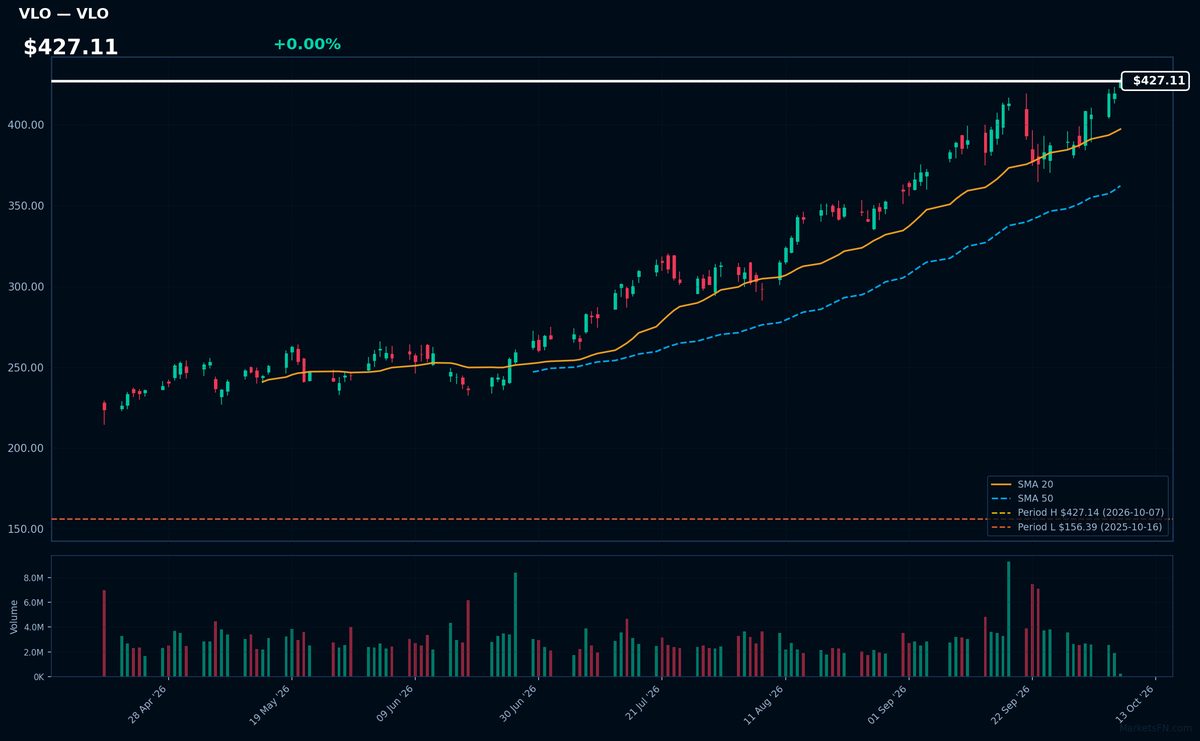
VLO | Valero Energy Corp | Energy | Price Last: $427.14 | % Realized: +161.78% | RSI: 72.6 | % above MA200: +61.7% | Trend: Above MA20, MA50, MA200
Valero Energy Corp operates refineries producing gasoline, diesel, and petrochemicals. Investors watch its margins on converting crude oil into fuels, which benefit from tight refining capacity and global energy demand shifts.
VLO shows extreme bullish momentum: RSI(14) at 72.6 (overbought), price > MA20 > MA50 > MA200, and 161.8% 52-week return. At 0.0% below its 52-week high, it tests breakout resistance.
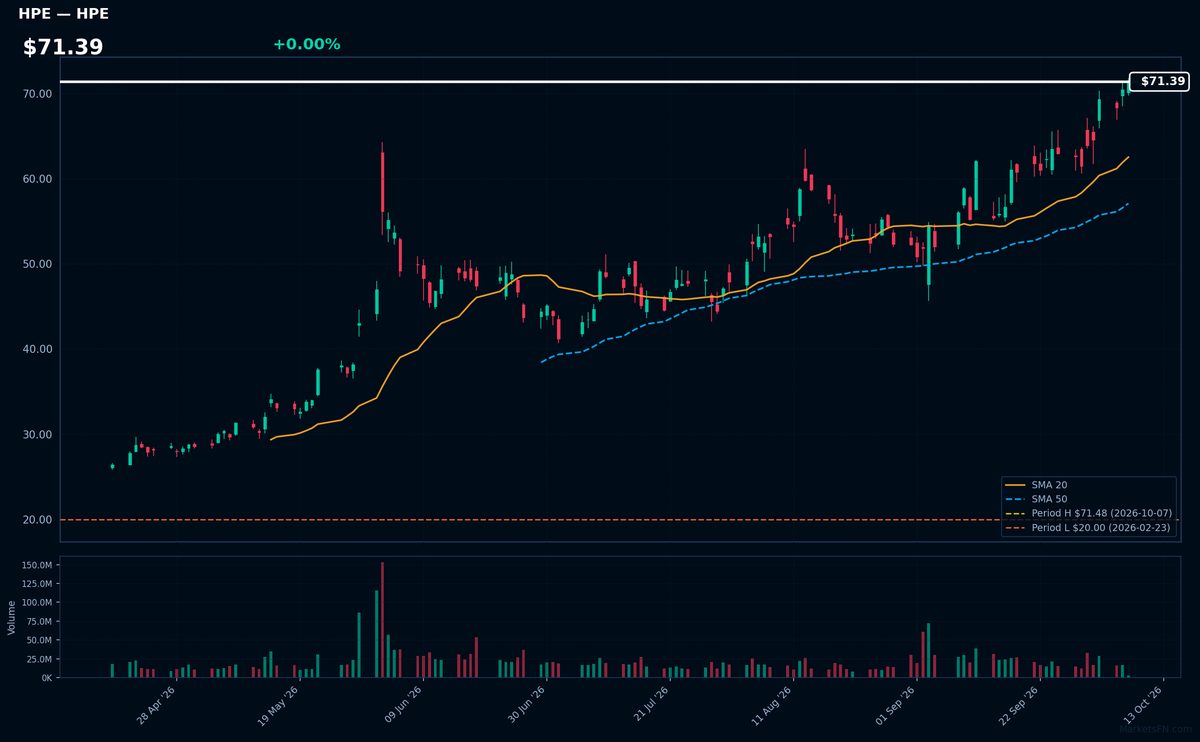
HPE | Hewlett Packard Enterprise Co | Technology | Price Last: $71.48 | % Realized: +186.95% | RSI: 70.7 | % above MA200: +90.2% | Trend: Above MA20, MA50, MA200
Hewlett Packard Enterprise provides enterprise IT solutions including servers, storage, networking, and hybrid cloud services. Investors should note its pivot toward high-growth areas like AI infrastructure and edge computing, with recent momentum suggesting market confidence in this transition.
Technically overbought with RSI(14) at 70.7 and bullish MA alignment (price > MA20 > MA50 > MA200). The 187% 52-week return and 0.0% proximity to 52-week high signal extreme momentum, warranting caution despite the uptrend.
📉 Nearest to 52-Week Low
Sectors represented: Industrials (2), Consumer Defensive (1), Communication Services (1), Consumer Cyclical (1)
| Ticker | Company | Sector | Price Last | % Realized | 52-Week Low Date | RSI | % above MA200 | Trend |
|---|---|---|---|---|---|---|---|---|
| PEP | PepsiCo Inc | Consumer Defensive | $125.35 | -10.97% | 2026-10-07 | 24.7 | -14.7% | Below MA20, MA50, MA200 |
| CMCSA | Comcast Corp | Communication Services | $21.19 | -26.11% | 2026-10-07 | 24.5 | -20.4% | Below MA20, MA50, MA200 |
| LHX | L3Harris Technologies Inc | Industrials | $235.41 | -21.90% | 2026-10-07 | 26.8 | -24.0% | Below MA20, MA50, MA200 |
| CPRT | Copart, Inc | Industrials | $26.58 | -39.89% | 2026-10-07 | 30.2 | -20.2% | Below MA20, MA50, MA200 |
| LVS | Las Vegas Sands Corp | Consumer Cyclical | $35.97 | -30.57% | 2026-10-07 | 19.5 | -29.8% | Below MA20, MA50, MA200 |
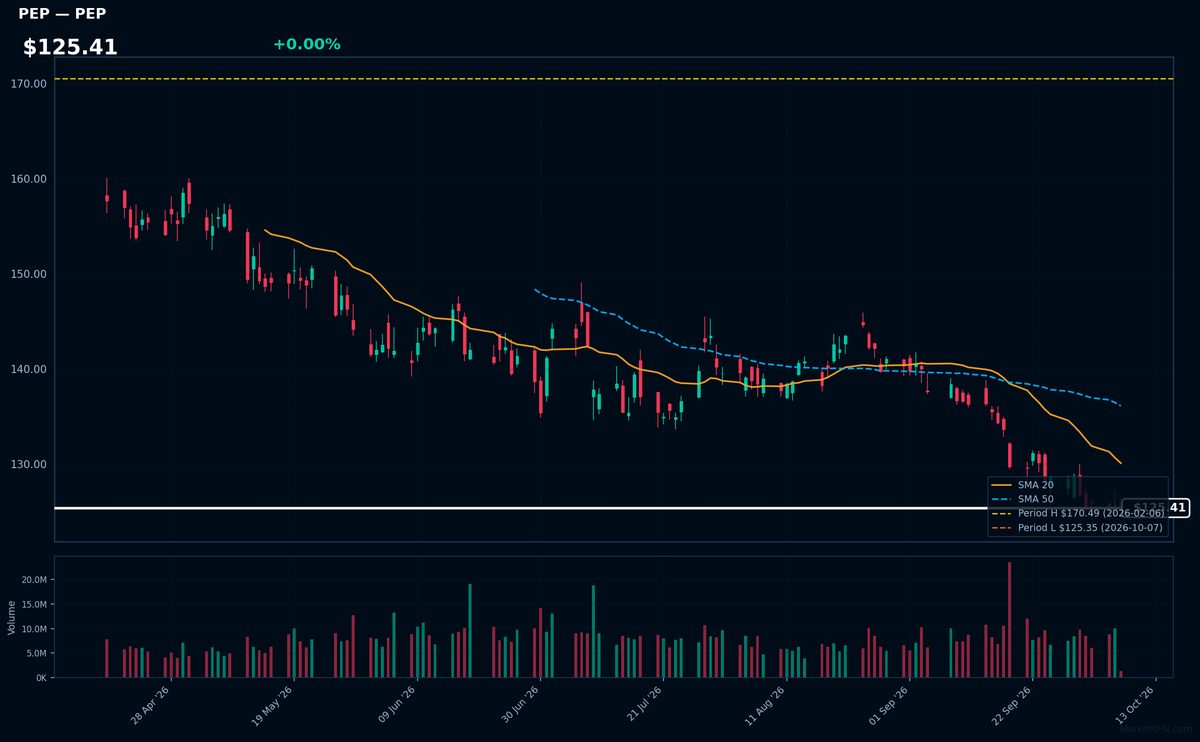
PEP | PepsiCo Inc | Consumer Defensive | Price Last: $125.35 | % Realized: -10.97% | RSI: 24.7 | % above MA200: -14.7% | Trend: Below MA20, MA50, MA200
PepsiCo dominates global snacks (Lay's, Cheetos) and beverages (Pepsi, Gatorade), with pricing power across recession-resistant categories. Investors care for its 6%+ dividend yield and consistent FCF generation, though recent volume declines raise questions about elasticity.
Technically broken: RSI at 24.7 (oversold) with bearish MA stack (price < MA20 < MA50 < MA200). Testing 52-week lows after -11% annual return signals distribution, not accumulation.
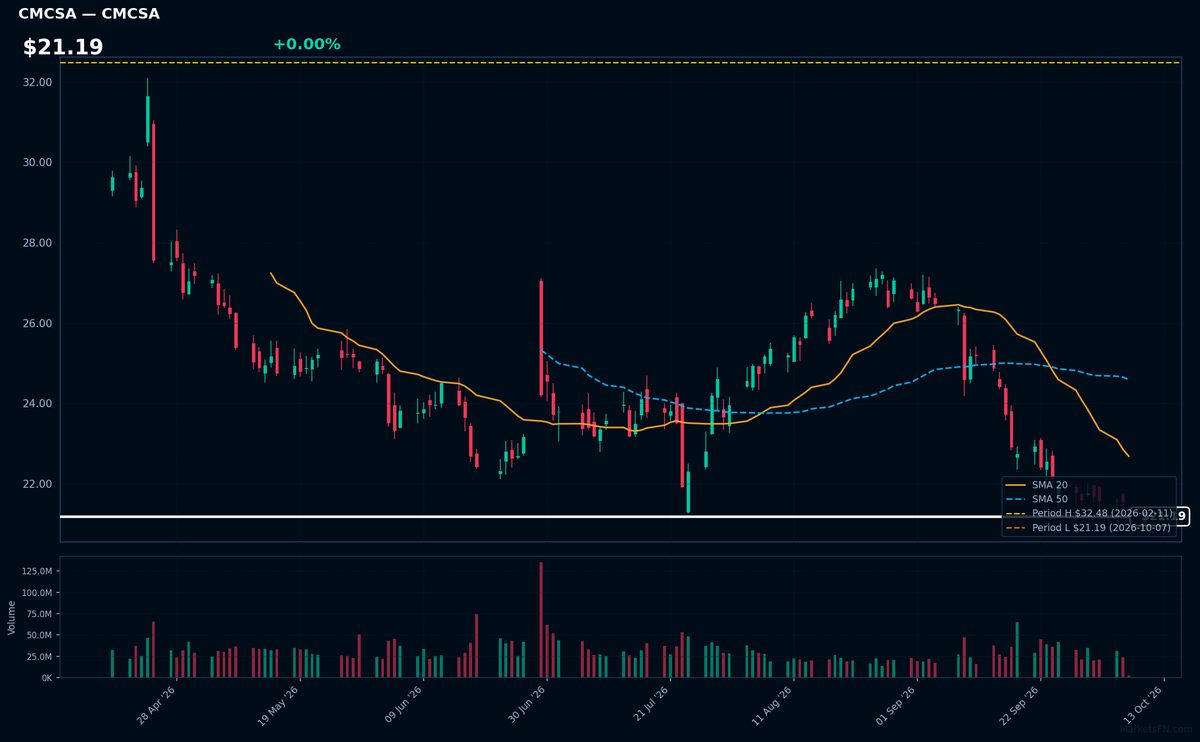
CMCSA | Comcast Corp | Communication Services | Price Last: $21.19 | % Realized: -26.11% | RSI: 24.5 | % above MA200: -20.4% | Trend: Below MA20, MA50, MA200
Comcast Corp (CMCSA) operates as a global media and technology company, providing cable communications, entertainment, and streaming services. Investors monitor its broadband dominance, NBCUniversal content assets, and Peacock streaming growth amid cord-cutting pressures and competitive challenges in the pay-TV and digital advertising markets.
CMCSA shows extreme technical weakness: RSI(14) at 24.5 (oversold), with bearish MA alignment (price < MA20 < MA50 < MA200) and just 0.0% above 52-week lows. The -26.1% annual return signals severe downtrend momentum, testing critical support. A warning sign absent fundamental catalysts.
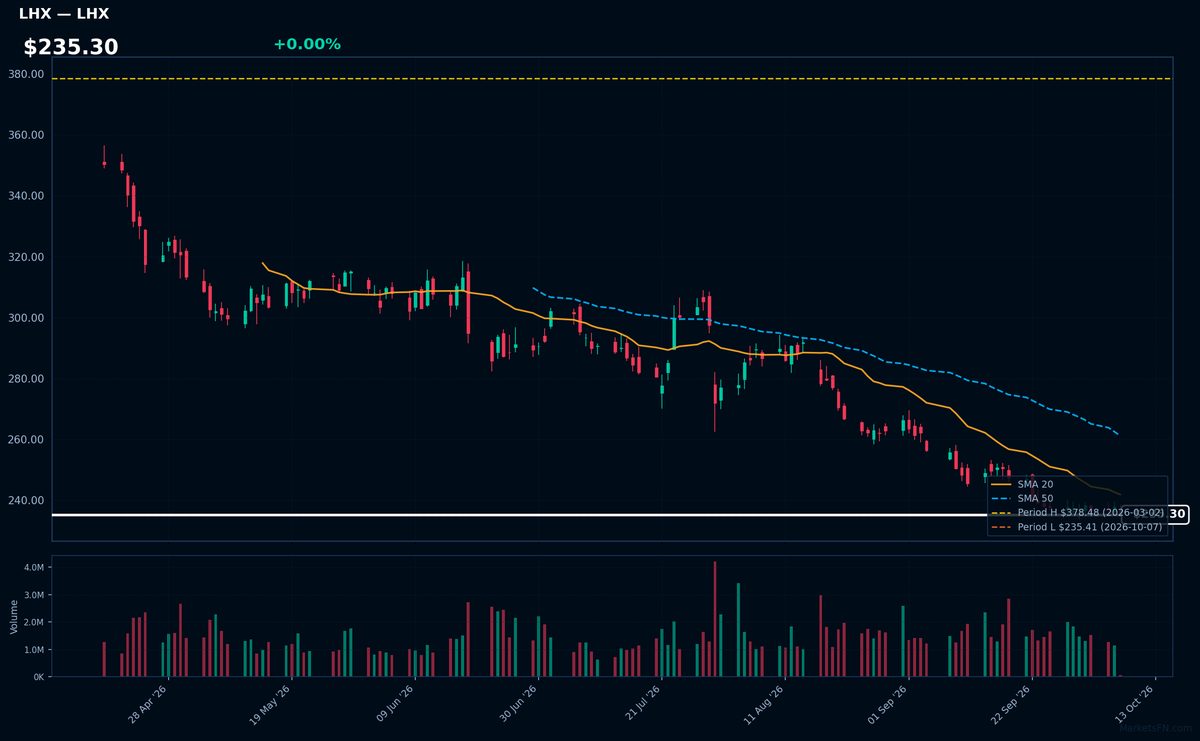
LHX | L3Harris Technologies Inc | Industrials | Price Last: $235.41 | % Realized: -21.90% | RSI: 26.8 | % above MA200: -24.0% | Trend: Below MA20, MA50, MA200
L3Harris Technologies provides mission-critical defense and aerospace solutions, including secure communications, electronic warfare, and space sensors. Investors care due to its defense sector resilience and classified government contracts that provide revenue visibility amid geopolitical tensions.
LHX shows extreme technical weakness: RSI(14) at 26.8 (oversold), bearish MA alignment (price < MA20 < MA50 < MA200), and just 0.0% above 52-week lows. The -21.9% annual return signals sustained downtrend, testing critical support.
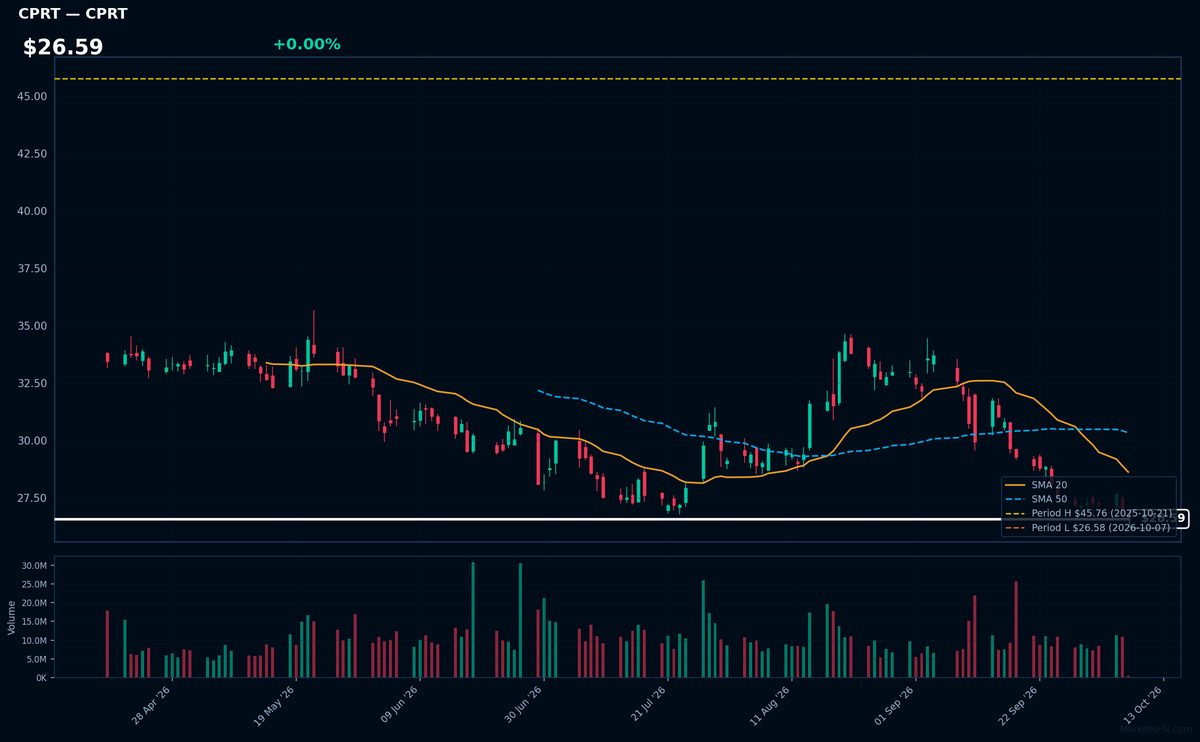
CPRT | Copart, Inc | Industrials | Price Last: $26.58 | % Realized: -39.89% | RSI: 30.2 | % above MA200: -20.2% | Trend: Below MA20, MA50, MA200
Copart operates an online vehicle auction platform, specializing in salvage and used cars for insurers, dealers, and individuals. Investors care because its asset-light model dominates a fragmented $10B+ market with high repeat-purchase dynamics and pricing power.
Technically dire: RSI(14) at 30.2 shows oversold conditions amid a sustained downtrend (price < MA20 < MA50 < MA200). Trading just 0.0% above 52-week lows after -39.9% annual decline signals severe bearish momentum, not fundamental strength.
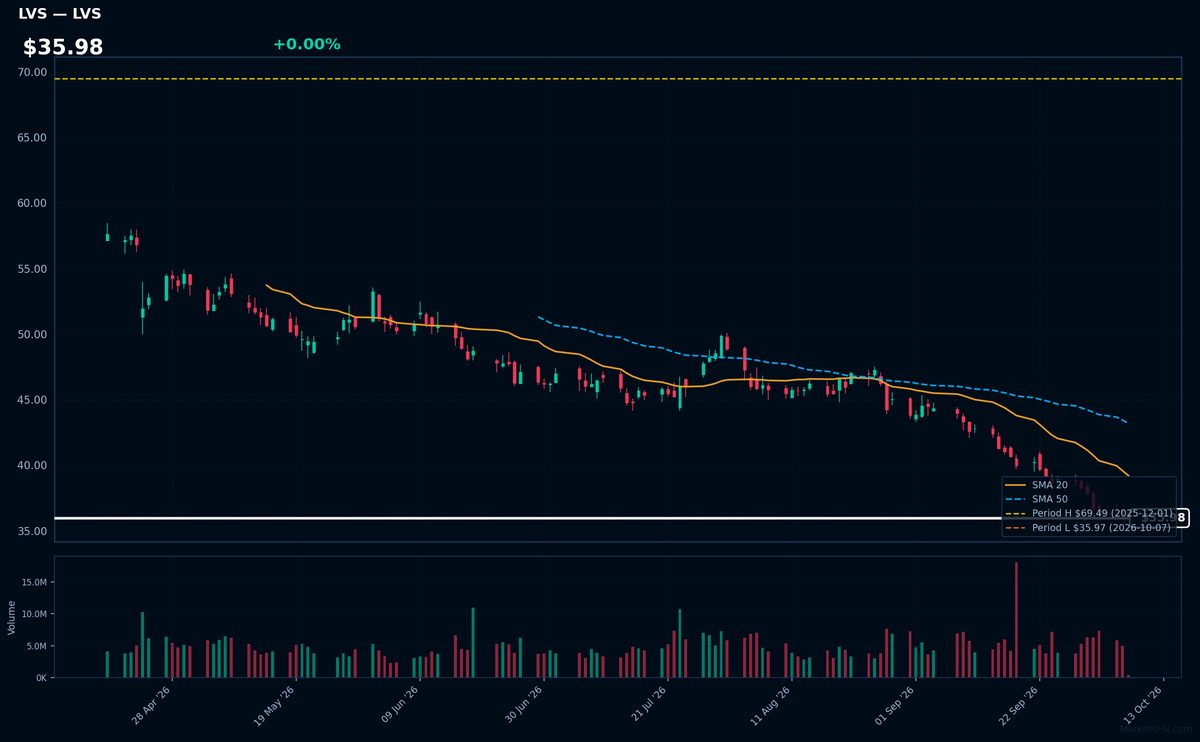
LVS | Las Vegas Sands Corp | Consumer Cyclical | Price Last: $35.97 | % Realized: -30.57% | RSI: 19.5 | % above MA200: -29.8% | Trend: Below MA20, MA50, MA200
Las Vegas Sands Corp operates integrated resorts in Macau and Singapore, including The Venetian and Marina Bay Sands. Investors watch LVS for exposure to Asian gaming recovery and high-margin convention business, though China's economic slowdown pressures Macau operations.
LVS shows extreme technical weakness: RSI(14) at 19.5 (oversold), with sustained bearish MA alignment (price < MA20 < MA50 < MA200) and just 0.0% above 52-week lows. The -30.6% annual return confirms severe downtrend.
Market Commentary
The clustering of S&P 500 stocks at 52-week extremes reflects divergent sector momentum and investor positioning. Energy refiners (MPC, PSX, VLO) and AbbVie (ABBV) trade at highs, signaling sustained demand for oil-linked equities and defensive healthcare, while consumer staples (PEP), communications (CMCSA), and gaming (LVS) languish near lows amid growth concerns. Such polarity often precedes rotational shifts as markets reassess earnings durability.
Sector rotation appears driven by macro themes: energy equities benefit from tight refining margins and geopolitical risk premiums, while ABBV's resilience underscores biopharma's defensive appeal. Conversely, PEP and CMCSA face pressure from input cost inflation and cord-cutting headwinds, respectively. LVS's weakness reflects Macau recovery uncertainties. The concentration of cyclical highs versus defensive lows suggests markets are pricing in economic resilience but remain selective on valuations.
Key levels to monitor include the 52-week highs for ABBV and the refiners—breaches could signal extended momentum, while reversals may indicate profit-taking. For laggards like LVS and PEP, holds above current lows are critical to avoid breakdowns. Catalysts include Q2 earnings guidance (particularly for HPE's IT spending exposure) and energy inventory data for refiners. Any Fed pivot narrative could disproportionately impact rate-sensitive CMCSA and CPRT.
Methodology: All 503 S&P 500 constituents screened. 52-week high = highest daily close over the past 252 trading days (approx. 1 year). 52-week low = lowest daily close over the same period. Distance = (current price / extreme − 1) × 100. Technical indicators computed on up to 1 year of daily OHLCV data.
Disclaimer: For informational purposes only. Not investment advice. Past performance is not indicative of future results.