Nasdaq 100 52-Week Highs & Lows Radar: Warner Bros. Discovery (WBD), PepsiCo (PEP) and more
MarketsFN Team

Nasdaq 100 52-Week Highs & Lows Radar: Warner Bros. Discovery (WBD), PepsiCo (PEP) and more
Screening all 101 Nasdaq 100 constituents for stocks nearest to their 52-week high and their 52-week low. Data as of September 29, 2026. % Realized = 52-week total return.
Legend: RSI > 70 = overbought · RSI < 30 = oversold · Green % Realized = positive 52W return · Red = negative.
📈 Nearest to 52-Week High
Sectors represented: Technology (3), Communication Services (1), Healthcare (1)
| Ticker | Company | Sector | Price Last | % Realized | 52-Week High Date | RSI | % above MA200 | Trend |
|---|---|---|---|---|---|---|---|---|
| WBD | Warner Bros. Discovery Inc | Communication Services | $30.85 | +63.60% | 2026-09-28 | 74.9 | +11.6% | Above MA20, MA50, MA200 |
| BIIB | Biogen Inc | Healthcare | $226.46 | +63.49% | 2026-09-28 | 60.0 | +16.5% | Above MA20, MA50, MA200 |
| CRWD | Crowdstrike Holdings Inc | Technology | $258.11 | +111.37% | 2026-09-23 | 63.8 | +70.5% | Above MA20, MA50, MA200 |
| AMD | Advanced Micro Devices Inc | Technology | $618.95 | +283.58% | 2026-09-25 | 67.3 | +67.9% | Above MA20, MA50, MA200 |
| AAPL | Apple Inc | Technology | $332.98 | +30.87% | 2026-09-25 | 54.7 | +15.5% | Above MA20, MA50, MA200 |
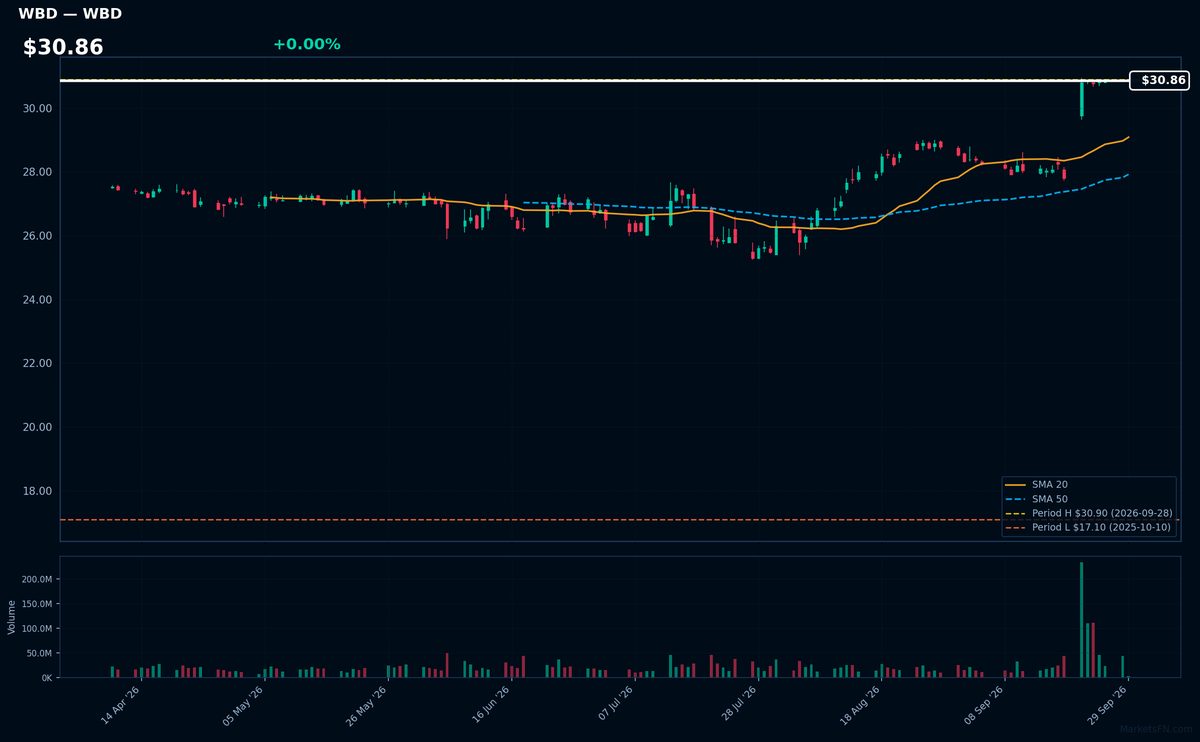
WBD | Warner Bros. Discovery Inc | Communication Services | Price Last: $30.85 | % Realized: +63.60% | RSI: 74.9 | % above MA200: +11.6% | Trend: Above MA20, MA50, MA200
Warner Bros. Discovery Inc is a media conglomerate with a diverse portfolio of entertainment and news assets, including Warner Bros. film studio, HBO, and Discovery Channel, making it a significant player in content creation and distribution.
WBD's RSI(14) is 74.9, indicating strong momentum as it's near overbought territory. The MA alignment (price > MA20 > MA50 > MA200) confirms a sustained uptrend, with the stock 0.1% below its 52-Week high, suggesting a potential breakout.
Related headlines
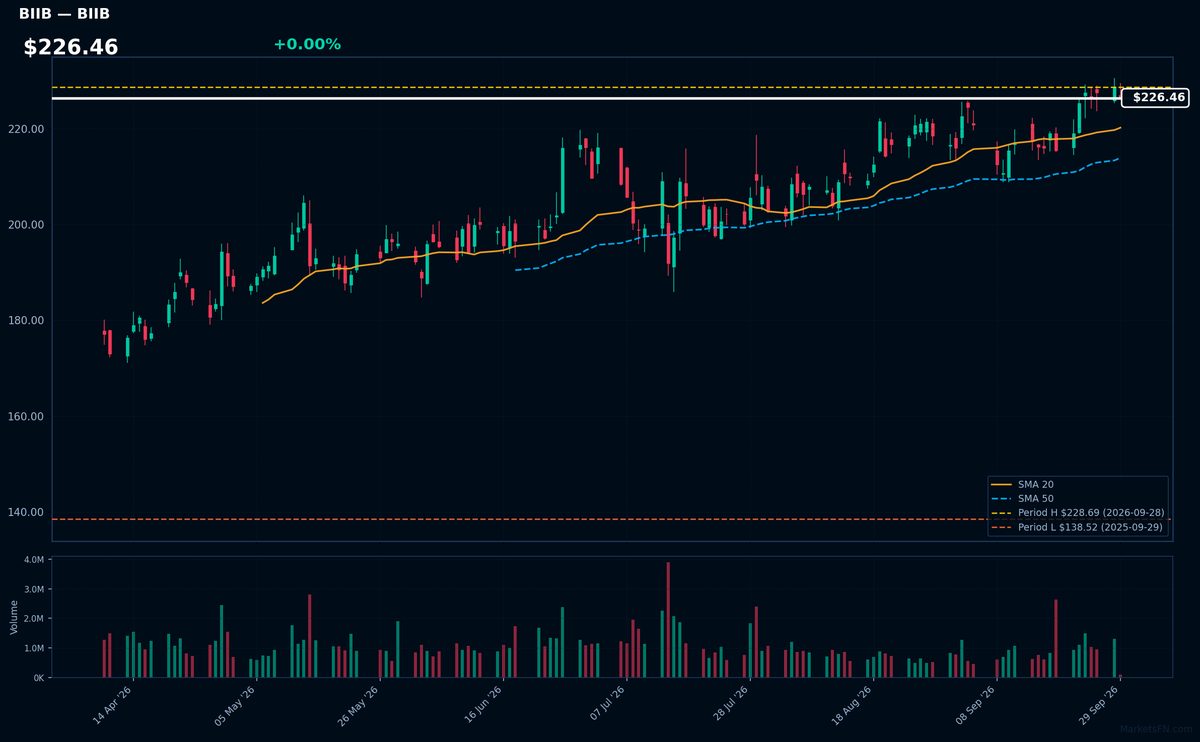
BIIB | Biogen Inc | Healthcare | Price Last: $226.46 | % Realized: +63.49% | RSI: 60.0 | % above MA200: +16.5% | Trend: Above MA20, MA50, MA200
Biogen Inc is a biotechnology company that develops treatments for neurological and neurodegenerative diseases. Investors should care because its therapies for conditions like multiple sclerosis have significant market potential and the company's pipeline impacts its growth prospects.
Biogen's current technical situation indicates sustained uptrend with price > MA20 > MA50 > MA200, RSI(14) at 60.0, and is 1.0% below its 52-Week high, suggesting momentum with a potential breakout, having returned 63.5% over the 52-Week period.
Related headlines
- Why Did KOD, RGEN, BIIB Stocks Rise To 52-Week Highs?
- Stoke Therapeutics and Biogen Present Long-Term Clinical Data that Support the Disease-Modifying Potential of Zorevunersen, an Investigational Medicine for the Treatment of Dravet Syndrome, at the 16th European Epilepsy Congress (EEC)
- Stoke Therapeutics and Biogen to present four-year zorevunersen data at epilepsy congress
- Stoke Therapeutics and Biogen Announce Presentations of Clinical Data from Studies of Zorevunersen, an Investigational Medicine for the Treatment of Dravet Syndrome, at the 16th European Epilepsy Congress (EEC)
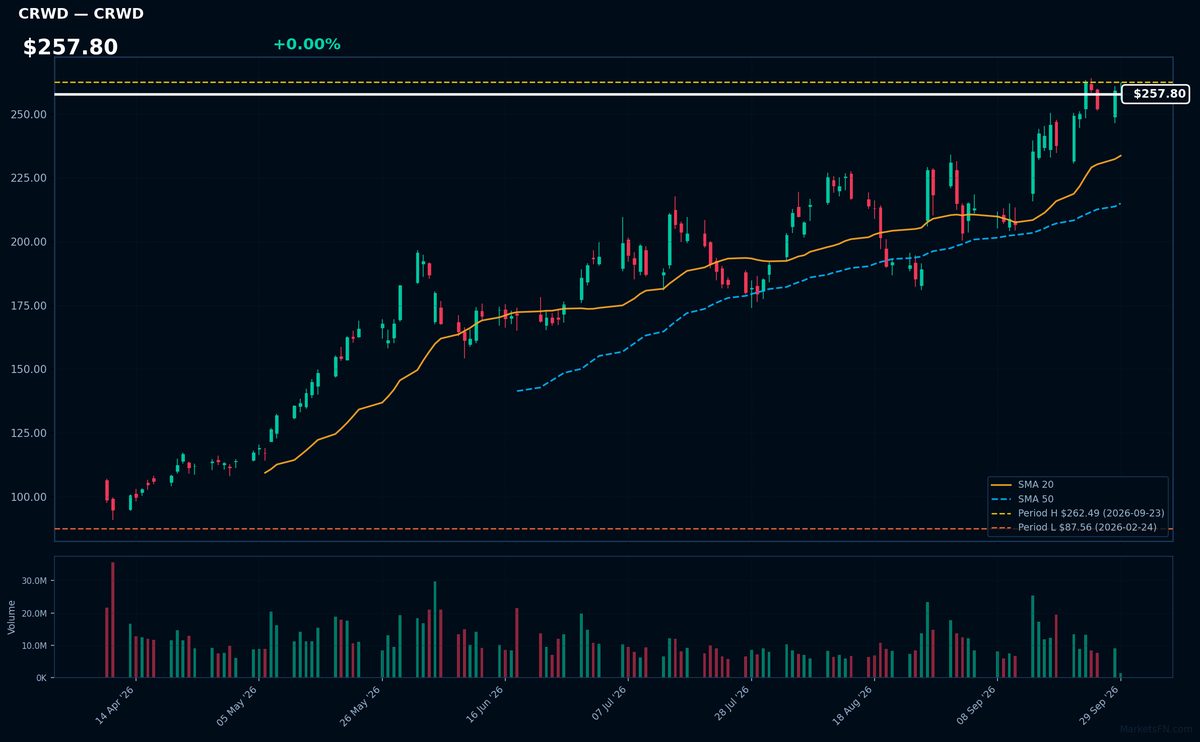
CRWD | Crowdstrike Holdings Inc | Technology | Price Last: $258.11 | % Realized: +111.37% | RSI: 63.8 | % above MA200: +70.5% | Trend: Above MA20, MA50, MA200
Crowdstrike Holdings Inc provides cloud-delivered endpoint security solutions, protecting enterprises from cyber threats. Investors should care as its innovative Falcon platform has driven significant growth, capitalizing on the increasing demand for robust cybersecurity measures in a digitally driven economy.
Crowdstrike's technicals indicate sustained uptrend with price > MA20 > MA50 > MA200. RSI(14) is 63.8, nearing overbought territory. The stock is 1.7% below its 52-Week high, suggesting potential breakout momentum, supported by a 111.4% 52-Week return.
Related headlines
- PANW, CRWD, ZS Lead Nasdaq-100 Gains As Nvidia's AI Agent Safety Push, Security Scares Lift Cybersecurity Stocks
- What Could Derail CrowdStrike Stock?
- S&P 500, Dow, Nasdaq End Week Higher On Chipmaker Strength, Easing Oil Amid Signs Of Easing US-Iran Conflict META, COST, MSFT, CRWD, SKHY In Focus
- CRWD Stock Slips: US Department Of Justice Reportedly Closes Investigation Of CrowdStrike Deals
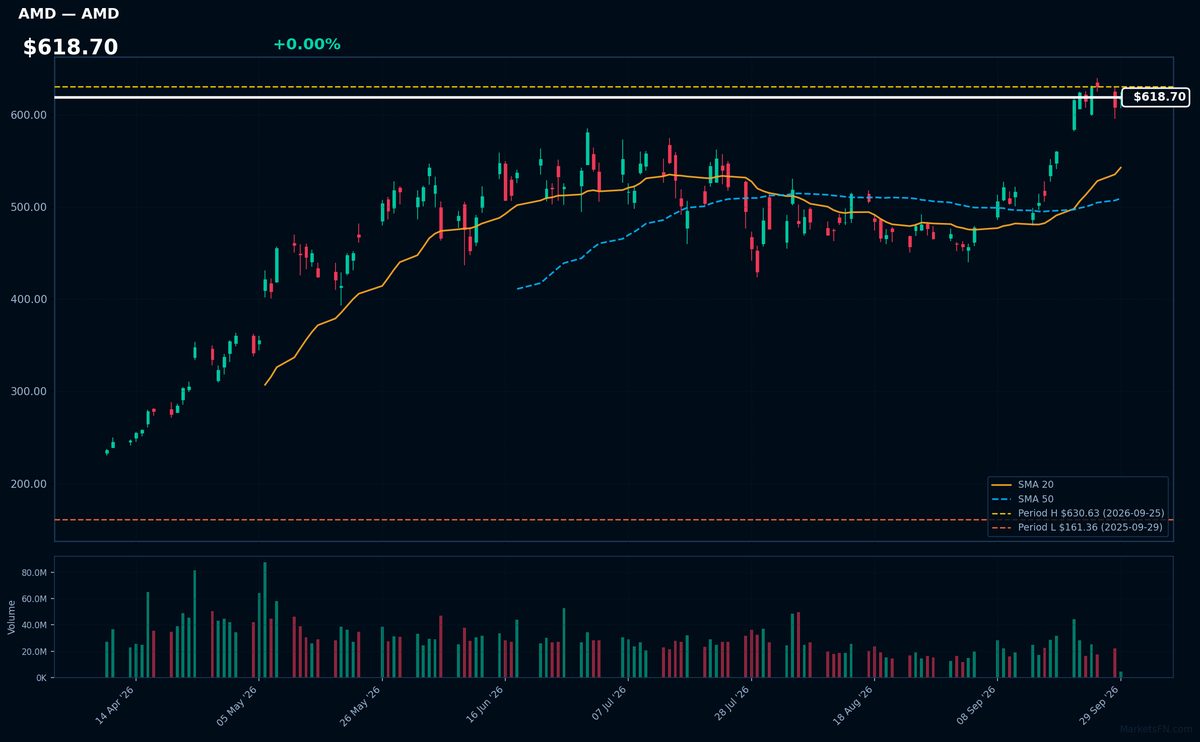
AMD | Advanced Micro Devices Inc | Technology | Price Last: $618.95 | % Realized: +283.58% | RSI: 67.3 | % above MA200: +67.9% | Trend: Above MA20, MA50, MA200
Advanced Micro Devices Inc designs and manufactures high-performance computing and graphics processing units, crucial for gaming PCs, data centers, and AI applications, making it a key player in the semiconductor industry with significant growth potential.
AMD's current technical situation indicates strong momentum: RSI(14) is 67.3, with a bullish MA alignment (price > MA20 > MA50 > MA200) and the stock is 1.9% below its 52-Week high, suggesting a potential breakout.
Related headlines
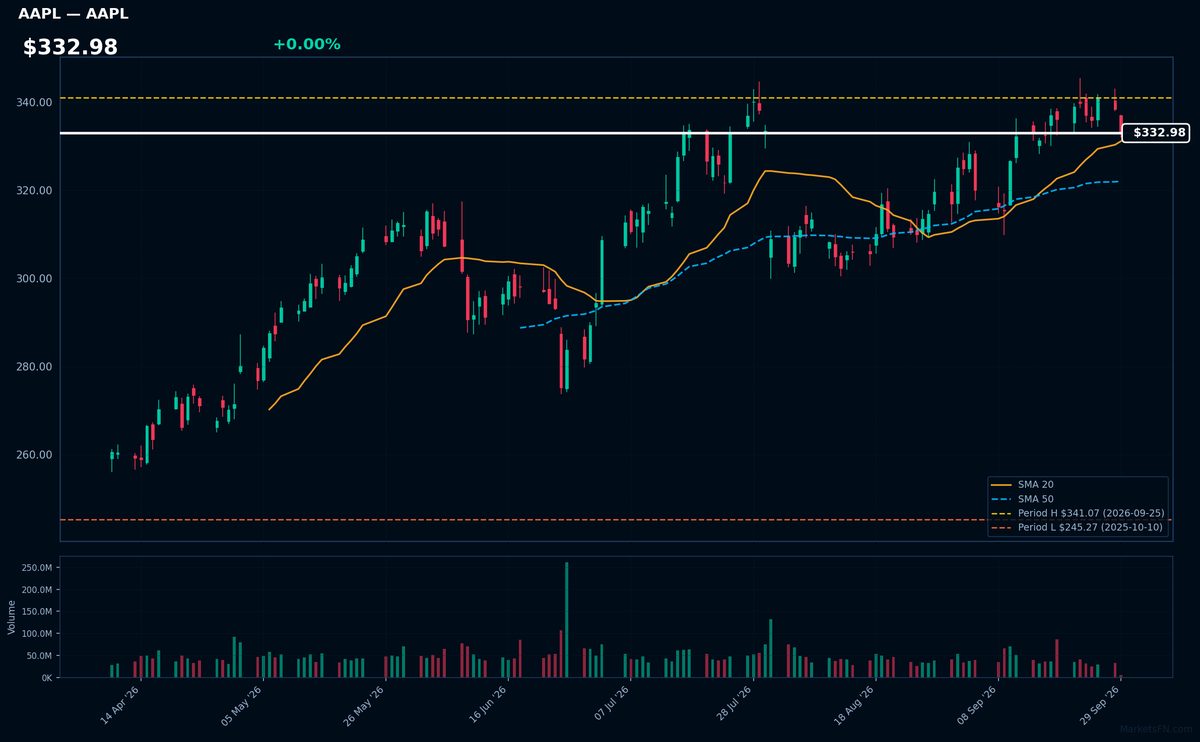
AAPL | Apple Inc | Technology | Price Last: $332.98 | % Realized: +30.87% | RSI: 54.7 | % above MA200: +15.5% | Trend: Above MA20, MA50, MA200
Apple Inc designs, manufactures, and markets consumer electronics, software, and services. Investors care about its innovative product ecosystem, services growth, and profitability. Its flagship products, like iPhones, drive revenue, while services like Apple Music and iCloud contribute to profitability.
AAPL is in a sustained uptrend with price > MA20 > MA50 > MA200. RSI(14) is 54.7, indicating neutral momentum. The stock is 2.4% below its 52-Week high, near a potential breakout, having returned 30.9% over the 52-Week period.
Related headlines
📉 Nearest to 52-Week Low
Sectors represented: Consumer Defensive (1), Communication Services (1), Real Estate (1), Industrials (1), Utilities (1)
| Ticker | Company | Sector | Price Last | % Realized | 52-Week Low Date | RSI | % above MA200 | Trend |
|---|---|---|---|---|---|---|---|---|
| PEP | PepsiCo Inc | Consumer Defensive | $128.04 | -8.66% | 2026-09-29 | 27.8 | -13.3% | Below MA20, MA50, MA200 |
| CMCSA | Comcast Corp | Communication Services | $21.74 | -26.34% | 2026-09-29 | 26.6 | -18.8% | Below MA20, MA50, MA200 |
| CSGP | Costar Group, Inc | Real Estate | $26.95 | -68.00% | 2026-09-29 | 31.7 | -33.7% | Below MA20, MA50, MA200 |
| CPRT | Copart, Inc | Industrials | $27.19 | -39.04% | 2026-07-21 | 30.2 | -19.2% | Below MA20, MA50, MA200 |
| EXC | Exelon Corp | Utilities | $40.32 | -8.92% | 2026-09-24 | 23.8 | -11.8% | Below MA20, MA50, MA200 |
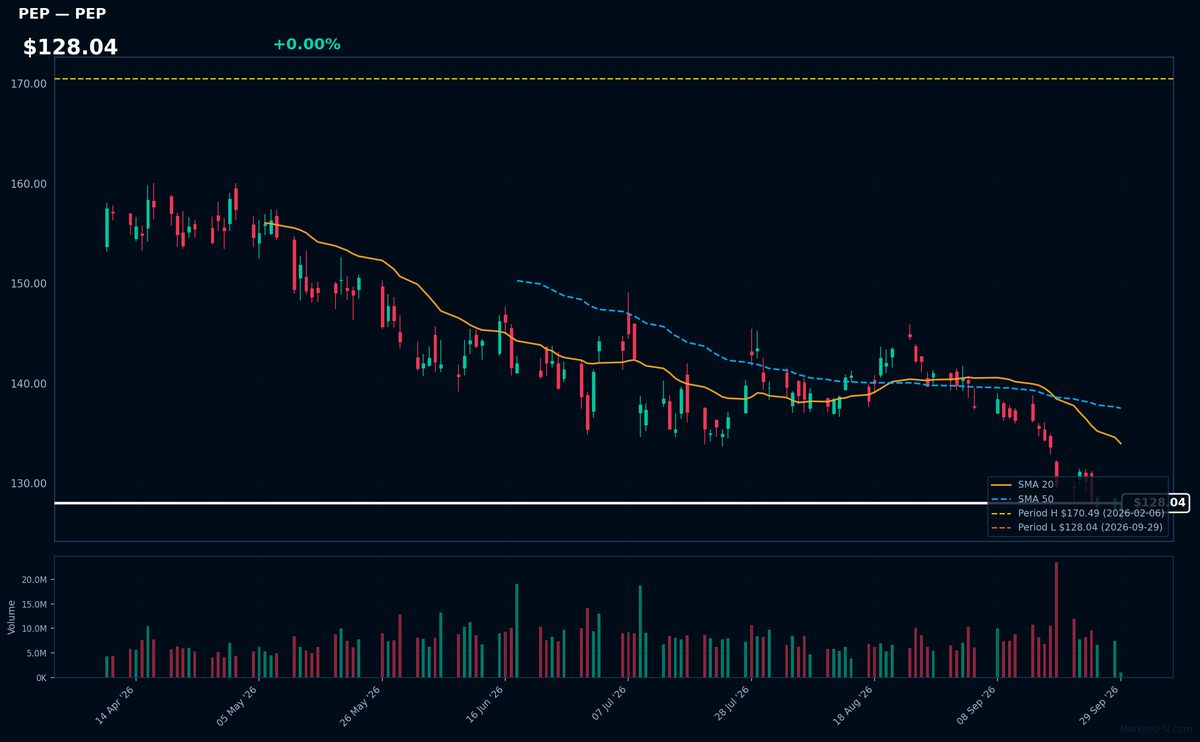
PEP | PepsiCo Inc | Consumer Defensive | Price Last: $128.04 | % Realized: -8.66% | RSI: 27.8 | % above MA200: -13.3% | Trend: Below MA20, MA50, MA200
PepsiCo Inc is a diversified food and beverage company with brands like Pepsi, Lay's, and Gatorade, generating revenue through beverage sales, snack foods, and other categories, making it a significant player in the consumer staples sector.
PepsiCo's current technical situation is bearish, with an RSI(14) of 27.8 indicating oversold conditions, and a sustained downtrend as price ($128.04) remains below MA20, MA50, and MA200, testing major support at its 52-Week low.
Related headlines
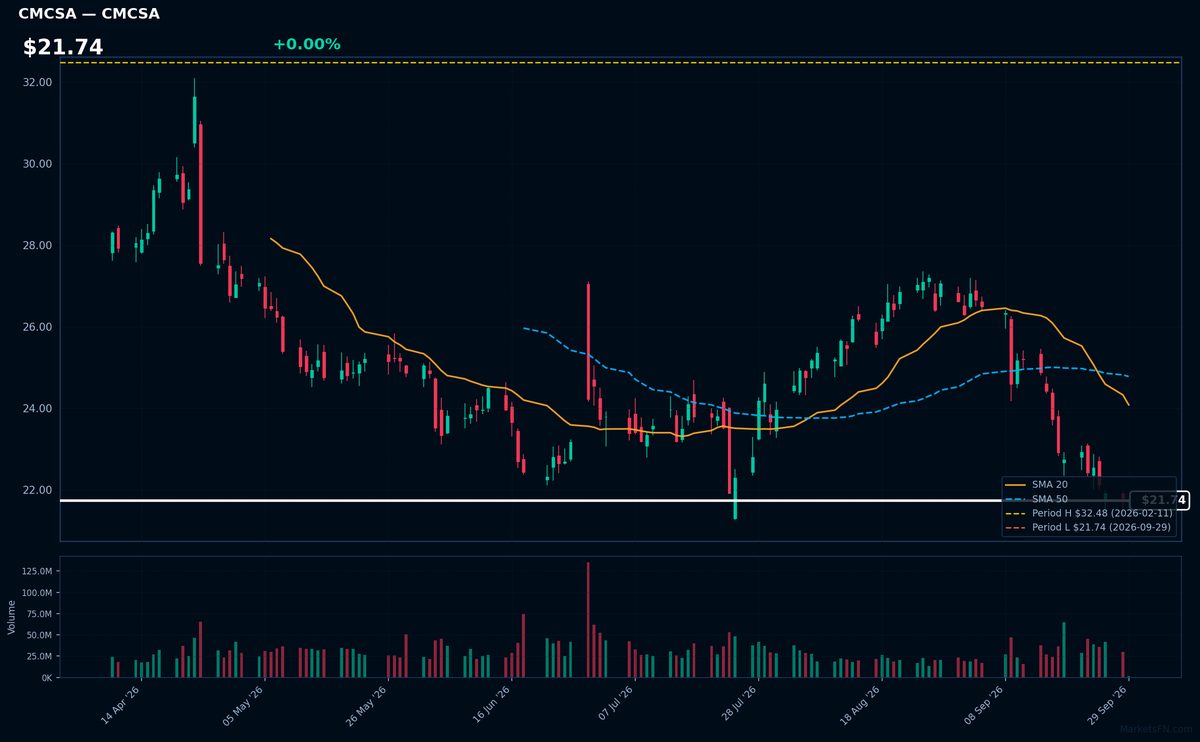
CMCSA | Comcast Corp | Communication Services | Price Last: $21.74 | % Realized: -26.34% | RSI: 26.6 | % above MA200: -18.8% | Trend: Below MA20, MA50, MA200
Comcast Corp is a media and telecommunications conglomerate providing cable television, internet, and phone services, as well as owning NBCUniversal, a major media company with film, television, and theme park assets, making it a significant player in both consumer connectivity and entertainment content.
Comcast Corp's current technical situation is bearish, with an RSI(14) of 26.6 indicating oversold conditions, and a bearish MA alignment (price < MA20 < MA50 < MA200), with the stock at its 52-Week low, suggesting a sustained downtrend and potential further decline.
Related headlines
- Comcast NBCUniversal Announces $2.5 Million in Unrestricted Grants to 80 Nonprofits
- TMUS, CMCSA Stock Price Targets Cut Barclays Warns Of Limited Upside Ahead Of Q3 Earnings
- Comcast and Fastly's New Content Delivery Model Powers Highest Quality Experience for Peacock's Biggest Live Events
- Xfinity and Comcast Business High-Speed Internet Now Available to More Than 2,300 Homes and Businesses in Clay County, Florida
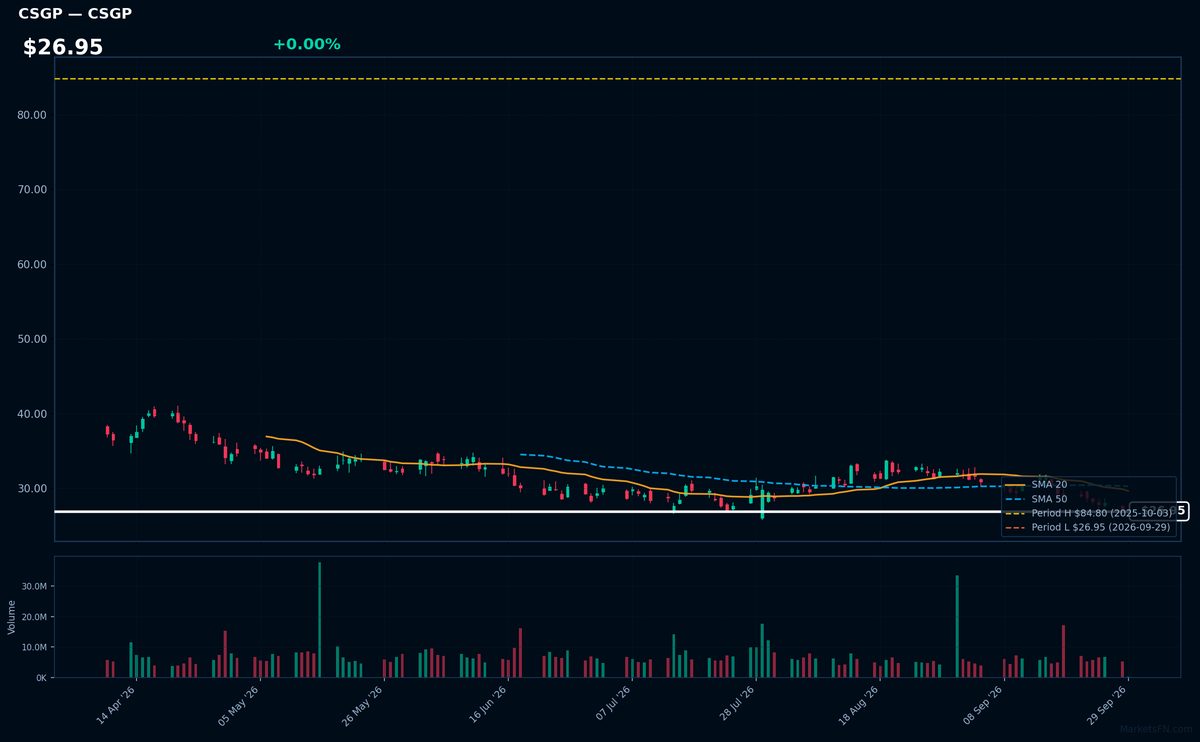
CSGP | Costar Group, Inc | Real Estate | Price Last: $26.95 | % Realized: -68.00% | RSI: 31.7 | % above MA200: -33.7% | Trend: Below MA20, MA50, MA200
Costar Group, Inc provides commercial real estate information, analytics, and online marketplaces, enabling investors to assess market trends and make informed decisions. Its data-driven platform is crucial for investors to navigate the commercial real estate market.
The stock is in a sustained downtrend with price ($26.95) below MA20, MA50, and MA200. RSI(14) is 31.7, nearing oversold territory, and the stock is 0.0% above its 52-Week low, indicating a potential support test.
Related headlines
- Oklahoma City, Hartford and Cleveland Among Top Markets in CoStars Bulk Logistics Performance Ranking
- CoStar Group Inc. stock falls Monday, underperforms market
- Tampa, Columbus Lead CoStar's Small-Bay Industrial Performance Ranking
- CoStars Revenue Growth Fell 9% in Two Quarters. Heres What It Isnt Saying
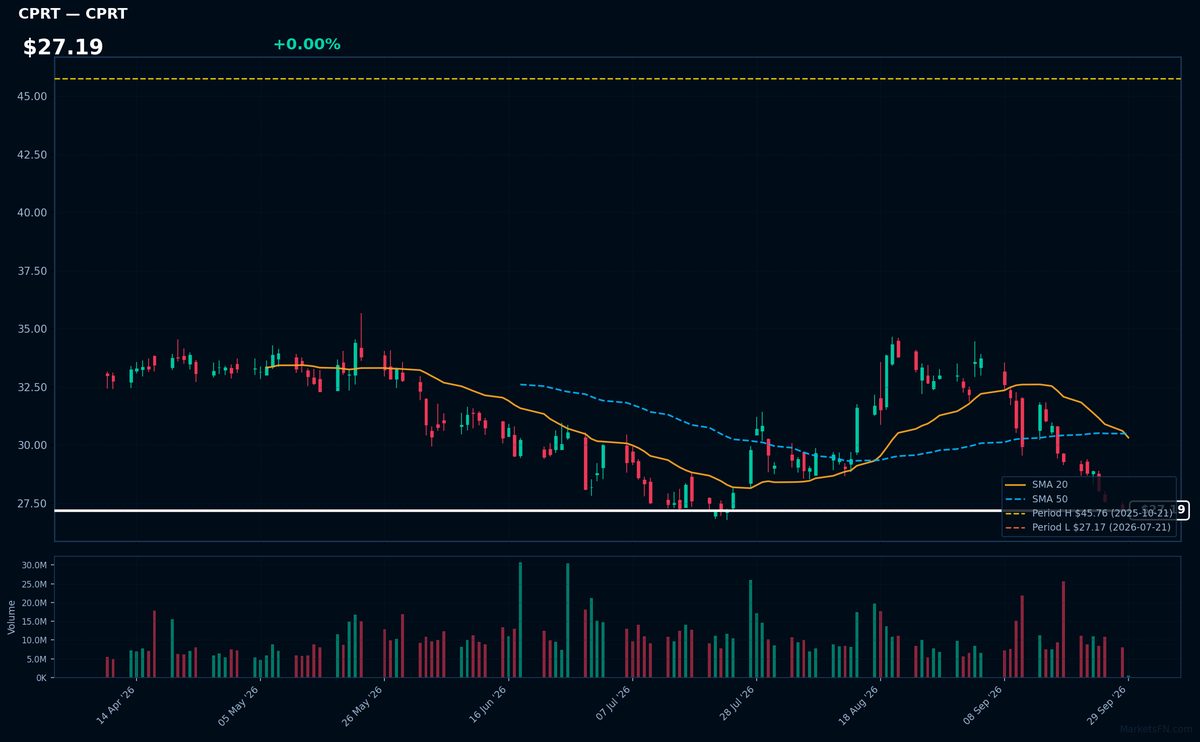
CPRT | Copart, Inc | Industrials | Price Last: $27.19 | % Realized: -39.04% | RSI: 30.2 | % above MA200: -19.2% | Trend: Below MA20, MA50, MA200
Copart, Inc (CPRT) operates online vehicle auction platforms, connecting buyers and sellers in the automotive salvage and used vehicle markets. Investors should care because CPRT's platform has become a leading destination for insurance companies and other sellers to dispose of damaged or decommissioned vehicles.
CPRT's technical situation is bearish, with an RSI(14) of 30.2 indicating oversold conditions, and a sustained downtrend as price ($27.19) remains below MA20, MA50, and MA200. The stock is 0.1% above its 52-Week low, testing major support.
Related headlines
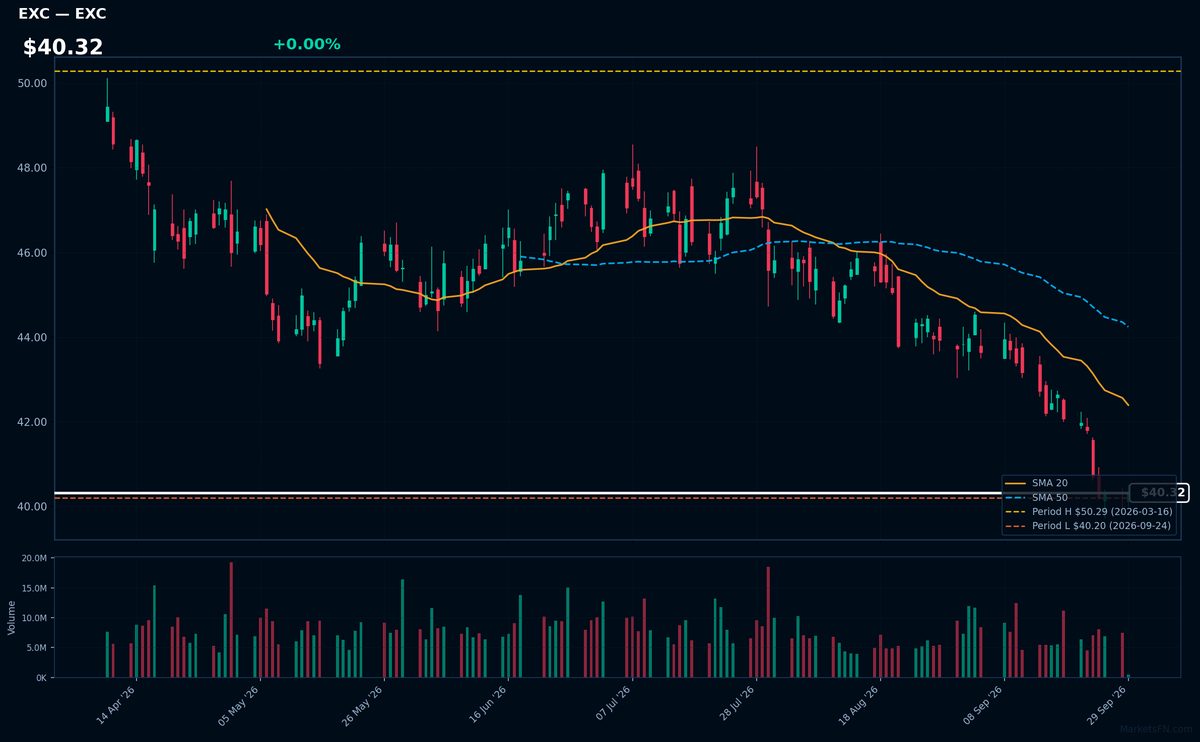
EXC | Exelon Corp | Utilities | Price Last: $40.32 | % Realized: -8.92% | RSI: 23.8 | % above MA200: -11.8% | Trend: Below MA20, MA50, MA200
Exelon Corp is a utility company that generates and distributes electricity, operating nuclear, natural gas, and renewable energy facilities. Investors should care due to its significant role in the energy sector and potential for stable cash flows.
Exelon Corp's technical situation is bearish, with an RSI(14) of 23.8 indicating oversold conditions, and a sustained downtrend as price ($40.32) remains below MA20, MA50, and MA200, with the stock near its 52-Week low.
Related headlines
Market Commentary
The Nasdaq 100 stocks near 52-week extremes signal a significant shift in market sentiment. Stocks like WBD, BIIB, CRWD, AMD, and AAPL are close to their 52-week highs, while PEP, CMCSA, CSGP, CPRT, and EXC are near their 52-week lows. This indicates a strong divergence in performance within the Nasdaq 100.
The technology sector is driving the price levels of these stocks, with companies like CRWD and AMD benefiting from the growing demand for cybersecurity and semiconductor solutions. Macro themes such as the ongoing tech industry consolidation and the shift towards cloud-based services are also influencing the market. The performance of these stocks near extremes may be related to these underlying trends.
Key levels to watch include the 52-week highs and lows for these stocks. A breakout above the 52-week high for WBD, BIIB, CRWD, AMD, and AAPL could signal further upside, while a breakdown below the 52-week low for PEP, CMCSA, CSGP, CPRT, and EXC may indicate additional downside. Potential catalysts for a breakout or breakdown include earnings reports and industry trends.
Methodology: All 101 Nasdaq 100 constituents screened. 52-week high = highest daily close over the past 252 trading days (approx. 1 year). 52-week low = lowest daily close over the same period. Distance = (current price / extreme − 1) × 100. Technical indicators computed on up to 1 year of daily OHLCV data.
Disclaimer: For informational purposes only. Not investment advice. Past performance is not indicative of future results.