S&P 500 2026 YTD Highs & Lows Radar: NVIDIA (NVDA), Boston Scientific (BSX) and more
MarketsFN Team

S&P 500 2026 YTD Highs & Lows Radar: NVIDIA (NVDA), Boston Scientific (BSX) and more
Screening all 503 S&P 500 constituents for stocks nearest to their 2026 year-to-date high and their 2026 YTD low. Data as of October 07, 2026. % Realized = total return since Jan 1 2026.
Legend: RSI > 70 = overbought · RSI < 30 = oversold · Green % Realized = positive YTD return · Red = negative.
📈 Nearest to 2026 High
Sectors represented: Technology (4), Healthcare (1)
| Ticker | Company | Sector | Price Last | % Realized | 2026 YTD High Date | RSI | % above MA200 | Trend |
|---|---|---|---|---|---|---|---|---|
| NVDA | NVIDIA Corp | Technology | $239.24 | +26.68% | 2026-10-06 | 65.6 | +18.6% | Above MA20, MA50, MA200 |
| MSFT | Microsoft Corporation | Technology | $529.30 | +11.92% | 2026-10-06 | 67.1 | +22.1% | Above MA20, MA50, MA200 |
| ABBV | Abbvie Inc | Healthcare | $266.69 | +16.30% | 2026-10-06 | 65.3 | +14.9% | Above MA20, MA50, MA200 |
| AMD | Advanced Micro Devices Inc | Technology | $649.42 | +190.61% | 2026-10-06 | 70.8 | +70.3% | Above MA20, MA50, MA200 |
| ANET | Arista Networks Inc | Technology | $215.36 | +61.20% | 2026-10-06 | 61.3 | +34.4% | Above MA20, MA50, MA200 |
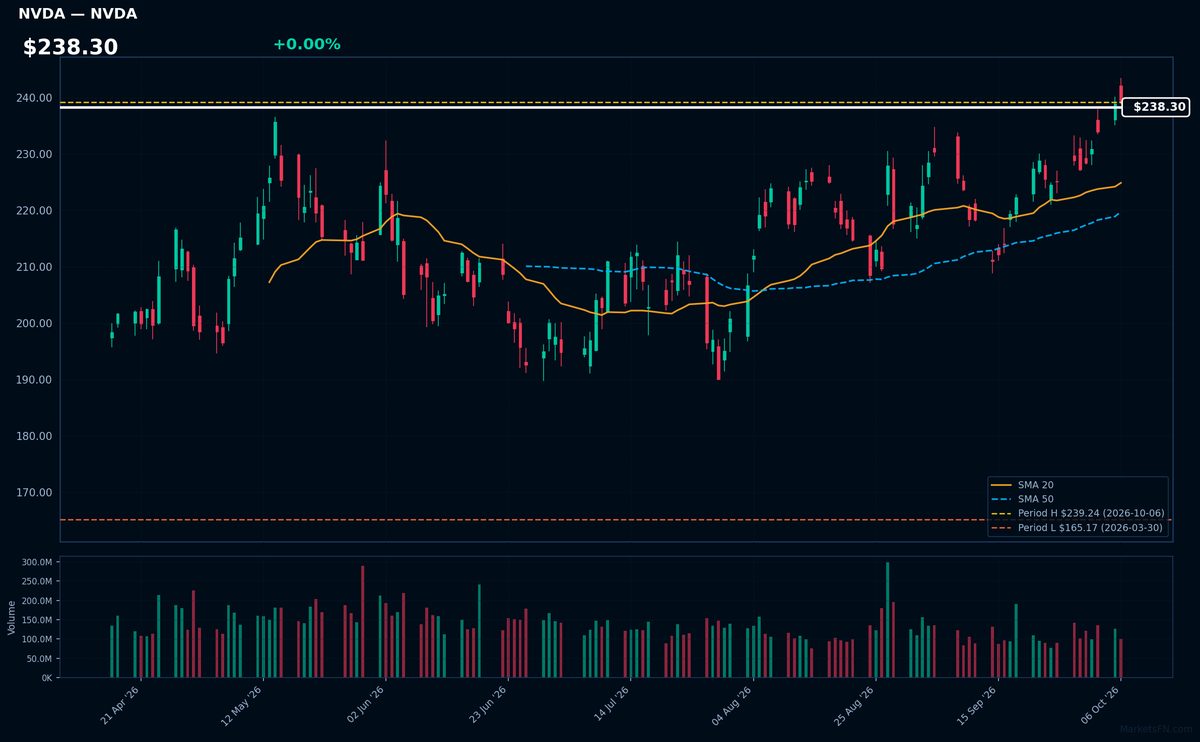
NVDA | NVIDIA Corp | Technology | Price Last: $239.24 | % Realized: +26.68% | RSI: 65.6 | % above MA200: +18.6% | Trend: Above MA20, MA50, MA200
NVIDIA designs GPUs and AI accelerators powering data centers, gaming, and autonomous systems. Investors care because its chips dominate AI training workloads, with explosive growth in datacenter revenue (not provided) making it a key AI infrastructure play.
Technically bullish: RSI(14) at 65.6 shows momentum without overbought extremes, with price > MA20 > MA50 > MA200 confirming uptrend. YTD +26.7% nears 2026 highs, suggesting breakout potential.
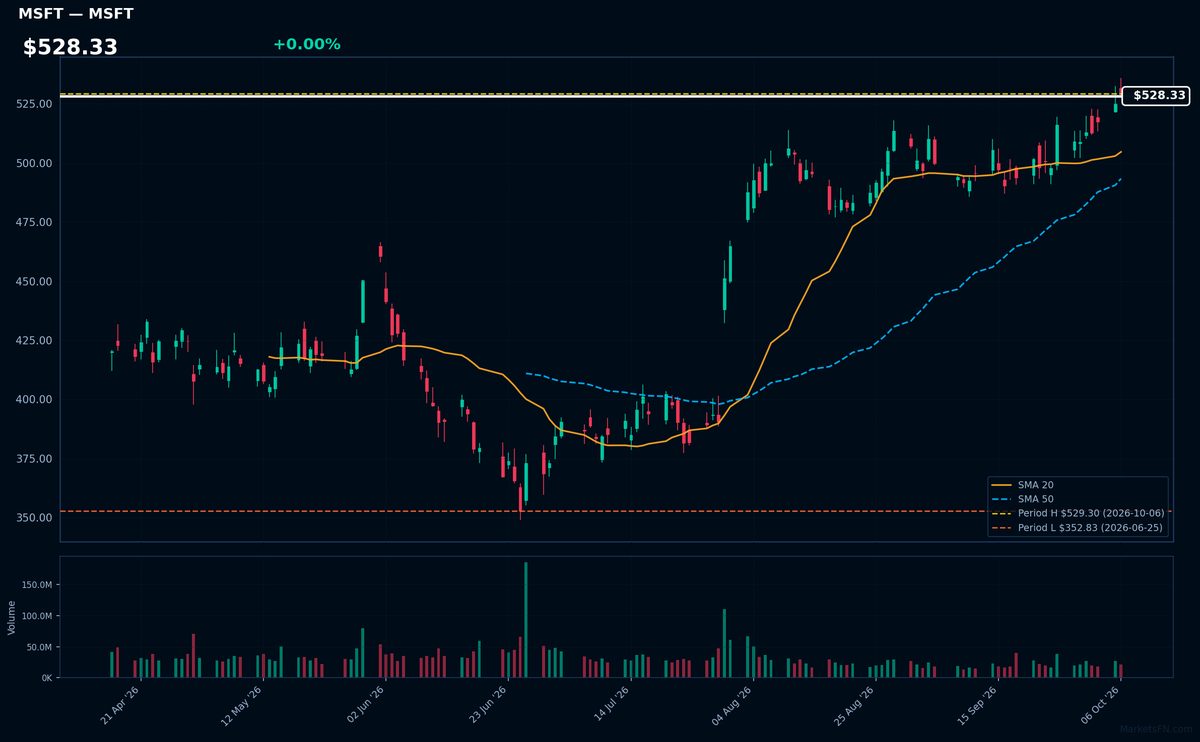
MSFT | Microsoft Corporation | Technology | Price Last: $529.30 | % Realized: +11.92% | RSI: 67.1 | % above MA200: +22.1% | Trend: Above MA20, MA50, MA200
Microsoft dominates enterprise cloud computing (Azure), productivity software (Office 365), and AI infrastructure (OpenAI partnership). Its diversified cash flows and entrenched ecosystem make it a core holding for growth-at-scale investors.
Technically bullish with RSI(14) at 67.1 and price > MA20 > MA50 > MA200. The 11.9% YTD gain shows momentum, though RSI nears overbought territory.
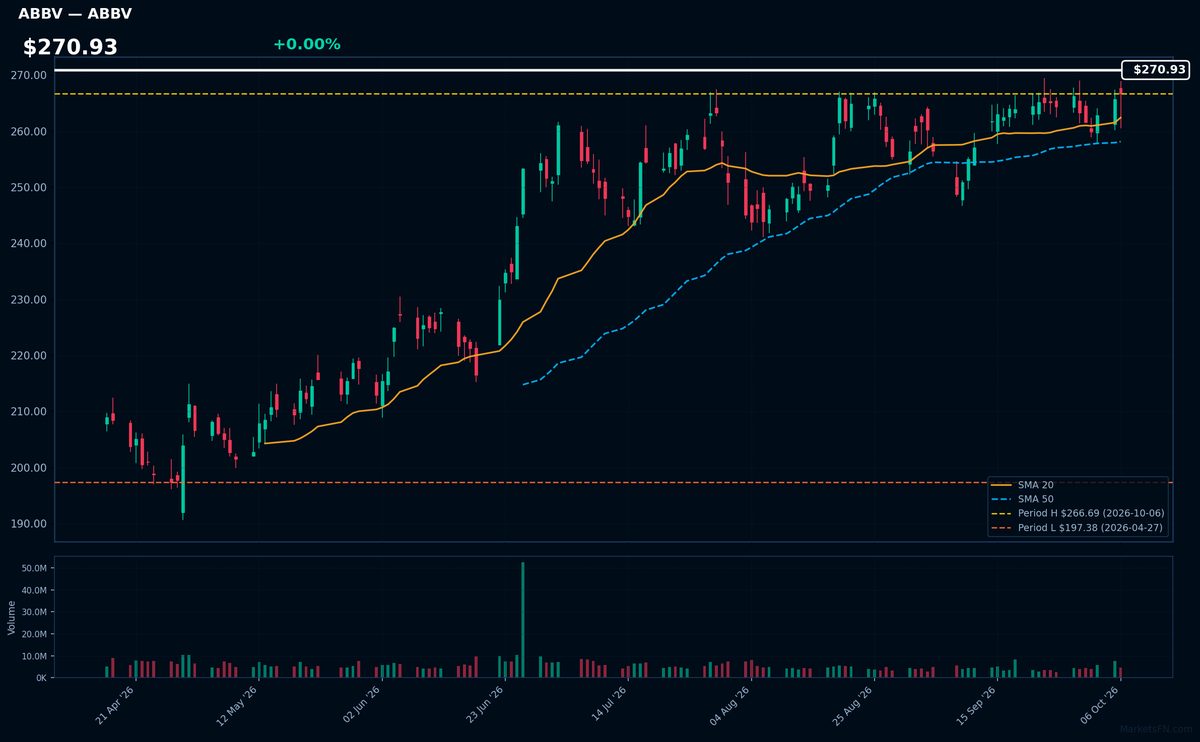
ABBV | Abbvie Inc | Healthcare | Price Last: $266.69 | % Realized: +16.30% | RSI: 65.3 | % above MA200: +14.9% | Trend: Above MA20, MA50, MA200
AbbVie is a biopharmaceutical company specializing in immunology, oncology, and neuroscience therapies. Investors should monitor its blockbuster drugs (Humira, Skyrizi) facing patent cliffs and new launches, making pipeline execution critical for sustained growth amid biosimilar competition.
ABBV shows bullish momentum (RSI 65.3, price > MA20 > MA50 > MA200) and tests YTD highs (+16.3% in 2026). The MA alignment confirms uptrend strength, though RSI nears overbought territory. Watch for breakout confirmation or pullback from resistance.
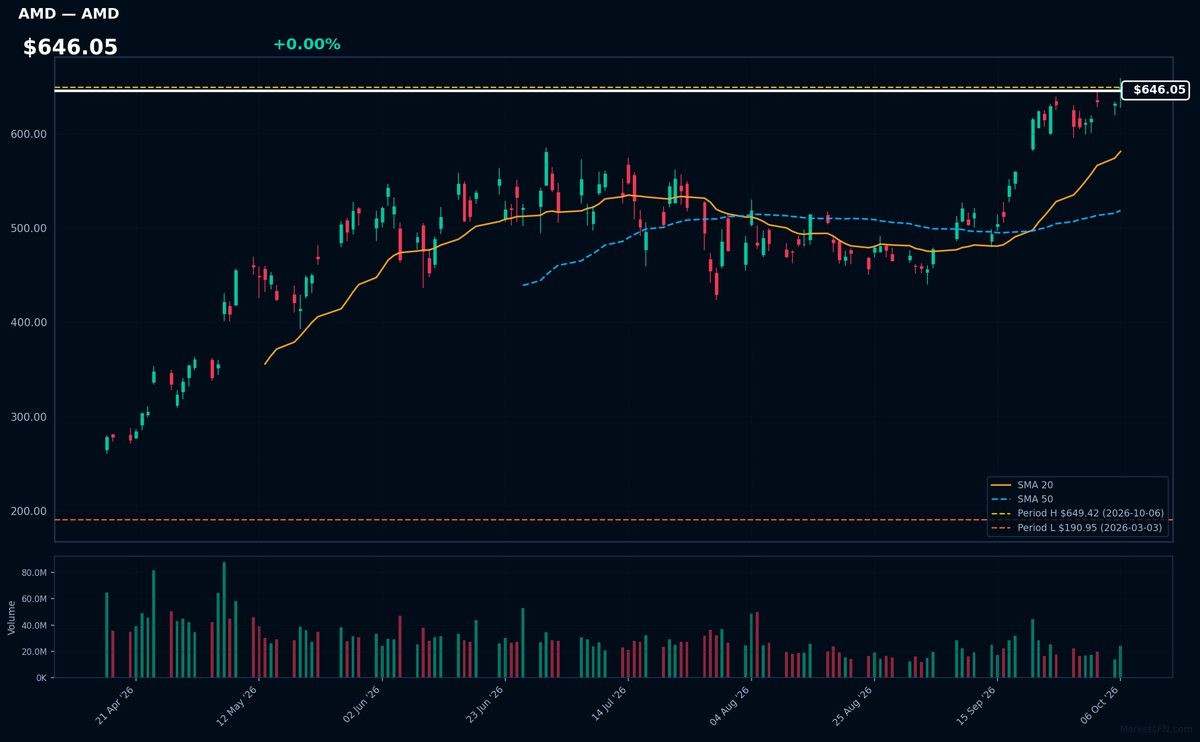
AMD | Advanced Micro Devices Inc | Technology | Price Last: $649.42 | % Realized: +190.61% | RSI: 70.8 | % above MA200: +70.3% | Trend: Above MA20, MA50, MA200
AMD designs high-performance CPUs and GPUs competing directly with Nvidia and Intel, powering AI workloads, data centers, and gaming systems. Investors care because its chips are critical for AI infrastructure, with 190.6% YTD returns showing explosive demand for its accelerators.
Technically overbought (RSI 70.8) but in strong uptrend (price > MA20 > MA50 > MA200). At YTD highs, this reflects momentum but risks short-term pullback.
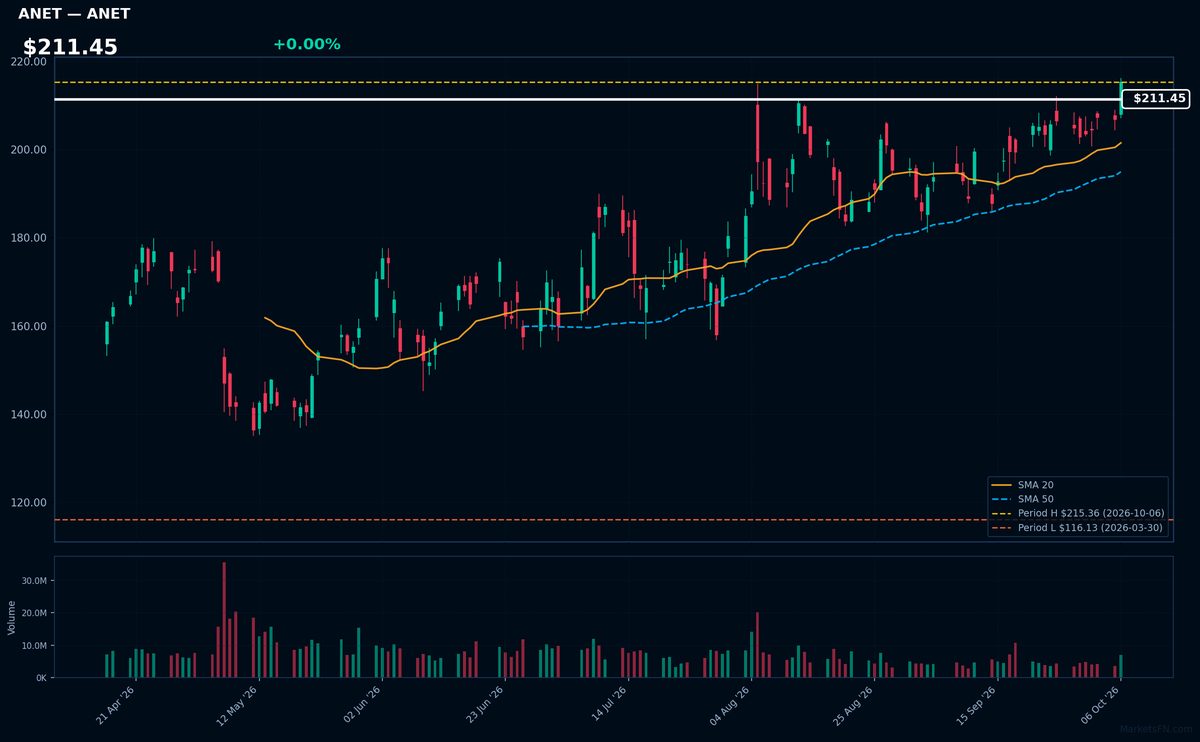
ANET | Arista Networks Inc | Technology | Price Last: $215.36 | % Realized: +61.20% | RSI: 61.3 | % above MA200: +34.4% | Trend: Above MA20, MA50, MA200
Arista Networks provides high-performance cloud networking solutions for data centers and campus environments, specializing in software-driven switches that optimize hyperscale and enterprise workloads. Investors should care because its technology underpins AI/cloud infrastructure growth.
Technically bullish with RSI(14) at 61.3 and price > MA20 > MA50 > MA200. At YTD highs after 61.2% gain, testing breakout levels.
📉 Nearest to 2026 Low
Sectors represented: Communication Services (2), Industrials (2), Healthcare (1)
| Ticker | Company | Sector | Price Last | % Realized | 2026 YTD Low Date | RSI | % above MA200 | Trend |
|---|---|---|---|---|---|---|---|---|
| BSX | Boston Scientific Corp | Healthcare | $42.19 | -55.45% | 2026-10-06 | 34.0 | -30.8% | Below MA20, MA50, MA200 |
| CMCSA | Comcast Corp | Communication Services | $21.56 | -22.12% | 2026-10-06 | 24.6 | -19.0% | Below MA20, MA50, MA200 |
| PCAR | Paccar Inc | Industrials | $109.32 | -2.01% | 2026-10-06 | 19.6 | -9.4% | Below MA20, MA50, MA200 |
| CPRT | Copart, Inc | Industrials | $26.82 | -28.99% | 2026-10-06 | 30.7 | -19.5% | Below MA20, MA50, MA200 |
| TTD | Trade Desk Inc | Communication Services | $11.92 | -68.37% | 2026-10-06 | 28.9 | -46.4% | Below MA20, MA50, MA200 |
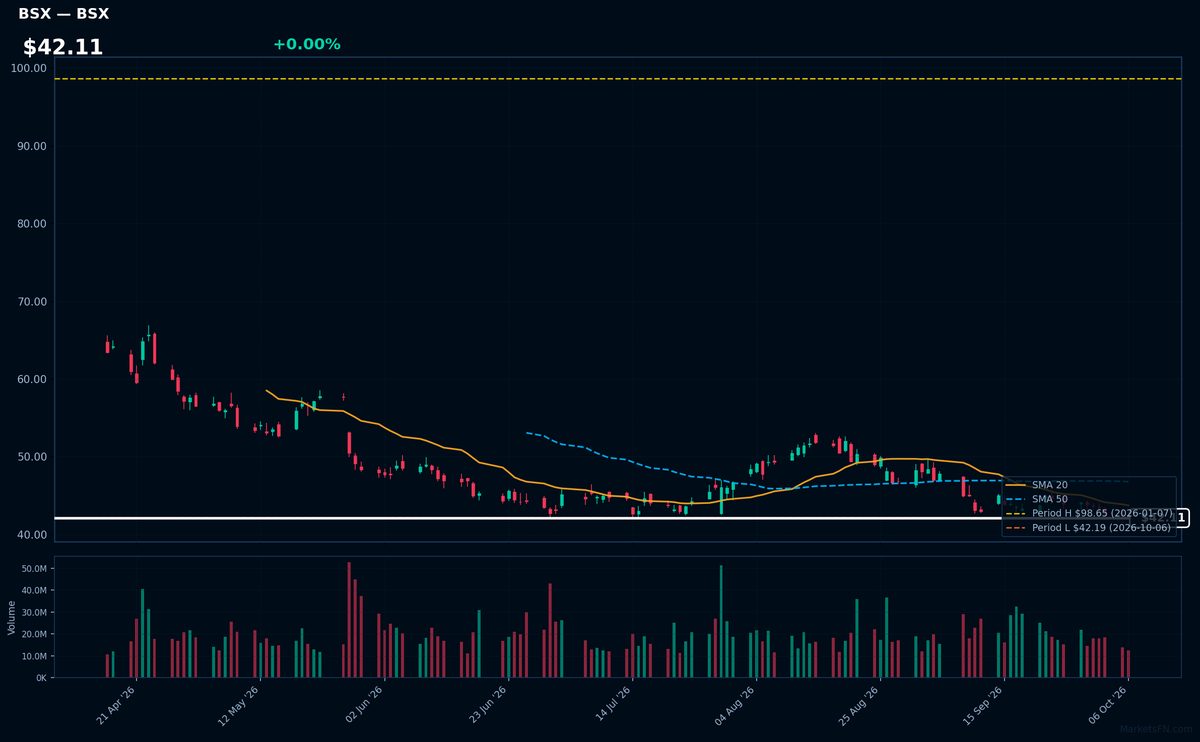
BSX | Boston Scientific Corp | Healthcare | Price Last: $42.19 | % Realized: -55.45% | RSI: 34.0 | % above MA200: -30.8% | Trend: Below MA20, MA50, MA200
Boston Scientific Corp develops minimally invasive medical devices, including stents, pacemakers, and surgical tools. Investors care because its products address high-growth areas like cardiovascular and neurological diseases, with recurring revenue from device replacements.
BSX shows severe technical weakness: RSI(14) at 34.0 confirms oversold conditions, while the bearish MA alignment (price < MA20 < MA50 < MA200) and -55.5% YTD decline signal a breakdown. Testing 2026 lows suggests critical support failure risk.
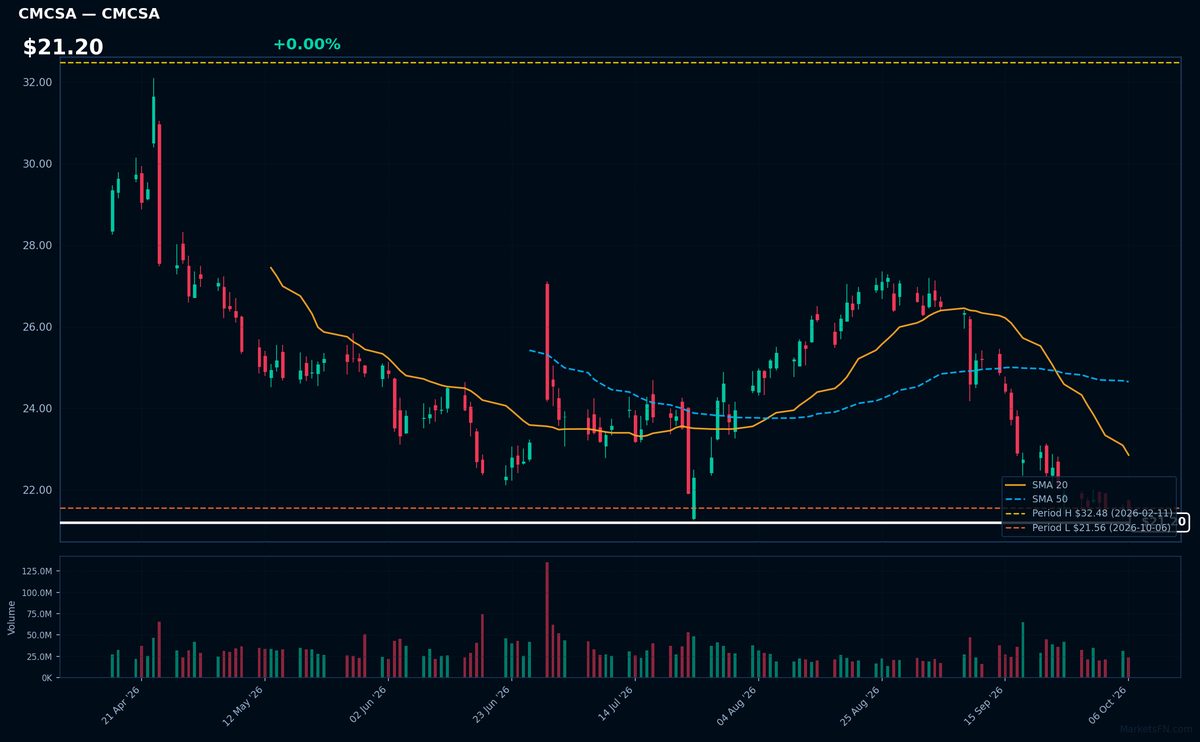
CMCSA | Comcast Corp | Communication Services | Price Last: $21.56 | % Realized: -22.12% | RSI: 24.6 | % above MA200: -19.0% | Trend: Below MA20, MA50, MA200
Comcast Corp operates as a global media and technology conglomerate, owning NBCUniversal, Sky, and Xfinity broadband/cable services. Investors monitor its cash-generating telecom infrastructure and content assets amid cord-cutting pressures.
CMCSA shows extreme technical weakness: RSI(14) at 24.6 signals oversold conditions amid a sustained downtrend (price < MA20 < MA50 < MA200). The stock tests 2026 lows after a -22.1% YTD plunge — a clear warning sign.
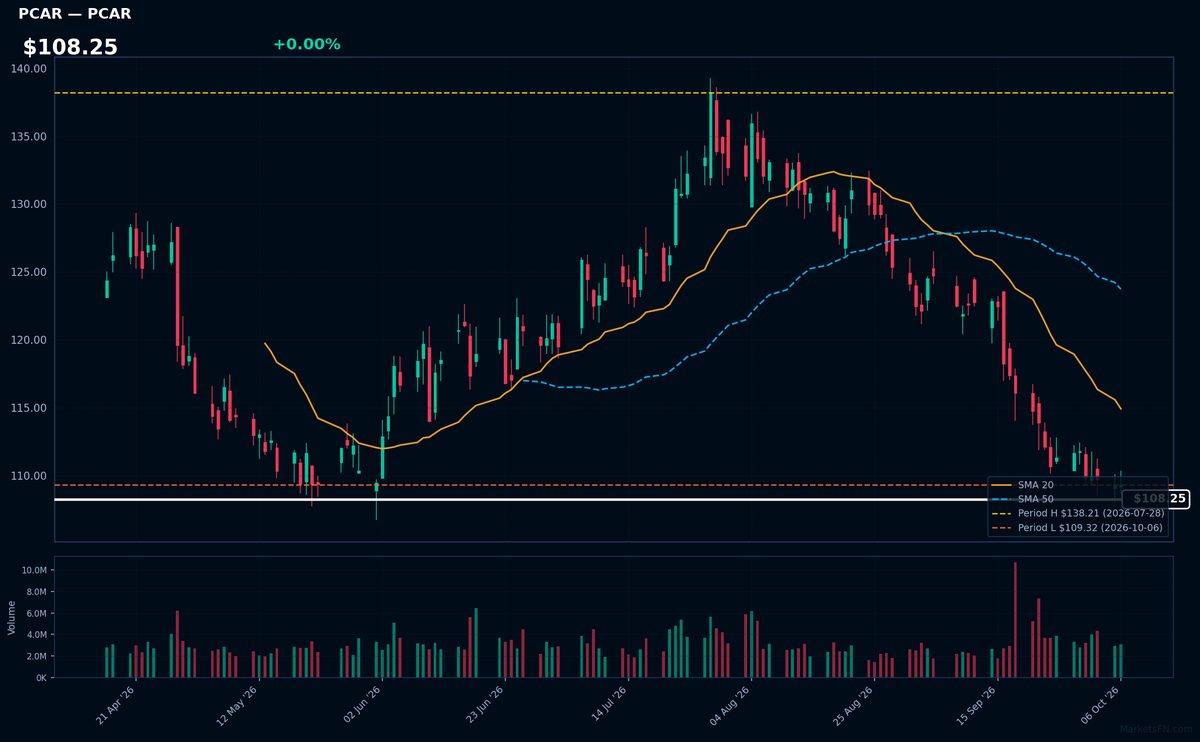
PCAR | Paccar Inc | Industrials | Price Last: $109.32 | % Realized: -2.01% | RSI: 19.6 | % above MA200: -9.4% | Trend: Below MA20, MA50, MA200
Paccar Inc designs/manufactures premium Kenworth, Peterbilt, and DAF trucks under stringent emissions standards. Investors watch PCAR for cyclical heavy-duty vehicle demand, aftermarket parts margins, and its 70+ year dividend streak — rare in capital-intensive industrials.
PCAR trades at $108.25 with extreme 19.6 RSI (oversold) below all key MAs, testing YTD lows after a -2.0% 2026 start — a potential washout or breakdown signal.
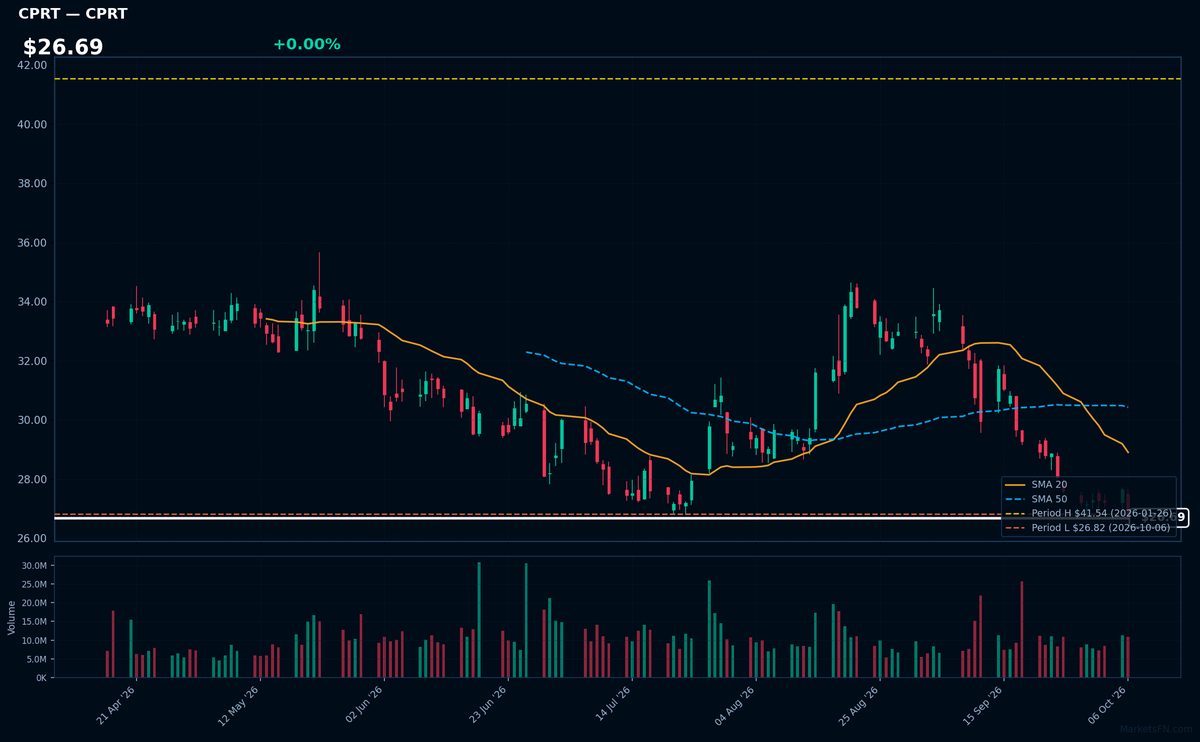
CPRT | Copart, Inc | Industrials | Price Last: $26.82 | % Realized: -28.99% | RSI: 30.7 | % above MA200: -19.5% | Trend: Below MA20, MA50, MA200
Copart operates an online vehicle auction platform, specializing in salvage and insurance cars. Investors care because its asset-light model dominates a niche market with high barriers to entry, generating consistent cash flows.
Technically dire: RSI(14) at 30.7 shows oversold conditions amid a sustained downtrend (price < MA20 < MA50 < MA200). Testing YTD lows after -29.0% decline warns of continued weakness.
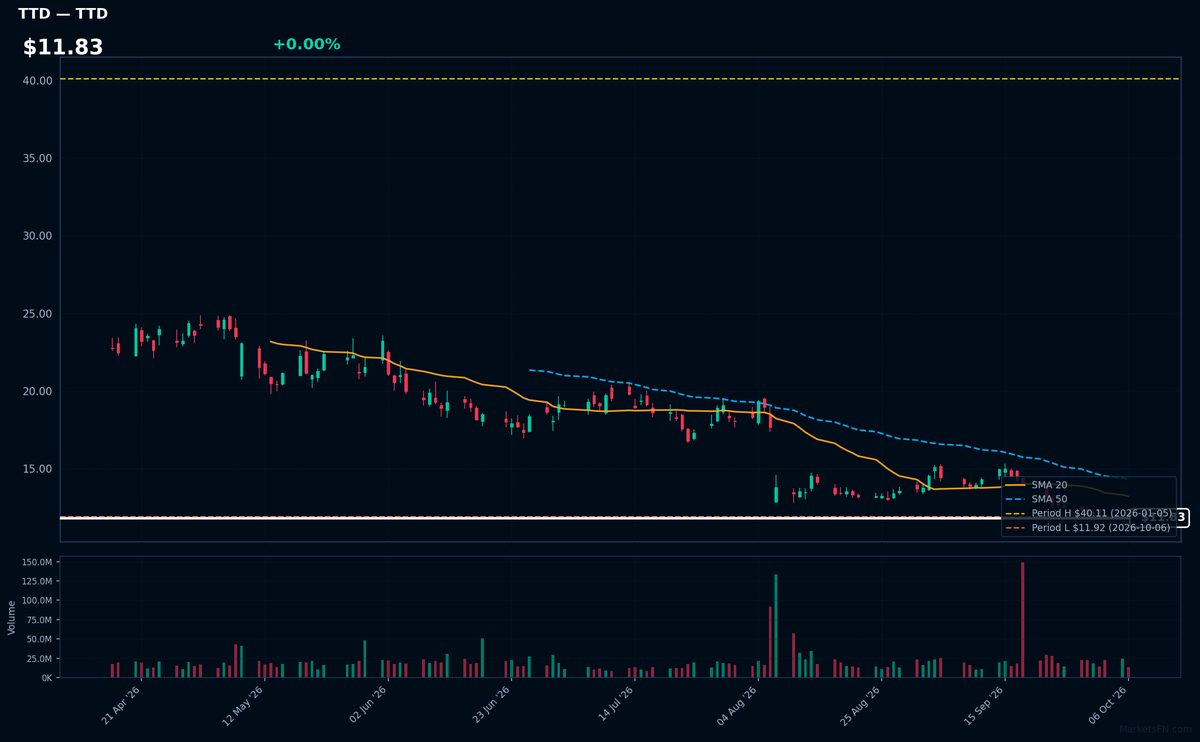
TTD | Trade Desk Inc | Communication Services | Price Last: $11.92 | % Realized: -68.37% | RSI: 28.9 | % above MA200: -46.4% | Trend: Below MA20, MA50, MA200
Trade Desk Inc operates a digital ad-buying platform that automates media purchases for advertisers. Investors watch TTD as a proxy for digital ad spend trends, with its cloud-based system competing against giants like Google in programmatic advertising.
TTD shows extreme technical weakness: RSI(14) at 28.9 (oversold), with bearish MA alignment (price < MA20 < MA50 < MA200) and just 0.0% above YTD lows. The -68.4% YTD decline signals severe breakdown, not momentum.
Market Commentary
The S&P 500 stocks trading at or near their 2026 highs—NVIDIA, Microsoft, AbbVie, AMD, and Arista Networks—reflect sustained investor confidence in technology and healthcare innovation. These companies dominate their respective niches, from AI semiconductors (NVDA, AMD) to cloud infrastructure (MSFT, ANET) and biopharmaceuticals (ABBV). Conversely, stocks hovering near 2026 lows—Boston Scientific, Comcast, Paccar, Copart, and Trade Desk—signal challenges in sectors like industrials (PCAR), media (CMCSA), and ad tech (TTD), where macroeconomic pressures or cyclical headwinds may be weighing on performance.
The divergence highlights a market favoring secular growth themes over cyclical or rate-sensitive industries. Tech and healthcare leaders benefit from resilient earnings and AI-driven demand, while weaker performers face margin compression or slower adoption trends. The clustering of extremes suggests a selective rally, with capital concentrated in megacaps and innovators while broader sectors lag. Investors should note whether this bifurcation persists or rotates as economic conditions evolve.
Key watchpoints include earnings revisions for near-high stocks to validate valuations, and signs of stabilization in laggards like Comcast or Trade Desk that could signal contrarian opportunities. Macro factors—Fed policy, commodity prices, and AI adoption curves—will dictate whether the current extremes mark a peak or a pause before broader participation.
Methodology: All 503 S&P 500 constituents screened. Close prices downloaded from 2026-01-01. Period high = highest close since Jan 1 2026; period low = lowest close since Jan 1 2026. Distance = (current price / period extreme − 1) × 100. Technical indicators computed on up to 1 year of daily OHLCV data.
Disclaimer: For informational purposes only. Not investment advice. Past performance is not indicative of future results.