NZD/USD: Up 0.17% to 0.5888 — Price Below SMA-20
MarketsFN Team
NZD/USD: Up 0.17% to 0.5888 — Price Below SMA-20
Published: September 04, 2026 · MarketsFN Team · US Session
| Pair | Rate | Change | RSI(14) | SMA-20 | SMA-50 | 52W High | 52W Low | Pivot | R1 | S1 |
|---|---|---|---|---|---|---|---|---|---|---|
| NZD/USD | 0.5888 | +0.17% | 47.4 | 0.5905 | 0.5834 | 0.6075 | 0.5581 | 0.5868 | 0.5901 | 0.5846 |
📊 Support & Resistance Levels
Dynamic Trendlines
| Level | Type | Direction | Distance |
|---|---|---|---|
| 0.5798 | 20d Support | ↘ descending | -1.53% / 90.1 pips |
| 0.5995 | 20d Resistance | → flat | +1.81% / 106.8 pips |
| 0.5808 | 50d Support | ↗ ascending | -1.36% / 79.9 pips |
| 0.6034 | 50d Resistance | ↗ ascending | +2.47% / 145.5 pips |
Static Levels
| Level | Type | Touches | Distance |
|---|---|---|---|
| 0.5994 | Resistance | 2× | +1.91% / 112.6 pips |
| 0.5831 | Support | 2× | -0.85% / 49.9 pips |
| 0.5814 | Support | 2× | -1.15% / 67.5 pips |
| 0.5710 | Support | 2× | -2.92% / 171.7 pips |
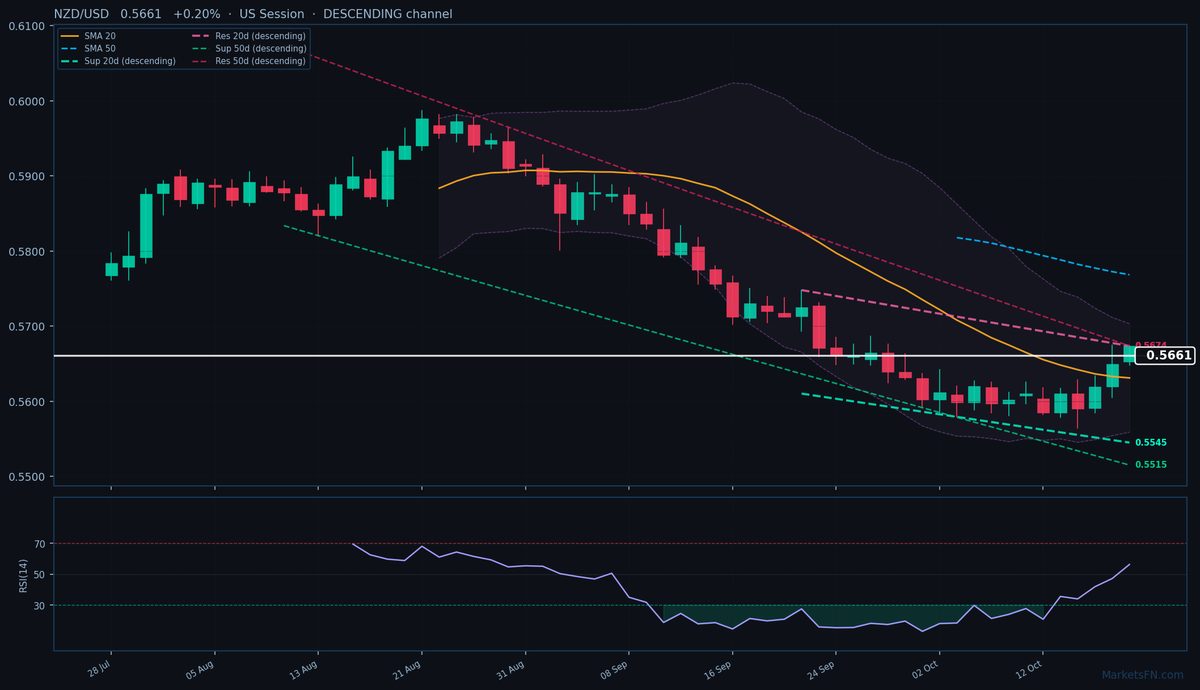
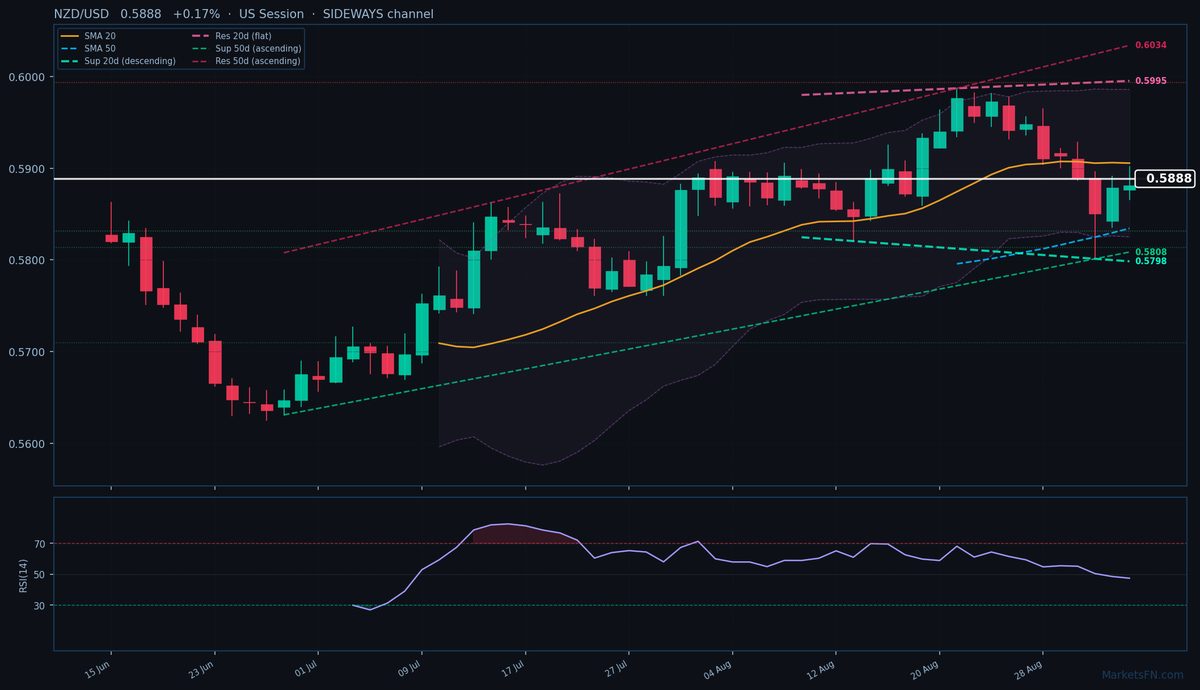
NZD/USD is trading at 0.5888 (+0.17%), caught in a consolidation phase between its SMA-20 (0.5905, 17.7 pips above) and SMA-50 (0.5834, 53.9 pips below). The pair remains trapped in a sideways 20-day dynamic channel, with descending support at 0.5798 (90.1 pips below) and flat resistance at 0.5995 (106.8 pips above). However, the broader 50-day channel shows an ascending bias, with rising support at 0.5808 (79.9 pips below) and resistance at 0.6034 (145.5 pips above), suggesting underlying bullish pressure despite near-term indecision.
Key static levels frame the immediate range, with S1 at 0.5831 (49.9 pips below) and R1 at 0.5994 (112.6 pips above), both tested twice historically. The RSI at 47.4 confirms neutral momentum, aligning with the tight daily range (ATR of 47 pips) and pivot cluster near 0.5868. Today’s push above the previous close (0.5879) faces immediate resistance at the session high (0.5901), while failure to hold gains could see a retest of S1.
Short-term, the pair lacks conviction — neither breaking the 20-day SMA nor surrendering the 50-day SMA. A close above 0.5905 (20-day SMA) would signal bullish intent toward R1, while a drop below S1 (0.5831) risks testing the dynamic support confluence near 0.5808–0.5798. Watch US session flows for direction, with today’s narrow range (35 pips) suggesting impending volatility. The 50-day ascending channel’s slope favors eventual upside, but near-term traders await a clear break from the SMA squeeze.
Disclaimer
The content on MarketsFN.com is provided for educational and informational purposes only and does not constitute financial advice. All investments involve risk and past performance does not guarantee future results.