NZD/USD: Up 0.16% to 0.5957 — Testing 52-Week High
MarketsFN Team
NZD/USD: Up 0.16% to 0.5957 — Testing 52-Week High
Published: August 28, 2026 · MarketsFN Team
| Pair | Rate | Change | RSI(14) | SMA-20 | SMA-50 | 52W High | 52W Low | Pivot | R1 | S1 |
|---|---|---|---|---|---|---|---|---|---|---|
| NZD/USD | 0.5957 | +0.16% | 62.7 | 0.5908 | 0.5812 | 0.5982 | 0.5641 | 0.5948 | 0.5958 | 0.5938 |
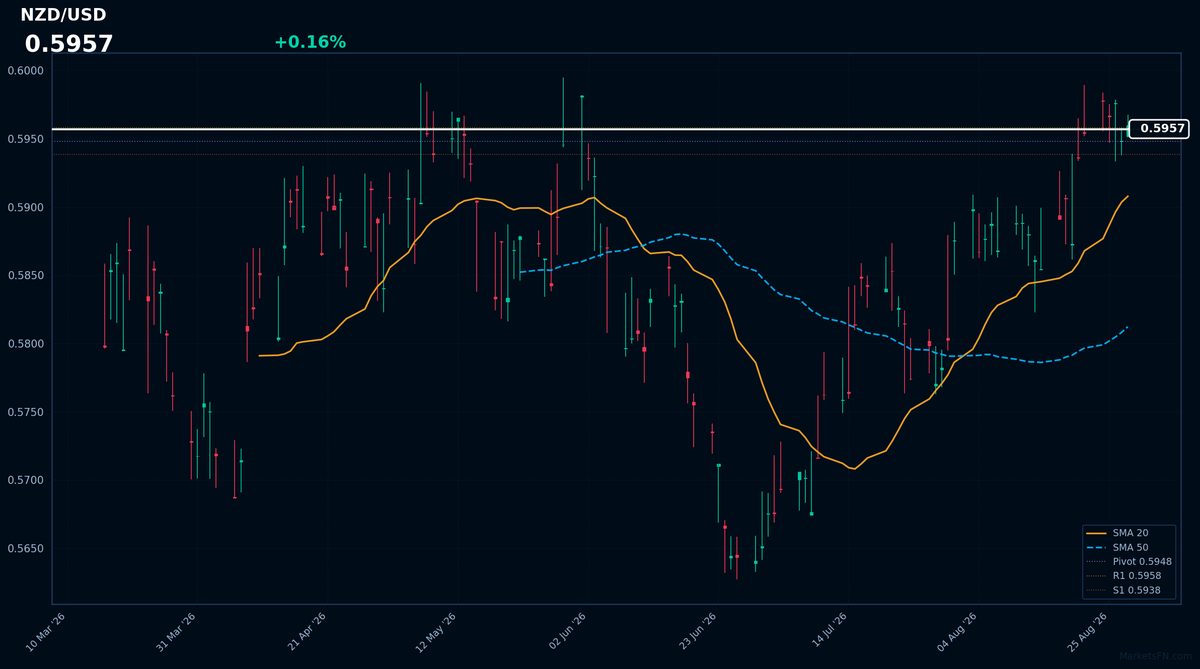
NZD/USD is trading at 0.5957 (+0.16%) as of August 28, 2026, during the European session, with the pair showing a modest gain from the previous close of 0.5948. The current rate is within its day range of 0.5951 – 0.5967, and remains near the upper end of its 52-week range of 0.5641 – 0.5982, indicating a relatively strong NZD performance over the past year.
The technical picture suggests an uptrend, as NZD/USD is trading above both its 20-day and 50-day simple moving averages, at 0.5908 and 0.5812, respectively. The RSI(14) stands at 62.7, in neutral territory, indicating neither overbought nor oversold conditions. The ATR(14) of 0.0046 suggests moderate daily volatility.
Key levels to watch include the pivot at 0.5948, with R1 resistance at 0.5958 and S1 support at 0.5938. Given the current rate, the pair is testing the R1 level. A break above this resistance could signal further upside, while a drop below the S1 support may indicate a reversal.
Looking ahead, the NZD/USD is likely to continue its uptrend if it sustains above the 0.5948 pivot. A catalyst for the next move could be the upcoming US GDP data release, which may influence USD strength and, consequently, NZD/USD dynamics.
Disclaimer
The content on MarketsFN.com is provided for educational and informational purposes only. It does not constitute financial advice or investment recommendations. All investments involve risks and past performance does not guarantee future results. You are solely responsible for your investment decisions.