S&P 5005,963+0.54%
NASDAQ21,443+0.87%
DOW43,892+0.31%
DAX23,888+0.44%
FTSE 1008,721-0.12%
EUR/USD1.1465+0.07%
GBP/USD1.3220+0.14%
USD/JPY161.31-0.03%
Gold3,241+0.22%
WTI Oil76.40+0.81%
Bitcoin103,241+1.43%
10Y UST4.47%-9bp
S&P 5005,963+0.54%
NASDAQ21,443+0.87%
DOW43,892+0.31%
DAX23,888+0.44%
FTSE 1008,721-0.12%
EUR/USD1.1465+0.07%
GBP/USD1.3220+0.14%
USD/JPY161.31-0.03%
Gold3,241+0.22%
WTI Oil76.40+0.81%
Bitcoin103,241+1.43%
10Y UST4.47%-9bp
MarketsFN
Economics

Mortgage rates inch up to 6.66%, pushing monthly payments $87 higher than last year

MarketsFN Data Team
4 min read
Mortgage rates inch up to 6.66%, pushing monthly payments $87 higher than last year
Housing · Mortgage Rates · Weekly Tracker
6.66%
30-Year Fixed Mortgage Rate
▲ 1.0 bps week-on-week  ·  $2,571/mo on a $400,000 loan

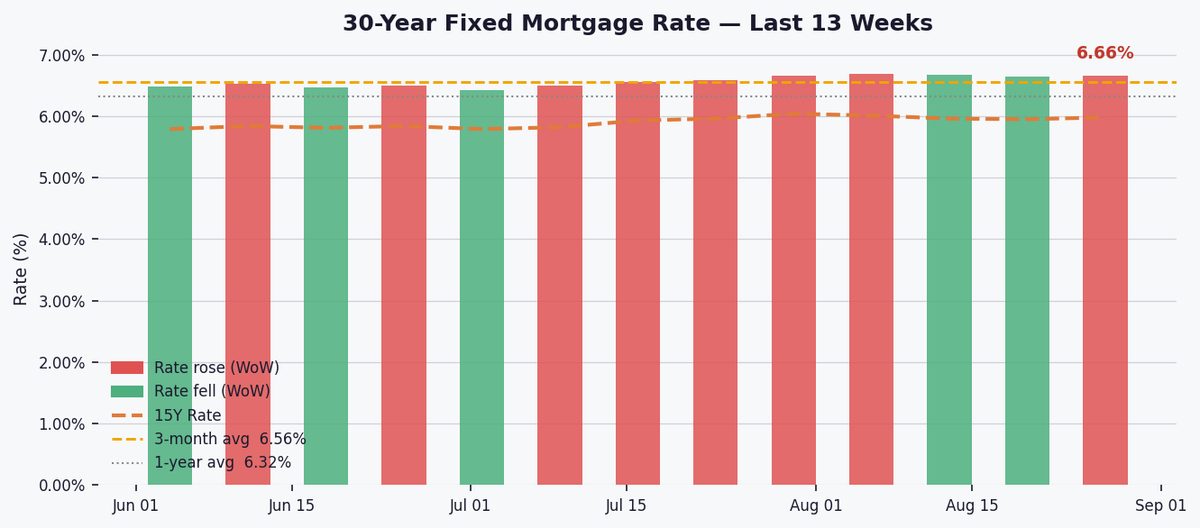
The 30-year fixed mortgage rate rose slightly to 6.66% this week (+0.10 bps WoW), squeezing affordability as buyers now pay $2,571 monthly on a $400k loan — $87 more than a year ago.

Today’s 30-year rate remains above its 3-month (6.56%), 1-year (6.32%), and 5-year (6.14%) averages, hovering near the 52-week high of 6.69%. A $400k mortgage now costs $2,571 monthly, up from $2,484 a year ago at 5.98%, reflecting the 50 bps YTD climb in borrowing costs.

Rates are pressured by the 10Y Treasury yield (4.75%) and Fed Funds Rate (3.63%). The 1.91 pp mortgage-Treasury spread suggests lenders remain cautious, pricing in economic uncertainty and inflation risks despite stable Fed policy expectations.

36-month trend chart
Fig. 2 — 30Y mortgage (red), 15Y mortgage (orange), Fed Funds Rate (dark blue), 10Y Treasury (light blue) over 36 months. Bottom panel: mortgage–Treasury spread — a wide spread signals elevated lender risk premium.

Watch for Fed commentary on inflation and Friday’s jobs report, which could sway Treasury yields. Seasonal cooling in housing demand may ease upward rate pressure, but sticky inflation could prolong high borrowing costs.

Key Statistics at a Glance

Week endingSeptember 01, 2026
30Y Fixed Rate6.66%
WoW change▲ 1.0 bps
YTD change+50.0 bps
15Y Fixed Rate5.98%
15Y WoW▲ 3.0 bps
3-month average6.56%
1-year average6.32%
5-year average6.14%
52-week high6.69%
52-week low5.98%
Fed Funds Rate3.63%
10Y Treasury4.75%
Mortgage–10Y Spread1.91 pp
Monthly pmt $400k/30Y$2,571
vs 1 year ago▲ $87/month
Data: Federal Reserve Bank of St. Louis (FRED) · Series: MORTGAGE30US, MORTGAGE15US, FEDFUNDS, DGS10 · 30Y & 15Y rates: Freddie Mac Primary Mortgage Market Survey, released every Thursday.
#Mortgage Rates#30-Year Fixed Rate#15-Year Fixed Rate#Housing Market#Freddie Mac#Real Estate#Federal Reserve#10-Year Treasury#FRED#Home Buying#Interest Rates

Related Articles

Fed balance sheet shrinks to $6.73T, reserves hit critical $356.2B as QT drains liquidity
Economics

Fed balance sheet shrinks to $6.73T, reserves hit critical $356.2B as QT drains liquidity

MarketsFN Data Team
5 minSep 1, 2026
US jobless claims dip to 203,000 as labor market holds steady
Economics

US jobless claims dip to 203,000 as labor market holds steady

MarketsFN Data Team
4 minSep 1, 2026
10Y Yield Jumps 6bps to 4.73% as Curve Stays Positive
Economics

10Y Yield Jumps 6bps to 4.73% as Curve Stays Positive

MarketsFN Data Team
4 minSep 1, 2026