Gold: Up 0.9% to $4680.90 — Overbought at RSI 76 — Momentum Risk
QuoteReporter
•2 min read
Gold: Up 0.9% to $4680.90 — Overbought at RSI 76 — Momentum Risk
Analysis Date: August 26, 2026
📊 Current Market Data
CURRENT PRICE
$4680.90
DAILY CHANGE
+0.92%
WEEKLY CHANGE
+4.27%
52W HIGH
$5586.20
52W LOW
$3371.10
💡 Key Market Factors
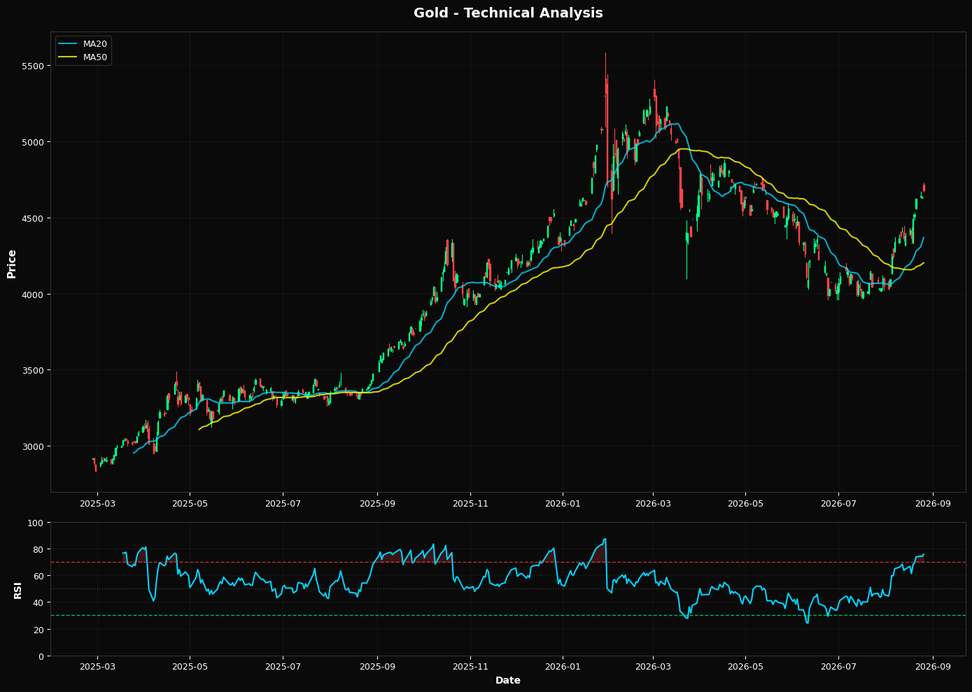
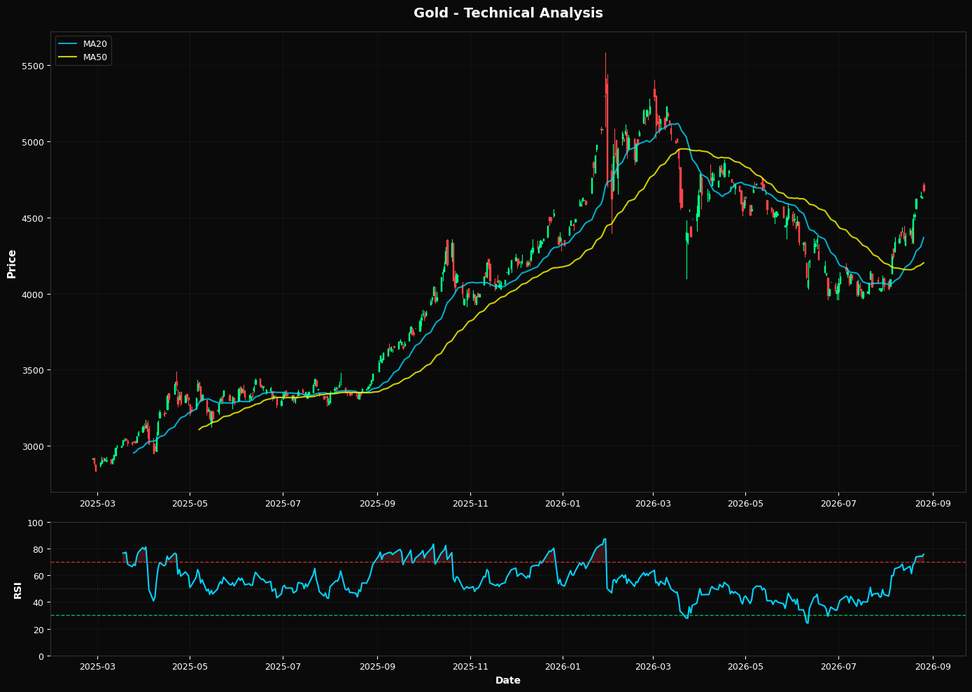
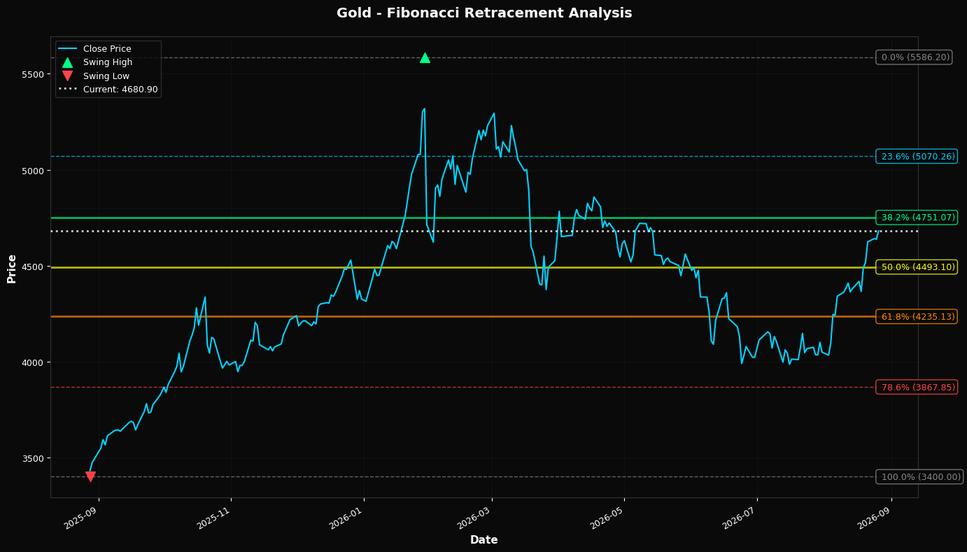
**Gold's Momentum Faces a Critical Test at Key Technical Levels Amid Inflation Concerns** Gold's recent rally, with a weekly gain of +4.27%, is primarily driven by inflationary pressures that are reigniting investor interest in the precious metal as a hedge. With inflation remaining stubbornly high, the Federal Reserve's policy decisions are under intense scrutiny. The Fed's potential to maintain or even increase interest rates could temper gold's ascent, as higher rates typically bolster the U.S. dollar, making gold less attractive. However, the current macro environment suggests that inflation concerns are outweighing the impact of a strong dollar, propelling gold prices upward. Technically, gold is exhibiting strong bullish momentum, as indicated by its RSI(14) of 75.7, which suggests overbought conditions. The price is significantly above its 20-day moving average of $4368.89 and the 50-day moving average of $4202.47, reinforcing the bullish trend. However, it is approaching a critical resistance at the 38.2% Fibonacci retracement level of $4751.07. This level could act as a pivotal point; a break above it might signal further upside potential, while failure to breach could trigger a pullback. The current price of $4680.90 is also above the 200-day moving average of $4508.93, underscoring the strength of the current uptrend. A key risk to this bullish outlook is the upcoming U.S. inflation data release. Should the data indicate a cooling in inflation, it could prompt a reassessment of the Fed's rate trajectory, potentially strengthening the dollar and putting downward pressure on gold. Conversely, persistently high inflation figures would likely reinforce gold's appeal as a safe haven, supporting further gains. The market may be underestimating the potential for a significant shift in Fed policy if inflation data surprises to the upside. Such a scenario could lead to a more aggressive rate hike path, which would be a critical test for gold's resilience. The upcoming inflation report will be crucial in confirming or challenging the current bullish narrative. A higher-than-expected inflation reading would likely validate the ongoing rally, while a softer figure could catalyze a correction, especially if gold fails to break through the $4751.07 resistance.📈 Technical Indicators Summary
RSI (14)
75.7
50-Day MA
$4202.47
200-Day MA
$4508.93
Fib Level
38.2%
📊 Technical Analysis Chart (18-Month View)
📐 Fibonacci Retracement Analysis
🎯 Key Trading Levels
Key Fibonacci Levels:
- 38.2%: $4751.07
- 50.0%: $4493.10
- 61.8%: $4235.13
Support: $3400.00 (Swing Low), $4202.47 (50-Day MA)
Resistance: $5586.20 (Swing High)
Disclaimer
The content on MarketsFN.com is provided for educational and informational purposes only. It does not constitute financial advice, investment recommendations, or trading guidance. All investments involve risks, and past performance does not guarantee future results. You are solely responsible for your investment decisions and should conduct independent research and consult a qualified financial advisor before acting. MarketsFN.com and its authors are not liable for any losses or damages arising from your use of this information.